Bitcoin has broken above $75,500 after a sharp rally lifted it to its highest level in more than three months. The advance followed larger U.S. Treasury buybacks and renewed inflows into Bitcoin ETFs. Heavy short liquidations added further momentum to the move.
Bitcoin’s advance began on August 19, when the U.S. Treasury announced plans to at least double its long-term bond buybacks. $BTC then moved above $70,000 on August 20 before climbing through $72,000 and later reaching above $75,500.
What Are Analysts Saying About Bitcoin’s Rally?
The sharp Bitcoin rally has divided market analysts over whether the move marks a genuine breakout or a powerful short squeeze.
In an X post, Joe Consorti highlighted the move as unusually strong and suggested that the market could be seeing the rally it had been waiting for. His comments came as Bitcoin broke through several major resistance levels in quick succession.
Okay this is getting ridiculous.
I don’t ever remember a bear market rally that was this violent.
Fairly confident this is what we’ve been waiting for.
Don’t blink 🫡 pic.twitter.com/b2hiPt0HtV
— Joe Consorti (@JoeConsorti) August 21, 2026
Peter Schiff took the opposite view. He argued that Bitcoin’s move above $72,000 was a fakeout rather than a confirmed breakout.
Schiff also linked the rally to the Treasury buyback announcement. He argued that investors expecting easier liquidity to lift Bitcoin should instead favor gold.
Treasury Buybacks Add Fuel to Bitcoin Rally
The U.S. Treasury said it would increase the maximum size of buyback operations for longer-dated Treasury securities from $2 billion to at least $4 billion per operation. The program covers securities with maturities between 10 and 30 years.
The announcement initially pushed long-term Treasury yields lower. Bitcoin responded alongside other risk assets as investors viewed the move as supportive for market liquidity.
The rally then extended beyond $75,500. According to the CoinMarketCap data, Bitcoin broke through $75,500, marking another major step higher after the earlier moves above $70,000 and $72,000.
Why Did Bitcoin Rally on Short Liquidations and ETF Inflows?
Short liquidations became a major source of buying pressure as Bitcoin moved through resistance. More than $2.7 billion in crypto short positions were liquidated during the initial surge.
The liquidation wave continued as $BTC advanced toward $73,000 and then above $75,000. Total crypto short liquidations during the broader rally exceeded $3 billion.
However, CoinGlass data showed that another $788.64 million in Bitcoin positions were liquidated over the following 24 hours, including $748.61 million in short positions.
U.S. spot Bitcoin ETFs also recorded fresh inflows during the rally. Farside Investors data showed $517.2 million in net inflows on August 19, with BlackRock’s IBIT leading the gains. ETF inflows remained positive on August 20, reaching $606.29 million.
Bitcoin Faces Profit-Taking Pressure
Bitcoin’s return above the short-term holder cost basis creates another test. The short-term holder realized the price was recently estimated near $67,900, based on the average acquisition price of holders who had owned Bitcoin for less than three months.
Bitcoin is now well above that level. Holders who were previously underwater therefore have more room to sell at breakeven or take profits.
CryptoQuant data also showed a major increase in profit-side UTXO activity on Binance. The reading indicated that an unusually large amount of Bitcoin was moving while holders were sitting on unrealized gains.
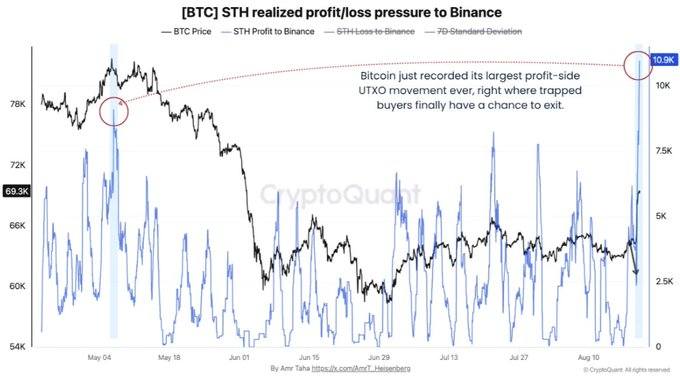
Bitcoin therefore needs continued demand to absorb this supply. Strong buying alongside profit-taking would support the breakout, while heavy selling could expose the market to a pullback.
What Bitcoin Price Levels Could Confirm the Breakout?
The $70,000 area is now one of the most important levels for Bitcoin. The cryptocurrency spent much of the recent recovery below that threshold before breaking through it during the latest rally.
A sustained hold above $70,000 would strengthen the breakout structure. A move back below the level would weaken the bullish setup, especially if ETF inflows and spot demand also lose momentum.
The $72,000 region is another important level. Bitcoin moved through it during the latest advance, making it a potential support area if the price pulls back.
However, the next major technical target is near $77,489, based on the 78.6% Fibonacci retracement of the decline from $82,850 to $57,800. A sustained break above that level would bring the $82,850 swing high back into focus.
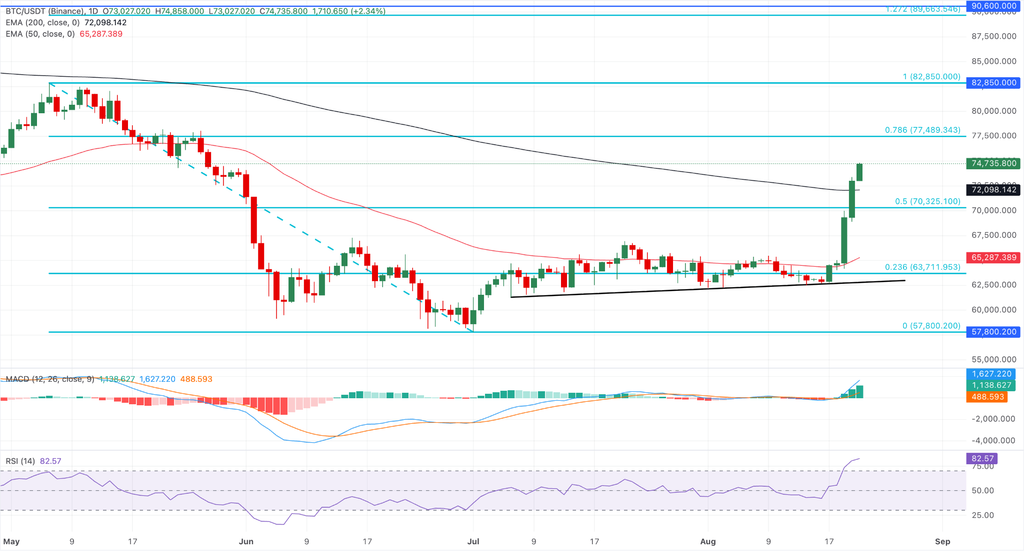
Bitcoin is trading above its major moving averages, while the MACD has strengthened. The RSI near 82 shows overbought conditions, raising the risk of a short-term pullback if buying pressure weakens.
The next stage will show whether those forces can remain active after the largest wave of forced buying has passed. Holding above $70,000 and $72,000 would strengthen the recovery, while a break above $77,489 would provide another major bullish signal.
Related: S&P 500 Is on Pace for Its 2nd-Best Decade: What It Means for Bitcoin Holders