Bitcoin is testing a crucial technical area near $80,000, with analysts watching whether the latest rebound can develop into a broader bottom or fade back into the recent range. Two $BTC charts outline very different time horizons, with one pointing to a potentially powerful long-term reversal structure and the other warning that short-term weakness could still drag price toward $70,000-$72,000.
Bitcoin’s $78K-$82K Neckline Could Define a Broader Bottoming Structure
Jelle’s chart presents a slow-burn bullish scenario for Bitcoin in which $BTC remains range-bound for months rather than immediately reclaiming six figures. The projected path would keep price above the major 2026 lows while allowing a large inverse head-and-shoulders structure to develop beneath a key resistance zone near $80,000.
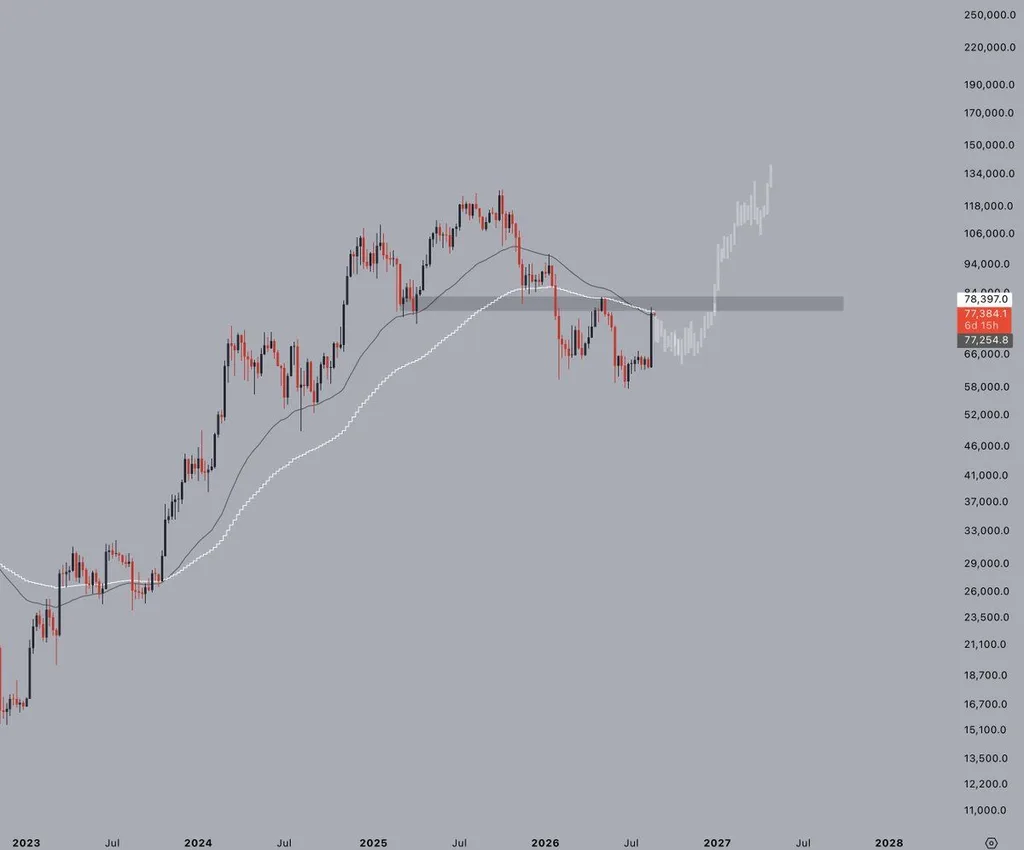
Bitcoin $BTC 78K-82K iH&S Neckline. Source: Jelle on X
Bitcoin is trading near $77,400 on the chart, placing price directly beneath a broad resistance area centered around the upper-$70,000s to low-$80,000s. That zone is the most important technical feature in Jelle’s setup because it could eventually act as the neckline of a large inverse head-and-shoulders pattern.
The chart does not project an immediate breakout. Instead, Jelle sketches another period of weakness and consolidation, with Bitcoin retreating toward the mid-$60,000 area before gradually forming a higher low. Such a move would fit his argument that $BTC could frustrate both sides of the market: bears waiting for another drop below $60,000 would remain unfilled, while bulls expecting a rapid return to $100,000 would also have to wait.
From a pattern perspective, the projected consolidation would help complete the right side of the inverse head-and-shoulders formation. The deeper 2026 decline would represent the head, while shallower lows on either side could form the two shoulders. The setup would remain incomplete, however, until Bitcoin decisively breaks above the neckline region.
A sustained move through roughly $80,000-$84,000 would provide stronger confirmation that the proposed bottoming structure is resolving higher. The chart’s projected path then shows $BTC accelerating toward the $100,000 area and eventually extending into the $120,000-$130,000 range in 2027.
Until that breakout occurs, the structure remains a scenario rather than a confirmed reversal. A renewed decline through the recent lows, particularly a breakdown toward or below $60,000, would weaken the higher-low thesis and undermine the projected inverse head-and-shoulders formation.
Bitcoin’s $81.4K Deviation Level Keeps Range-Low Retest in Focus
Kaz’s lower-time-frame Bitcoin setup treats the move above $80,000 as a potential deviation rather than the start of a sustained breakout. The key question is whether $BTC can clear roughly $81,400; failure there would keep the analyst’s projected rotation back toward the bottom of the range in play.
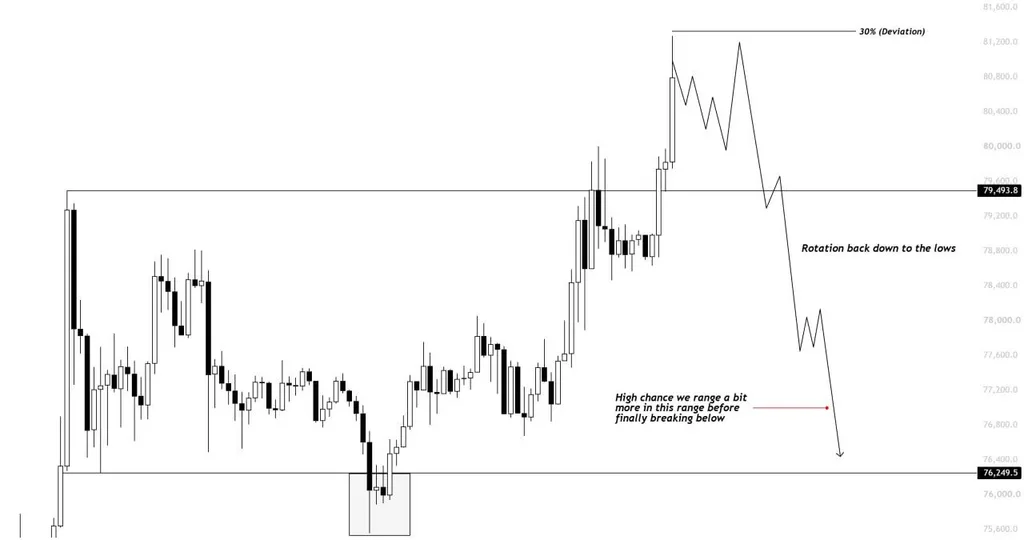
Bitcoin $BTC 76.2K-81.4K Range Setup. Source: Kaz on X
Bitcoin pushed above the range resistance marked near $79,494 and briefly traded above $80,000, but Kaz expects the advance to remain capped below the $81,400 deviation level. In this setup, a rejection from that upper area would suggest the breakout lacks enough follow-through to establish a new short-term trend.
The chart projects some additional consolidation first. $BTC could continue chopping around the upper part of the range before losing momentum and moving back below the $79,494 breakout level. That would shift attention toward the lower boundary near $76,250, which has previously acted as an important support area.
A return toward $76,250 would not necessarily produce an immediate breakdown. Kaz’s projected path allows for further sideways trading near the range lows and a possible reaction from the first major reversal pivot before sellers regain control.
The bearish scenario strengthens if Bitcoin loses the $76,250 floor decisively. Kaz then sees scope for a deeper decline toward the $70,000-$72,000 major support zone, making the current range low an important confirmation level rather than simply another intraday support.
The invalidation point sits on the opposite side of the structure. A sustained break above approximately $81,400 would weaken the deviation thesis and indicate that Bitcoin is accepting prices above the previous range rather than rotating back into it.
For now, the chart favors consolidation followed by a range-low retest. The clearest signals would come from either sustained acceptance above $81,400 or a confirmed loss of $76,250, with the latter opening the door to Kaz’s deeper $70,000-$72,000 downside target.