Bitcoin ($BTC) Rainbow Chart has predicted that the asset is likely to trade around $87,000 by September 30, 2026, according to the model’s central fair-value band.
With $BTC trading at $78,000 as of press time, the projection implies a potential 11% upside over the next four weeks if the cryptocurrency returns to its long-term trend line.
Notably, the Bitcoin Rainbow Chart, is a long-term logarithmic regression model that maps Bitcoin’s historical growth trajectory.
While the model does not predict short-term price action, it provides a framework for assessing whether $BTC is trading below, near, or above its long-term valuation trend.
Bitcoin price prediction
At the moment, chart places Bitcoin’s central ‘HODL’ band at approximately $87,000 on September 30, 2026. Historically, this zone has represented fair value, where neither strong accumulation nor excessive speculation has dominated market behavior.
At its current price, Bitcoin sits between the ‘Still cheap’ and ‘HODL’ bands, indicating the asset remains below its modeled fair value.
For September 30, the chart’s lowest band, ‘Basically a Fire Sale,’ begins at roughly $26,800. This zone has historically coincided with periods of extreme pessimism and deep undervaluation.
The ‘BUY’ band starts near $36,000, followed by the ‘Accumulate’ zone at around $48,300, both of which have historically aligned with long-term accumulation periods.
The ‘Still cheap’ band begins near $64,800 and suggests Bitcoin remains below its long-term trend despite recovering from lower levels.
The central ‘HODL’ band sits at approximately $87,000 and represents the model’s fair-value estimate.
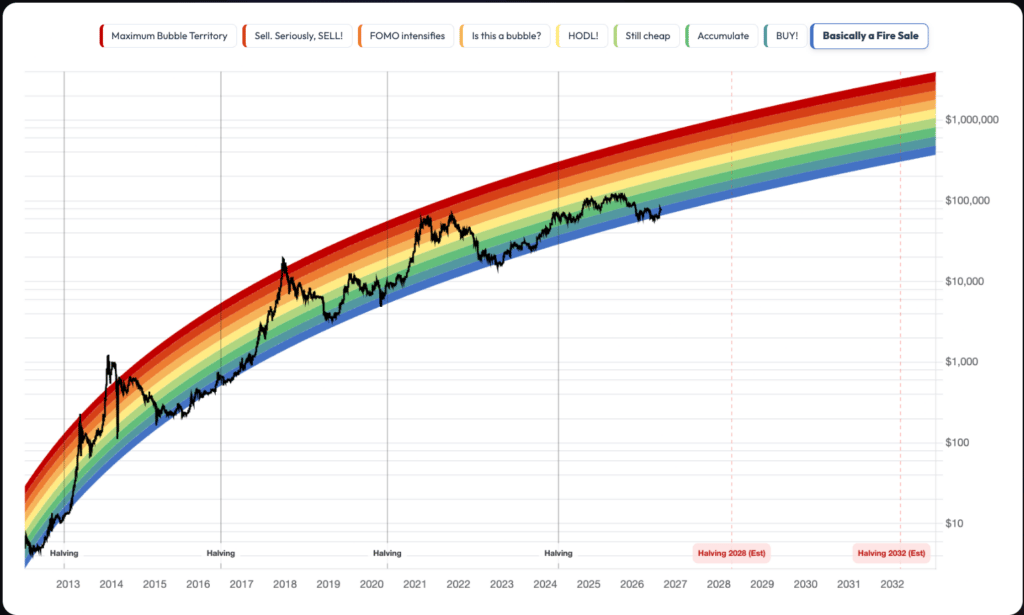
Above fair value, the ‘Is this a bubble?’ zone starts around $117,000, signaling prices may be becoming stretched relative to historical trends.
The ‘FOMO intensifies’ band begins near $157,000 and is associated with heightened speculative activity. The ‘Sell. Seriously, SELL!’ zone opens around $211,000 and has historically aligned with periods of profit-taking.
The highest band, ‘Maximum Bubble Territory,’ begins near $283,000 and represents the model’s most extreme overvaluation range.
While the model suggests $BTC remains below its long-term trend line, it is not designed to predict near-term market direction. Instead, it serves as a valuation framework for assessing Bitcoin’s position within historical market cycles.
Bitcoin price analysis
By press time, Bitcoin was trading at $78,001, down 0.7% over the past 24 hours and 1.6% over the week.
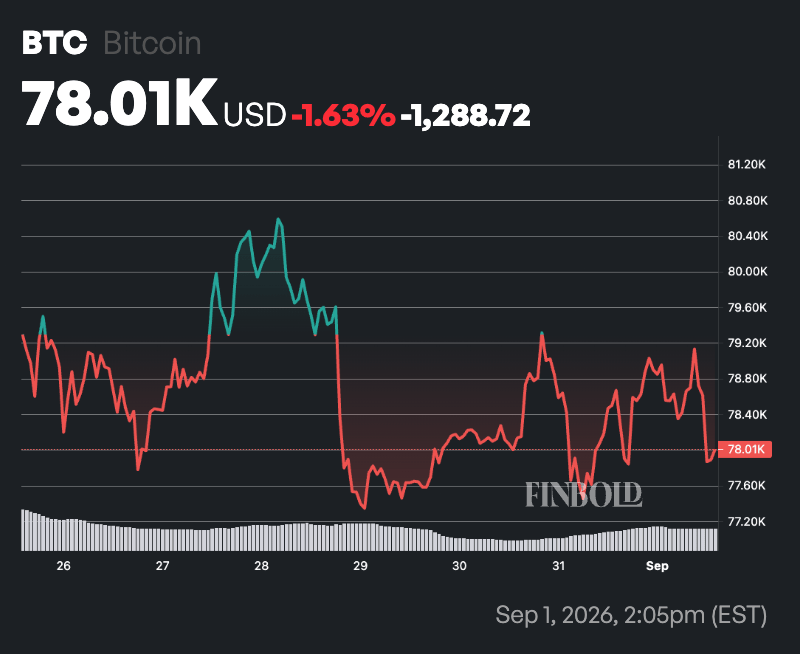
Despite the recent pullback, Bitcoin remains in a strong uptrend, trading well above its 50-day SMA of $67,601 and 200-day SMA of $69,454. The 50-day SMA also remains above the 200-day SMA, reinforcing the bullish market structure.
However, momentum appears stretched, with the 14-day RSI at 70.44, placing Bitcoin in overbought territory. While this does not necessarily signal an imminent reversal, it suggests the recent rally may be vulnerable to short-term consolidation or profit-taking.
Featured image via Shutterstock