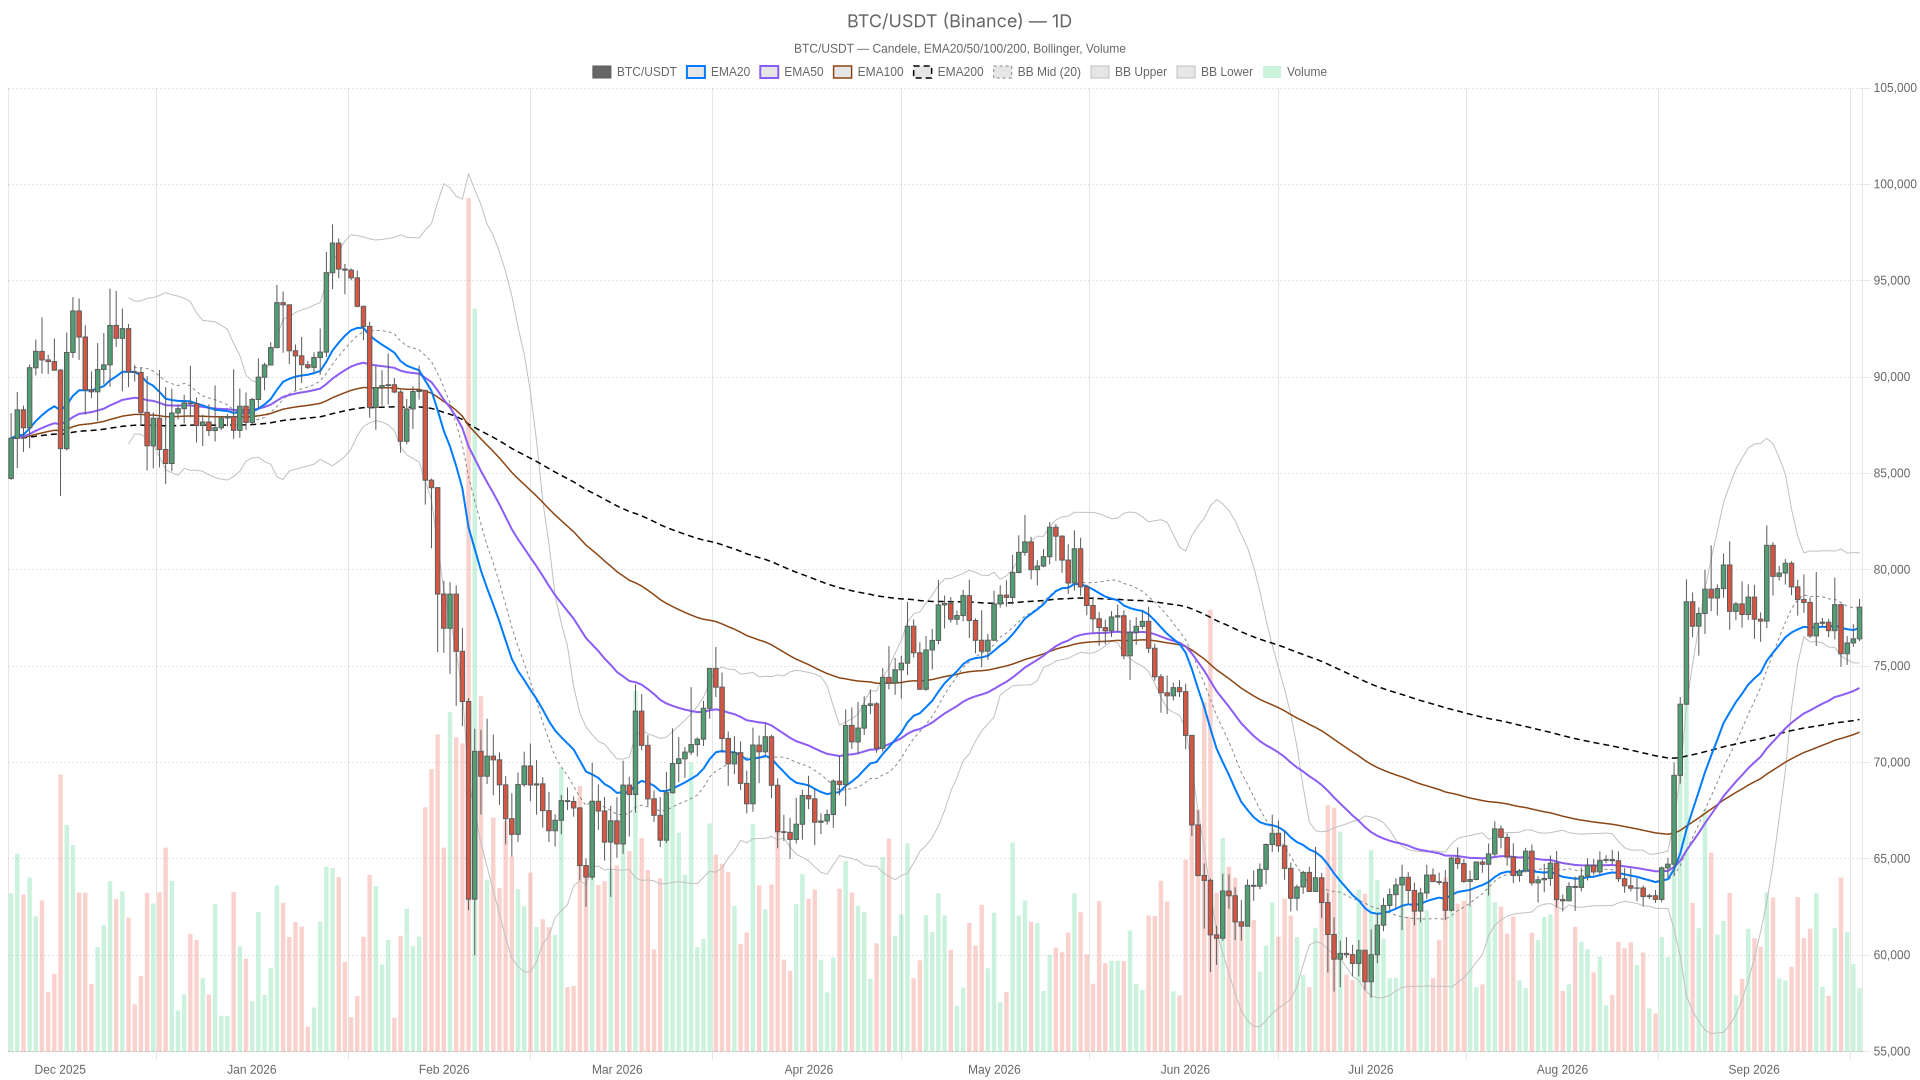
As of September 18, 2026, Bitcoin trades at $78,061, pinned below a resistance cluster that has defined recent sessions. However, the tension between the daily uptrend and hourly exhaustion signals captures where $BTC value stands right now — a market pausing at a decision point rather than chasing aggressively.
Key takeaways
- $BTC trades at $78,061, sitting below a resistance zone spanning $78,170 to $78,380 on the hourly chart.
- The daily trend remains bullish with price above the EMA20, EMA50, and EMA200, though the MACD histogram has turned negative at -586.63.
- Hourly RSI14 has reached 73.29, signaling overbought conditions that complicate immediate upside follow-through.
- Bitcoin dominance holds at 58.12% of a $2.68 trillion total crypto market, with the Fear & Greed Index at 56 in moderate Greed territory.
Daily Structure: Bullish Trend Intact, But Momentum Is Cooling
The daily trend remains bullish — $BTC value sits above all major moving averages — but momentum is visibly cooling beneath the surface. Price holds above the EMA20 at $76,984, EMA50 at $73,874, and EMA200 at $72,233, a configuration that confirms buyers have controlled the tape on longer timeframes for weeks. RSI14 at 56.47 backs the constructive picture without nearing overbought levels, leaving room to move in either direction.
Where caution emerges is the MACD: the line at 886.79 against a signal of 1,473.42 produces a negative histogram of -586.63. That is a classic divergence — price trending higher while momentum steadily fades. It does not invalidate the uptrend, but it signals that conviction behind the move has been eroding. The Bollinger Bands add useful context: the mid-band sits at $78,022.74, the upper band at $80,880.42, and the lower at $75,165.05. Price is riding the midline, neither stretched toward the top band nor retreating to support — a market in equilibrium, waiting for a catalyst.
Meanwhile, daily ATR14 at 1,886.26 confirms that volatility remains elevated, meaning a decisive break, when it arrives, will likely travel fast. Pivot levels show the pivot point at $77,616.14, with resistance at $78,936.27 (R1) and support at $76,741.48 (S1). With price above the pivot but still short of R1, the daily setup reads as neutral-to-constructive — the trend is alive, but the next test is approaching.
Hourly View: Overbought Reading Complicates the Picture
The hourly chart shows an overbought RSI at 73.29, which complicates immediate upside despite the trend structure remaining intact. Price holds above its EMA20 at $77,182, EMA50 at $76,803, and sits essentially at its EMA200 near $77,233 — a bullish-leaning stack. However, RSI14 has pushed squarely into overbought territory, while the MACD histogram registers a modest positive 135.94 (line 409.57 versus signal 273.63). That indicates a market that has used its short-term fuel aggressively, which is why this timeframe carries a neutral rather than outright bullish tag.
Bollinger Bands on the hourly reinforce this read — the mid-band at $77,009.70, upper at $78,169.69, and lower at $75,849.71 — with price pressing just below the upper band. Combined with pivot data (pivot at $78,171.33, R1 at $78,381.08, S1 at $77,851.86), Bitcoin is pinned beneath a resistance shelf from roughly $78,170 to $78,380. Hourly ATR14 at $333.71 serves as a reminder that intraday swings, while smaller than the daily range, remain active enough to matter for execution.
15-Minute View: Tight Coil Before the Next Move
The 15-minute chart reveals a market coiled at a decision point, with pivot levels compressed within roughly eight dollars of each other. The EMA stack — EMA20 at $77,817, EMA50 at $77,388, EMA200 at $76,755 — stays bullish, while RSI14 at 65.65 reflects steady but unremarkable buying pressure. The MACD is barely positive, with the line at 265.5 versus signal at 261.96 and a histogram of just 3.54, which reads as momentum that has flattened rather than reversed. What stands out most is the pivot cluster compressed within roughly $8: pivot at $78,059.08, R1 at $78,064.15, and S1 at $78,056.53. This unusually tight band signals indecision right at a critical level. The 15-minute chart provides execution context only — it does not tell the macro story, but it confirms the immediate tape is unresolved exactly where it matters most.
Bullish and Bearish Scenarios
The bullish case depends on holding above $76,741–$76,984 support, while the bearish scenario relies on rejection from the $78,170–$78,380 resistance zone combined with fading daily momentum. The bullish argument leans on the daily trend structure: as long as price holds above the EMA20 near $76,984 and S1 at $76,741, dips remain buyable within the broader uptrend. A clean break through the $78,170–$78,380 hourly resistance zone, followed by a push past daily R1 at $78,936 and eventually the upper Bollinger Band near $80,880, would confirm momentum is resuming rather than fading. That outcome would also align with the fiscal-stress bull case VanEck has outlined for Bitcoin’s medium-term trajectory. What would invalidate this: a failure to clear the hourly pivot zone combined with the daily MACD histogram deepening further into negative territory — that combination would suggest the rally is exhausting rather than pausing.
The bearish case rests on the daily MACD divergence and the hourly overbought RSI acting in concert. If price gets rejected from the $78,170–$78,380 resistance shelf and RSI on the hourly chart rolls over from 73, a retreat toward the daily EMA20 at $76,984 or S1 at $76,741 becomes the first realistic target. The EMA50 near $73,874 would serve as deeper support if selling pressure intensifies. What would invalidate this scenario: daily RSI14 holding above 50 and price reclaiming the hourly pivot at $78,171 quickly — that would show buyers stepping back in before any real damage is done to the trend.
Positioning and Risk
The current setup favors respecting the daily trend while acknowledging that hourly exhaustion makes chasing strength into resistance a high-risk proposition. Broader market data adds useful context: Bitcoin dominance stands at 58.12% of a total crypto market cap of roughly $2.68 trillion, according to CoinGecko-sourced figures, with total market cap down 0.45% over 24 hours. Capital is not rotating aggressively into altcoins, a pattern that typically emerges when conviction in $BTC itself remains intact but risk appetite elsewhere stays cautious. The Fear & Greed Index reads 56, in Greed territory but far from extreme — consistent with a market that is constructive without being euphoric.
This is a setup where the daily trend still deserves the benefit of the doubt, but the hourly exhaustion signals mean chasing strength directly into resistance carries real risk. Volatility readings across timeframes — ATR14 of 1,886 on the daily and 333 on the hourly — suggest whichever direction resolves first could move quickly. Position sizing and knowing where you would be wrong matter more here than guessing the exact breakout level. The next few sessions around the $78,000–$78,900 zone should clarify whether this is a pause inside an uptrend or the first sign of a deeper pullback.
FAQ
Where is the key resistance for $BTC right now?
The main resistance zone lies between $78,170 and $78,380 on the hourly chart, with daily R1 at $78,936 and the upper daily Bollinger Band near $80,880 serving as additional hurdles above that.
Is the daily trend still bullish despite the MACD divergence?
Yes. Price remains above the EMA20, EMA50, and EMA200 in a textbook bullish stack, and daily RSI14 at 56.47 is comfortably above 50. The negative MACD histogram signals slowing momentum, not a trend reversal — it is a caution flag rather than an invalidation of the broader uptrend.
What support levels should traders watch on a pullback?
The first support cluster sits at the daily EMA20 near $76,984 and S1 at $76,741. Below that, the EMA50 near $73,874 represents the next meaningful level where buyers would likely step in if selling pressure builds.
Disclaimer: This article is for informational purposes only and does not constitute financial advice, an investment recommendation, or a solicitation to buy or sell any financial instrument or cryptocurrency. The analysis provided is not indicative of future results. Investing in crypto assets and financial markets carries a high risk of capital loss. Always do your own research (DYOR) and consult a qualified financial advisor before making any decision.
Article produced with the assistance of artificial intelligence and reviewed by the editorial team.
Leave a Reply
You must be logged in to post a comment.