Bitcoin price is under renewed selling pressure after another failed attempt to push through the upper end of its recent range. $BTC has now slipped toward $82,600, with the latest decline coming as ETF demand reverses, oil prices surge and Treasury yields climb to multi-decade highs. On-chain data adds another layer: short-term profitability has cooled and exchange flows remain highly volatile, but the data does not yet show a broad capitulation. The result is a market caught between heavy short-term selling and longer-term buyers waiting for lower prices.
Bitcoin ETF Outflows Are Removing a Major Source of Demand
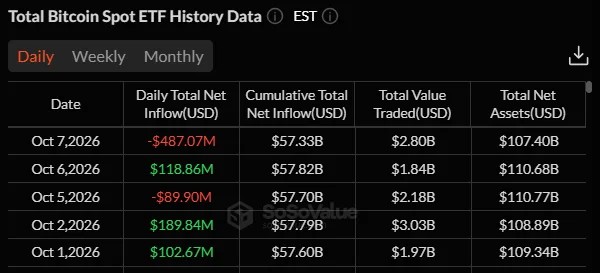
The sharp reversal in ETF flows is one of the clearest reasons behind Bitcoin’s latest weakness. U.S. spot Bitcoin ETFs recorded $487.9 million in net outflows on October 7, marking the largest daily withdrawal since June 25.

Know when your
coins moveAlerts, real-time prices, and market news — all in one app

4.8 based on 40K reviews in the App Store and Google Play


The move erased the $321.6 million in net inflows accumulated during October’s first four trading sessions, leaving the month with roughly $163 million in net outflows. The largest withdrawals included approximately $207.7 million from IBIT, $105.1 million from FBTC and $101.7 million from ARKB.
Bitcoin is therefore losing institutional buying pressure at the same time that its technical structure is weakening. If ETF withdrawals continue, $BTC could struggle to reclaim $85,900 even if selling momentum starts to slow.
Higher Oil Prices and Treasury Yields Are Hitting Risk Appetite
Macro conditions have turned into another major headwind for Bitcoin. Brent crude has moved above $104 per barrel, while the U.S. 10-year Treasury yield has climbed above 5.3%. Rising energy prices increase inflation concerns, while higher Treasury yields make traditional fixed-income assets more attractive relative to speculative assets.
Bitcoin’s Sell-Off Is Getting Amplified by Leverage
$BTC price decline has also triggered forced selling across the crypto derivatives market. More than $650 million in leveraged crypto positions have been liquidated during the latest market move, with long positions taking a significant portion of the damage.
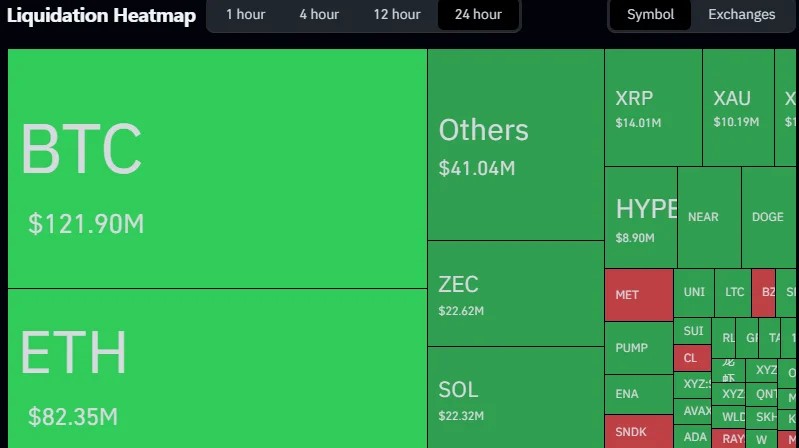
When $BTC breaks important support levels, leveraged traders can be forced to close positions automatically. Those liquidations add market selling on top of existing spot pressure and can push Bitcoin below levels that would otherwise have held. The break below $85,000 therefore carries more weight after the liquidation wave. A sustained recovery requires fresh spot buyers to absorb both existing supply and positions being unwound.
Bitcoin On-Chain Data Shows Short-Term Pressure Is Rising
Bitcoin’s 7-day MVRV has fallen sharply from its earlier positive spikes, showing that short-term holder profitability has weakened as $BTC moved lower. Traders who bought during the recent recovery are now sitting on significantly smaller unrealized gains.
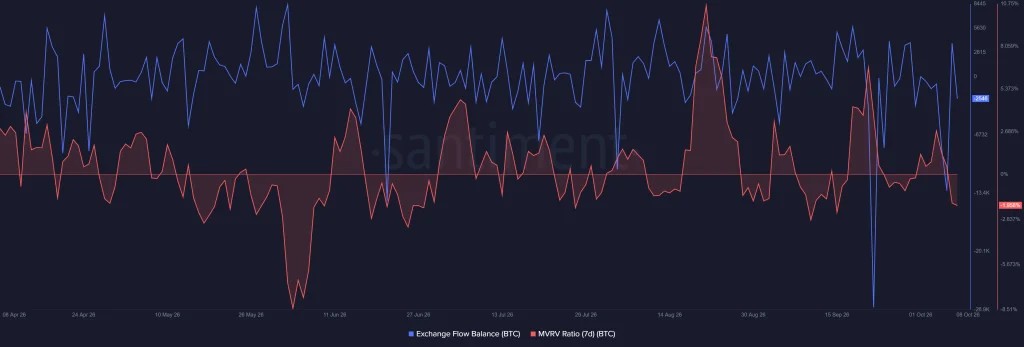
At the same time, Exchange Flow Balance remains highly volatile, with repeated swings between inflows and outflows. The latest readings do not show a persistent surge of $BTC moving onto exchanges, which would normally provide a stronger signal of widespread selling. The data therefore points to short-term pressure rather than full capitulation. Further deterioration in MVRV combined with sustained exchange inflows would make the sell-off more dangerous.
Bitcoin Price Analysis: $85,900 Decides the Next Move
Bitcoin is currently trading around $82,600, below the $85,900 support level. The first recovery target is $85,900. A successful reclaim would bring $88,000–$90,000 back into focus. Bitcoin would need to break that zone before the larger $98,000–$100,000 supply area becomes a realistic upside target.
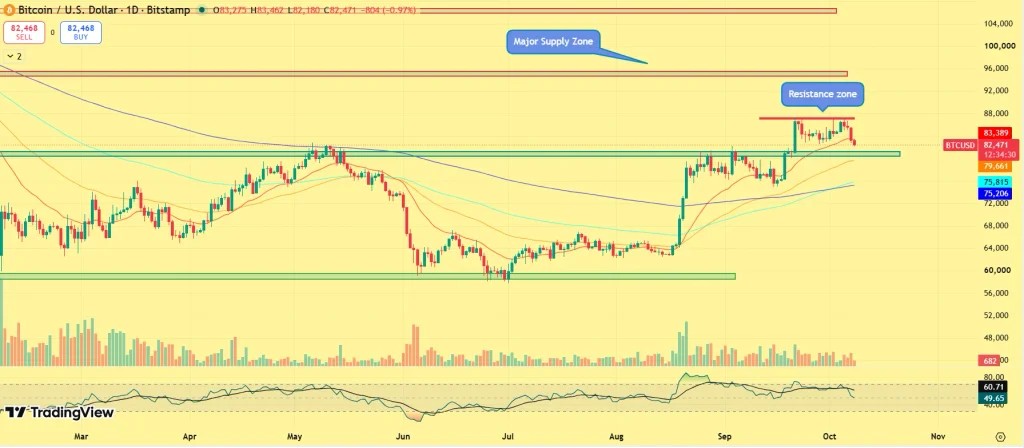
If $BTC remains below $85,900, sellers retain control of the short-term structure. A continued breakdown could push Bitcoin toward the $75,800–$75,200 moving-average region. The broader downside support sits around $60,000–$62,000, although that zone would require a much deeper correction to come into play.
Why Could $BTC Price Keep Falling?
Bitcoin is falling because institutional demand has reversed, macro conditions have tightened, leverage is being flushed out and short-term holder profitability is deteriorating. The sell-off has not yet produced a broad capitulation signal. Whale accumulation and unstable exchange flows show that buyers remain active beneath the surface.
The immediate test is $85,900. Reclaiming that level would weaken the current bearish structure, while continued rejection below it would leave $BTC exposed to the $75K–$76K region.
Leave a Reply
You must be logged in to post a comment.