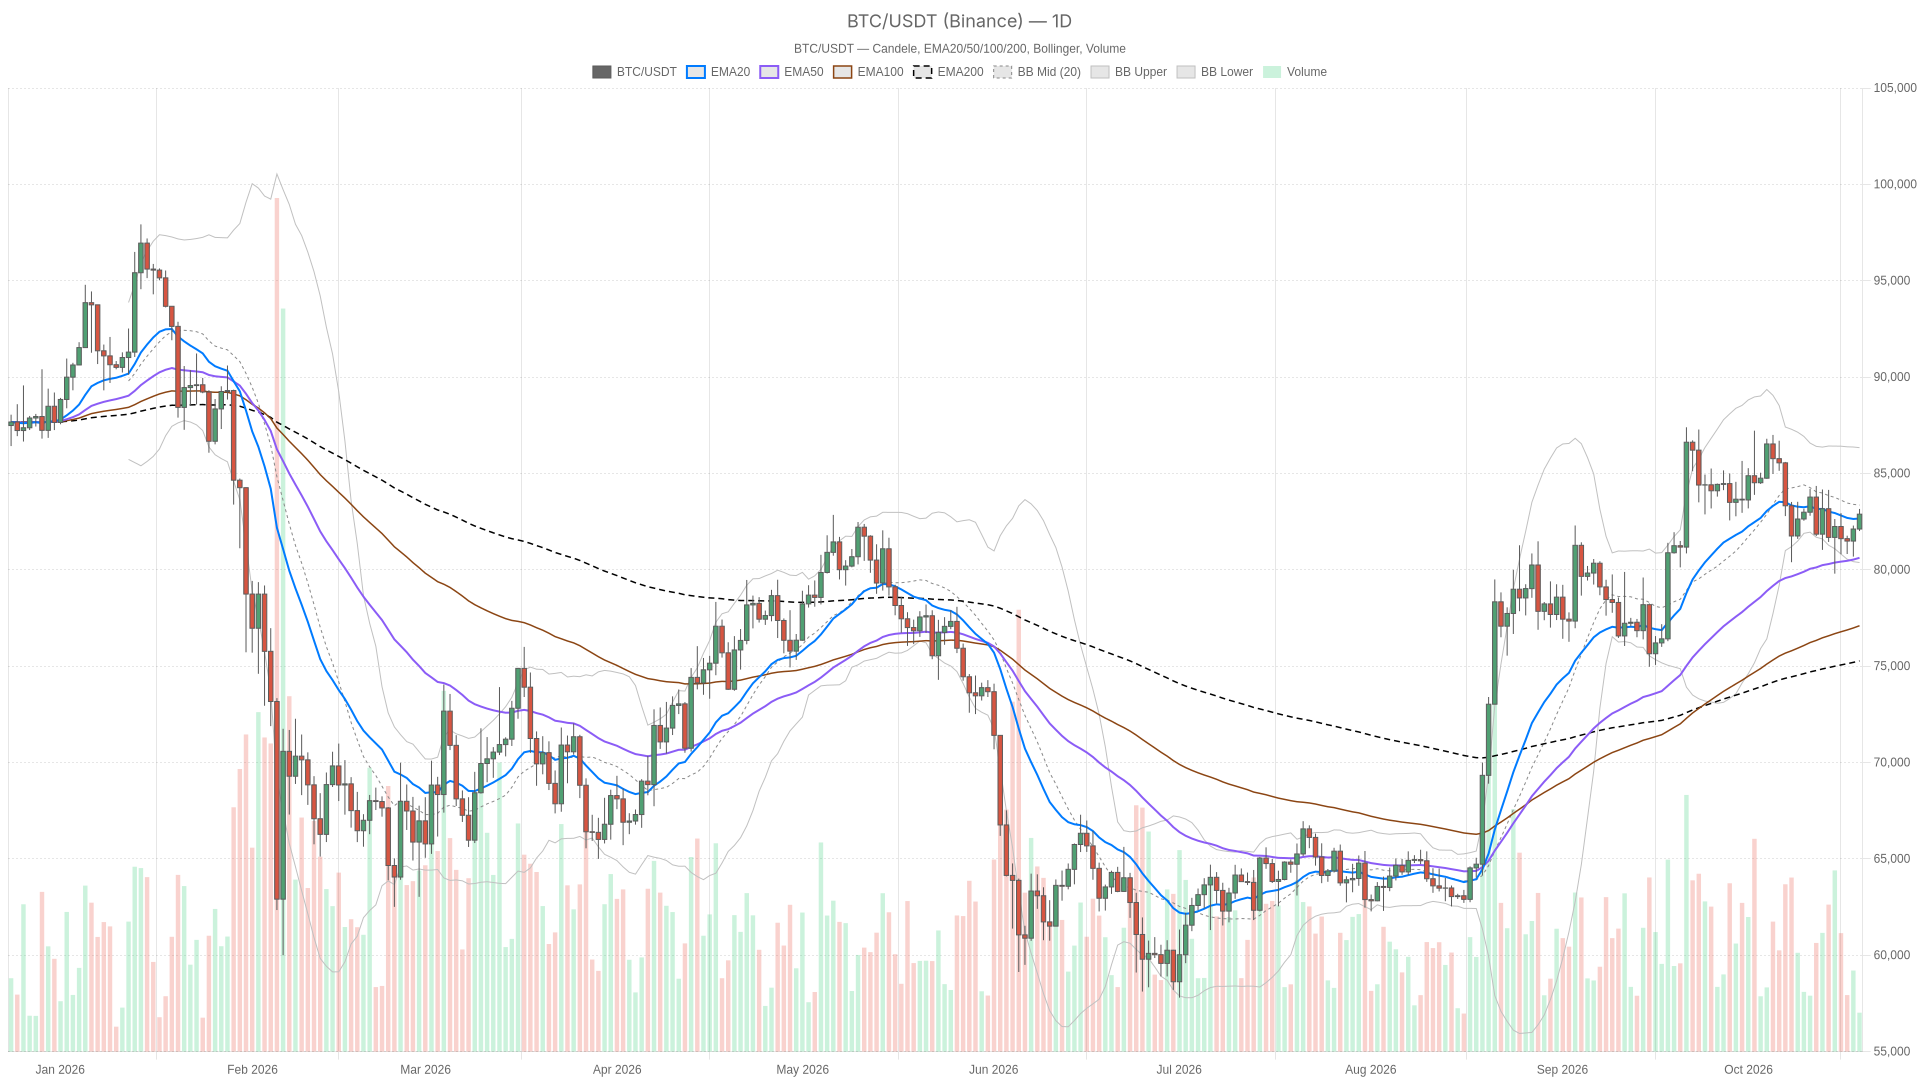
As of October 19, 2026, the Bitcoin price trades at $82,886.00 on Binance, holding above all three daily EMAs. The main scenario is cautiously bullish: the daily trend structure remains intact, while the negative daily MACD histogram signals a recovery rather than an unrestricted advance.
Key takeaways
- Bitcoin trades at $82,886.00, holding above the daily EMA20, EMA50 and EMA200
- An hourly close above $82,951.49 (hourly R1) is required to confirm the bullish breakout
- Daily MACD histogram remains negative, but its narrowing histogram indicates easing selling pressure
- Bitcoin dominance stands at 60.18% with total crypto market capitalization near $2.77 trillion
- A whale moved $34 million in $BTC originally acquired in 2013 at $131 per coin

Know when your
coins moveAlerts, real-time prices, and market news — all in one app

Point your phone camera to install

4.8 based on 40K reviews in the App Store and Google Play


The immediate contest is between hourly buying momentum and nearby resistance. Price is already above the daily R1, so treating that level as an unbroken ceiling would miss the setup. The next question is whether the hourly advance can extend while the daily momentum deficit continues to narrow.
Bitcoin dominance and a whale transfer frame the backdrop
CoinGecko puts total crypto market capitalization at approximately $2.77 trillion and Bitcoin dominance at 60.18%. Those levels establish Bitcoin’s weight in the broader market, but they do not establish a change in capital allocation. Fear & Greed Index is not univocal here: one reading shows 59, classified as Greed, while another shows 44, classified as Fear. Sentiment therefore cannot validate a breakout on its own.
A Bitcoin whale moved $34 million in $BTC acquired in 2013, when the coins traded at $131. The transfer adds a potential supply question to the technical picture, but a movement of coins is not evidence of a sale and does not establish what drove the current price.
Bitcoin price structure is bullish daily, but hourly averages remain mixed
Binance candle data place price above the daily EMA20 at $82,637.55, EMA50 at $80,530.60 and EMA200 at $75,196.98. Those averages are aligned bullishly, giving the daily setup its positive bias. The distinction is that the live daily price is not a completed close: the last completed daily candle closed at $82,116.00. The current strength therefore still needs to survive the unfinished session.
On the hourly chart, price also sits above all three EMAs, but their ordering is mixed rather than bullishly aligned. The hourly EMA200 at $82,324.42 remains above the hourly EMA20 at $82,082.07 and EMA50 at $81,851.72. That supports an improving price position without yet establishing a fully aligned hourly trend.
The 15-minute chart has bullishly ordered averages, with price above its EMA20, EMA50 and EMA200. That offers supportive execution context, not a reason to override the daily chart. The shortest timeframe looks cleaner than the hourly structure beneath it.
Positive hourly momentum meets an unfinished daily recovery
Daily RSI is 48.9 and rising, while the negative daily MACD histogram is narrowing. Selling momentum is easing, but the daily reading has not become positive. This is the central tension: trend structure favors the bulls, while momentum is still repairing.
Hourly RSI stands at 68.6 and the MACD histogram is positive. Both trend fields are flat, so the evidence supports firm momentum, not a claim that it is accelerating. On the 15-minute chart, RSI is rising at 68.0, while the negative MACD histogram is narrowing. Short-term strength and a residual momentum deficit coexist.
The daily Bollinger midpoint at $83,396.43 is overhead resistance, with the daily upper band at $86,370.85 farther away and the daily lower band at $80,422.01 below price. Remaining under the midpoint leaves room for a mean-reversion reading of the advance rather than confirming a move toward the upper band. The nearer hourly upper band at $83,197.03 provides an earlier test of that ambition.
Daily ATR is $2,117.78, compared with hourly ATR of $327.21 and 15-minute ATR of $151.04. These ranges matter because the immediate pivot levels are tightly spaced relative to current volatility. A brief crossing can be noise; a completed candle gives the scenarios a more meaningful test.
Hourly R1 controls the upside test; the hourly pivot defines failure
Bullish scenario: an hourly close above hourly R1 at $82,951.49 would confirm a break through the nearest resistance. The next reference is the hourly Bollinger upper at $83,197.03, followed by the daily Bollinger midpoint at $83,396.43. An hourly close back below the hourly pivot at $82,818.75 would invalidate that breakout setup. The last completed hourly close, $82,852.62, has not satisfied the bullish trigger.
Bearish scenario: an hourly close below the hourly pivot at $82,818.75 would undermine the immediate advance and expose hourly S1 at $82,719.87. The daily R1 at $82,712.86 is also below current price and therefore acts as support, not resistance; it is a separate level, not the same pivot. An hourly close above hourly R1 at $82,951.49 would invalidate this bearish setup.
A deeper retreat would put the daily EMA20 at $82,637.55 in focus, with the daily pivot at $81,698.61 farther below. That separates an intraday failure from damage to the broader bullish structure. The likeliest false signal in this setup is a brief push above hourly R1 that cannot hold through an hourly close: nearby resistance, firm short-term RSI and still-negative daily MACD histogram make an apparent breakout less decisive than it first looks.
FAQ
Why is the main bias bullish when the daily MACD histogram is negative?
The daily averages are bullishly aligned and price is above each of them. The negative MACD histogram qualifies that structural strength: its narrowing histogram supports a recovery reading, not fully confirmed bullish momentum.
What role does the 15-minute chart play?
It provides execution context. Its bullish EMA structure does not remove the mixed hourly alignment or settle the unfinished daily momentum recovery.
Disclaimer: This article is for informational purposes only and does not constitute financial advice, an investment recommendation, or a solicitation to buy or sell any financial instrument or cryptocurrency. The analysis provided is not indicative of future results. Investing in crypto assets and financial markets carries a high risk of capital loss. Always do your own research (DYOR) and consult a qualified financial advisor before making any decision.
Article produced with the assistance of artificial intelligence and reviewed by the editorial team.
Leave a Reply
You must be logged in to post a comment.