
Today, the price of Bitcoin is around $110,200, which is close to where it was before it fell below its multi-month rising trendline for the first time since April. From the $124,000 area, sellers pushed BTC lower, which caused a sharp rejection that broke the bullish channel. Spot inflows have also turned negative, with $44 million in net outflows recorded on August 26. This shows that investors are being careful after the recent rally.
What’s Happening With Bitcoin’s Price?
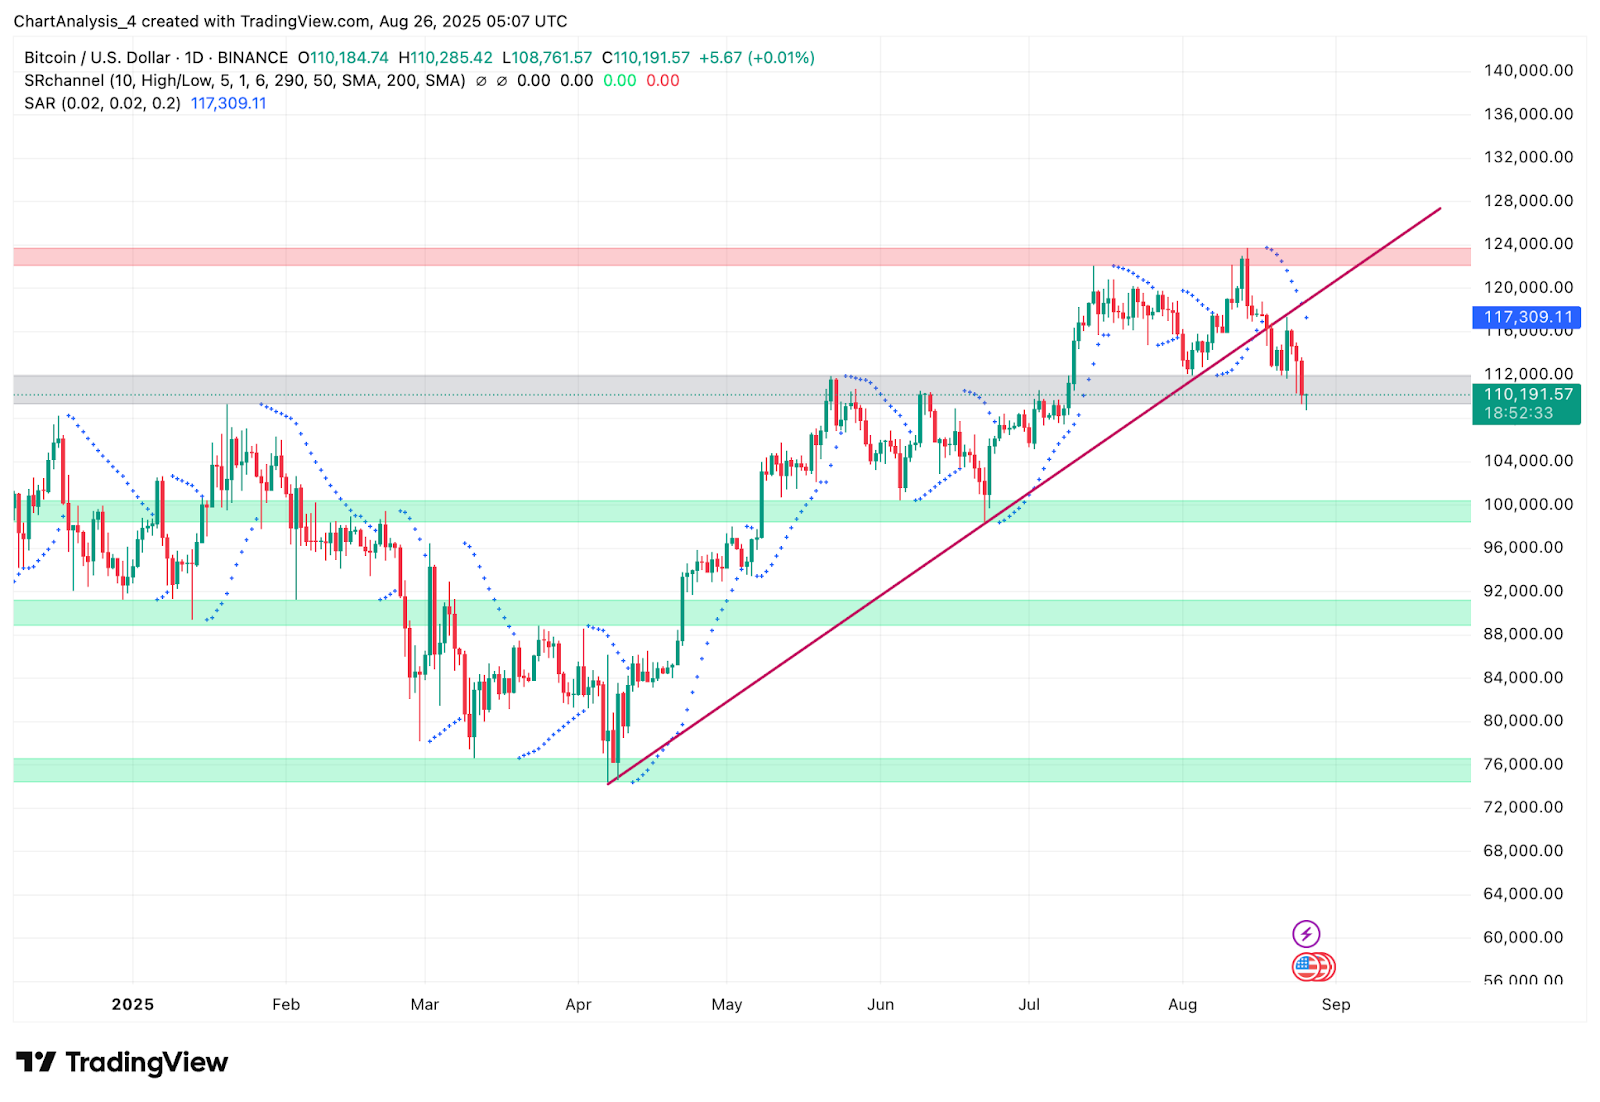
On the daily chart, BTC has slipped out of its rising structure, breaking below the $112,000–$113,000 support band. Price is now testing the $109,800–$110,500 region, which lines up with prior liquidity and demand zones. A sustained close below $110K would confirm a deeper retracement toward $108,000, while recovery above $112,000 would be needed to restore short-term momentum.
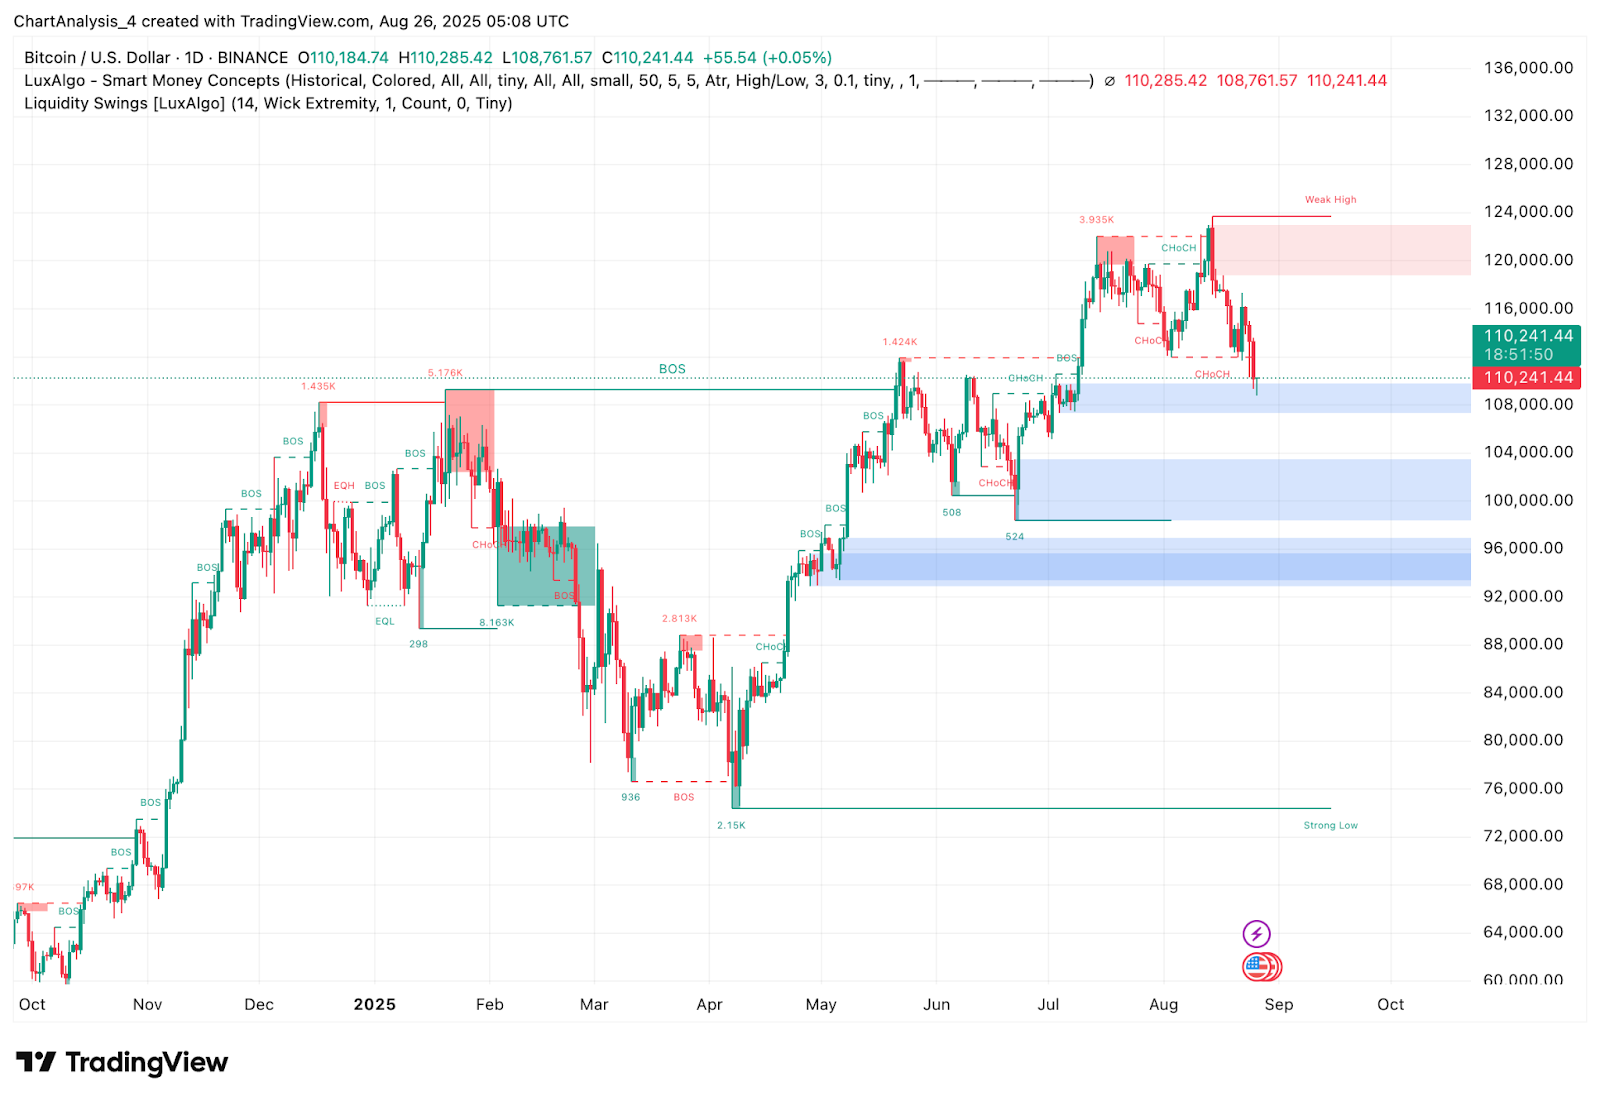
The Smart Money Concepts chart highlights a recent change of character (CHoCH) below $112,500, with price dipping into imbalance zones near $109,500. This indicates that sellers remain in control unless the weak high near $124,000 is challenged again.
Why Is The Bitcoin Price Going Down Today?
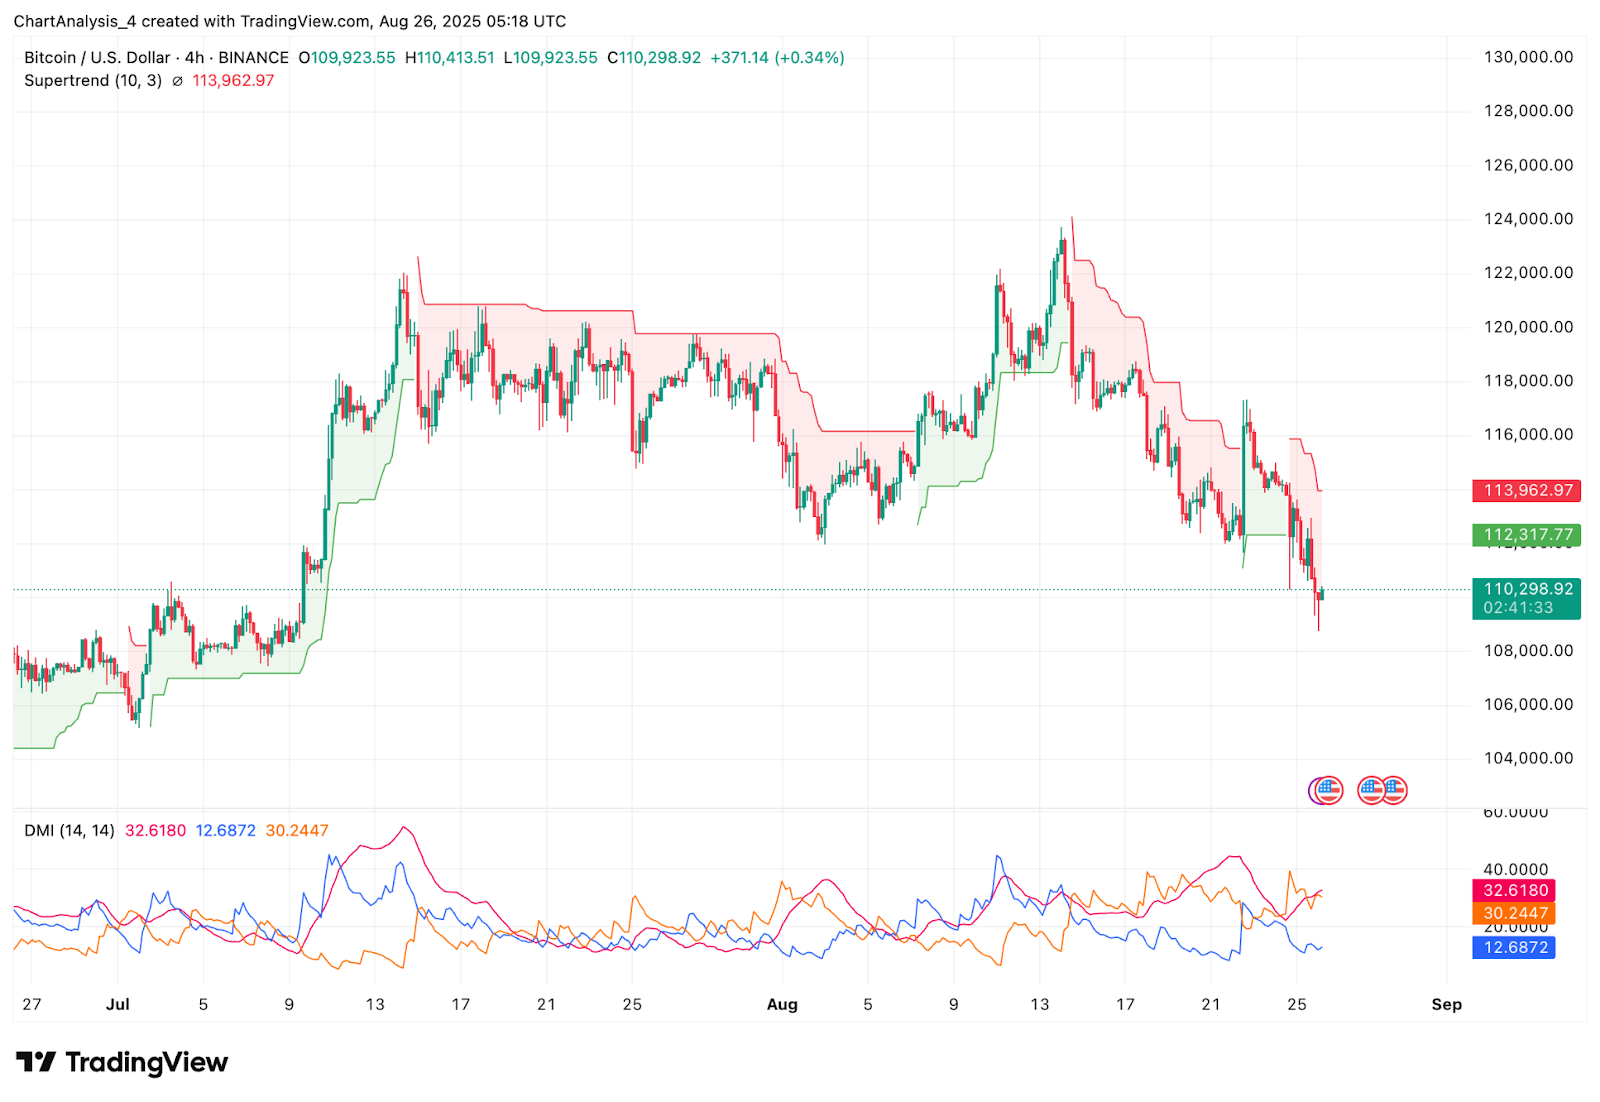
Why Bitcoin price is going down today stems from a combination of technical rejection and weakening momentum signals. The 4-hour Supertrend has flipped bearish, with resistance marked near $113,950. The DMI shows bearish alignment, with the -DI leading above +DI and ADX climbing, confirming trend strength on the downside.
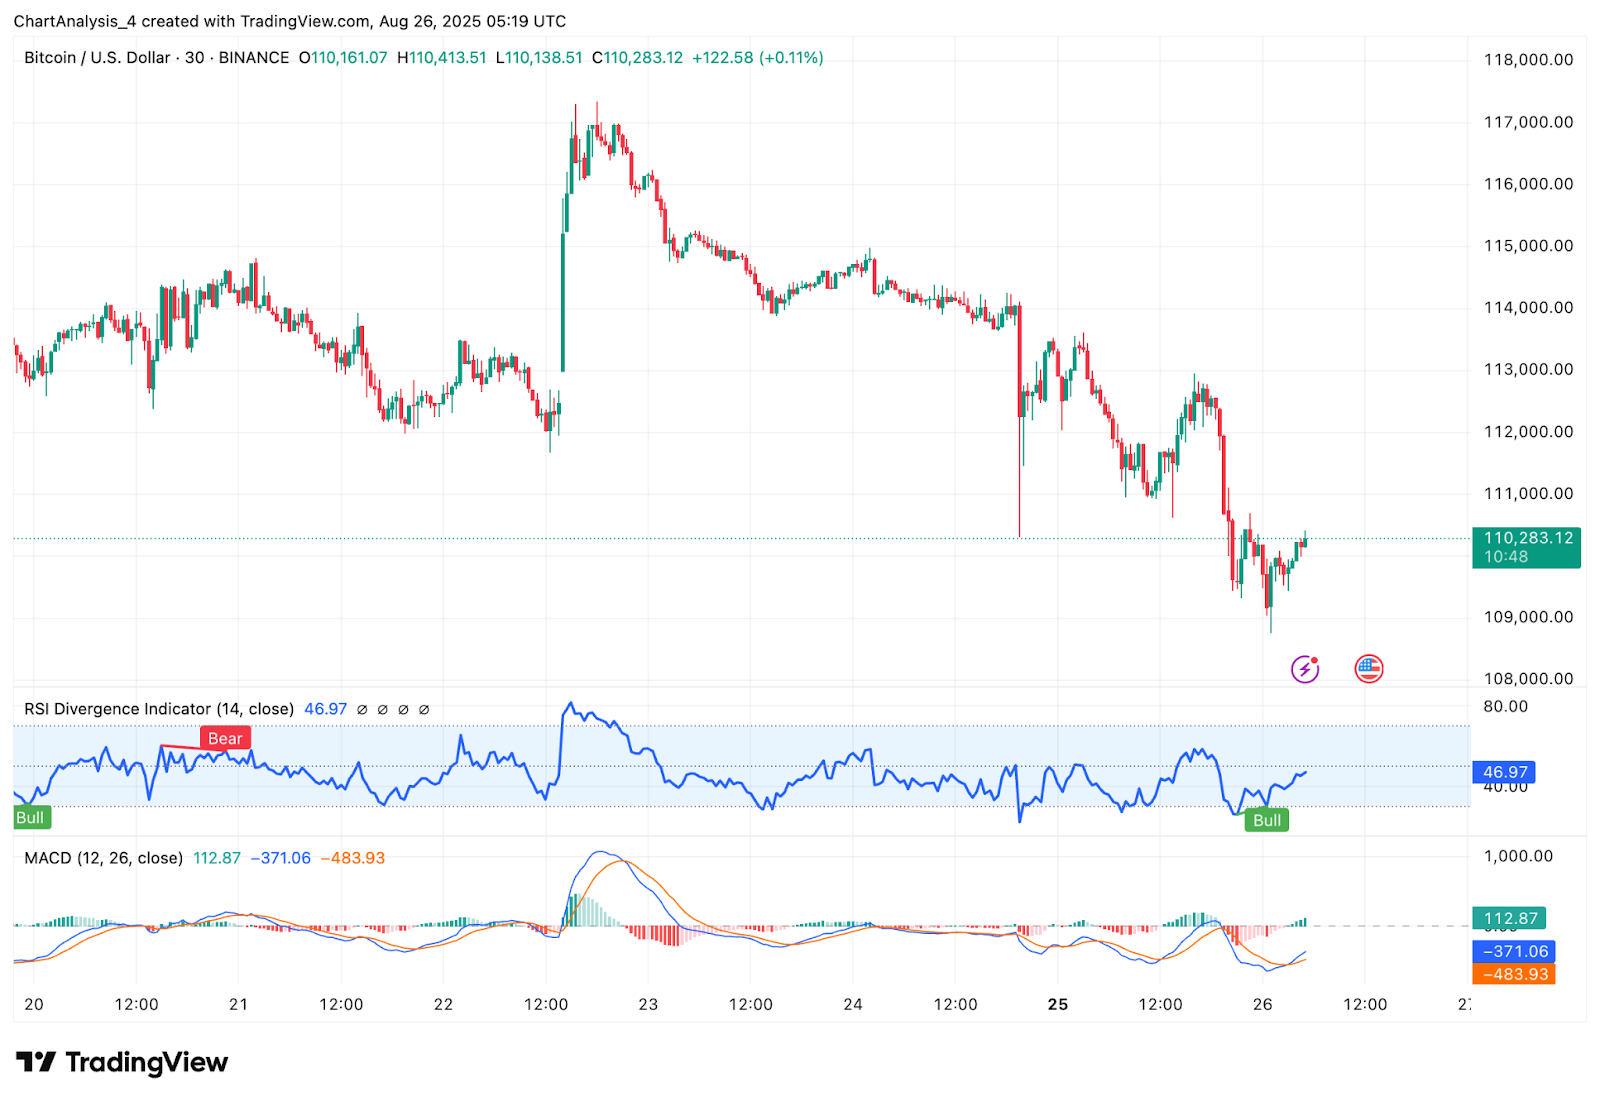
On lower timeframes, the RSI sits around 47, reflecting a neutral-to-bearish tone after failing to reclaim the 50 mark. The MACD histogram remains in negative territory, with momentum still tilted toward sellers. Bollinger Bands on the 4H chart show price hugging the lower band near $109,500, a sign of persistent selling pressure.
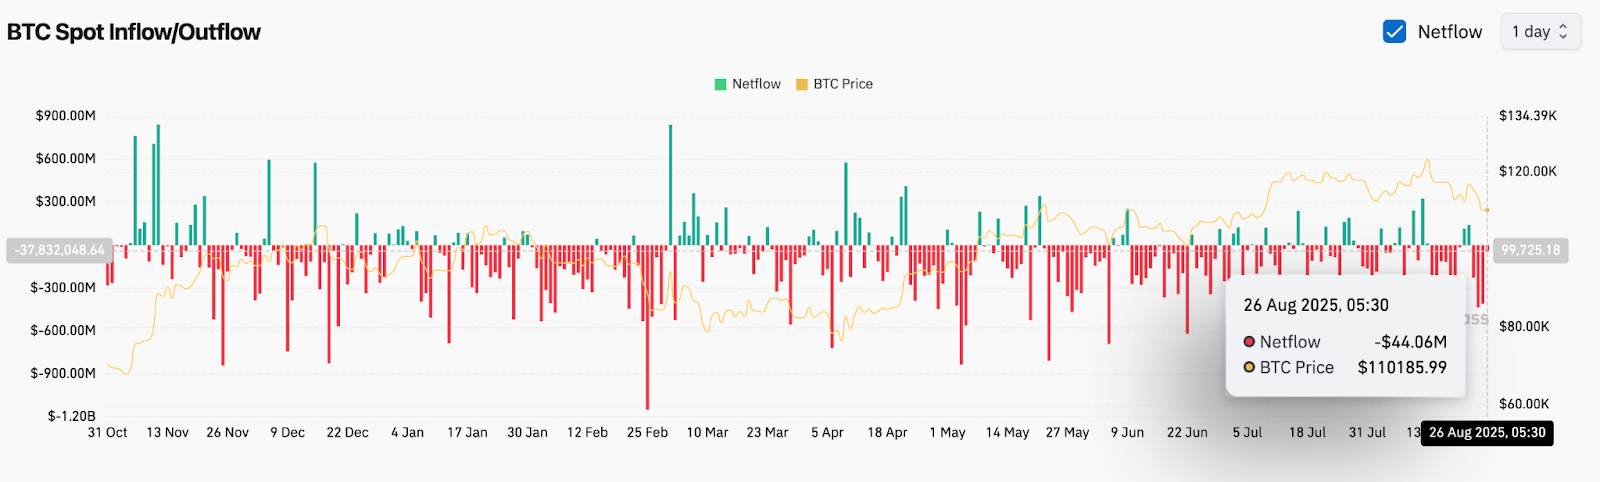
Meanwhile, the Coinglass spot inflow/outflow chart shows -$44.06M net outflow on August 26, suggesting that traders are pulling BTC off exchanges during this correction phase, possibly to hold or hedge in anticipation of volatility.
Bitcoin Price: Momentum Indicators Point To Weakness
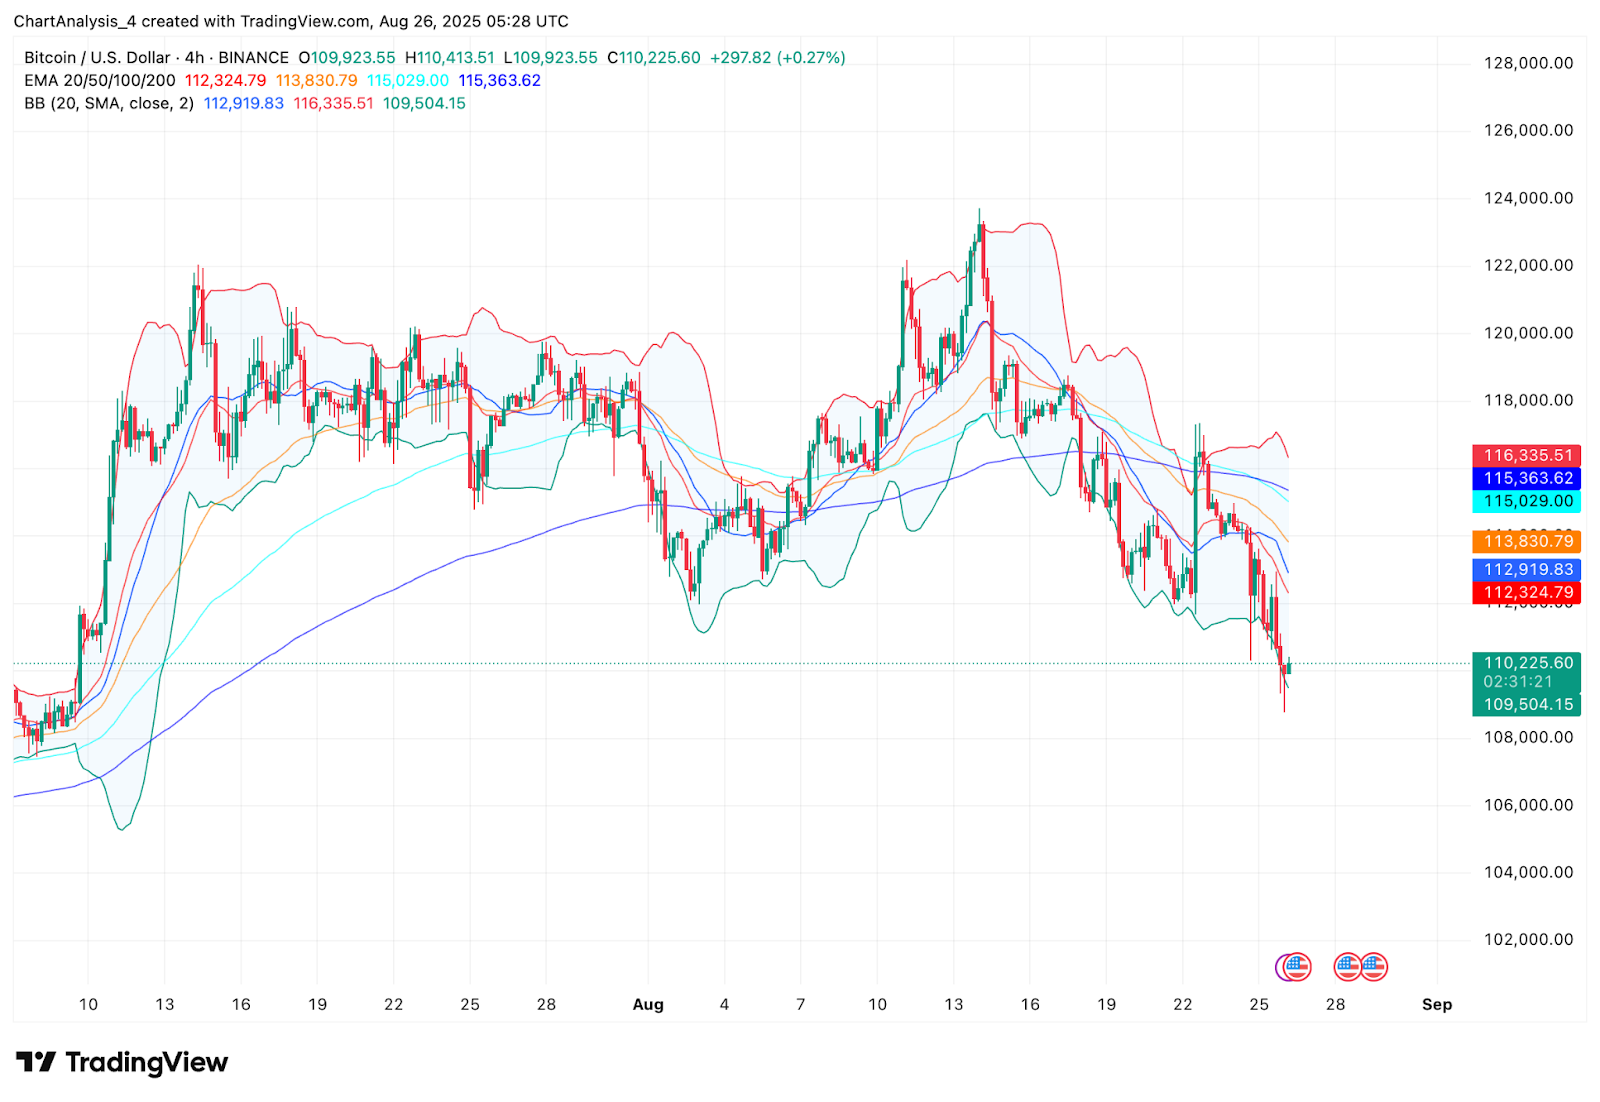
The EMA cluster (20/50/100/200 on the 4H) now acts as overhead resistance, stacked between $112,300 and $115,300. Until BTC can reclaim these levels, upside attempts are likely to be capped. The Bollinger Band squeeze is expanding lower, signaling a continuation of volatility on the downside.
Intraday charts (30-min) show RSI divergence forming around $109,600, where bulls have tried to defend with small reversals. However, MACD remains weak, and without volume recovery, bounces may remain short-lived.
BTC Price Prediction: Short-Term Outlook (24H)
The outlook for Bitcoin price on August 27 is still negative unless BTC swiftly regains $112,000 in value. Immediate support sits at $109,500, followed by the $108,000 demand block. A breakdown below $108K could expose $104,500 and eventually the $100K psychological level.
On the upside, a push back above $112,300 would put BTC in position to retest $115,000 and potentially re-enter the prior range. Traders should monitor the $109,500–$110,000 band closely, as this is the pivot zone deciding whether BTC stabilizes or extends its correction.
Bitcoin Price Forecast Table: August 27, 2025
| Indicator/Zone | Level / Signal |
| Bitcoin price today | $110,200 |
| Resistance 1 | $112,300 |
| Resistance 2 | $115,000 |
| Support 1 | $109,500 |
| Support 2 | $108,000 |
| EMA Cluster (4H) | Bearish stack $112,300–$115,300 |
| RSI (30-min) | 46.9 (Neutral-Bearish) |
| MACD (30-min) | Bearish, momentum weak |
| Bollinger Bands (4H) | Lower band near $109,500 |
| Supertrend (4H) | Bearish under $113,950 |
| Spot Netflow (Aug 26) | -$44.06M (outflow, mild caution) |
Disclaimer: The information presented in this article is for informational and educational purposes only. The article does not constitute financial advice or advice of any kind. Coin Edition is not responsible for any losses incurred as a result of the utilization of content, products, or services mentioned. Readers are advised to exercise caution before taking any action related to the company.