
Bitcoin’s price hovered at $110,919 to $111,100 on Aug. 29, reflecting a cautious market amid persistent bearish sentiment. With a market capitalization of $2.19 trillion and a 24-hour trading volume of $40.13 billion, bitcoin moved within a tight intraday range of $109,568 to $113,291.
Bitcoin
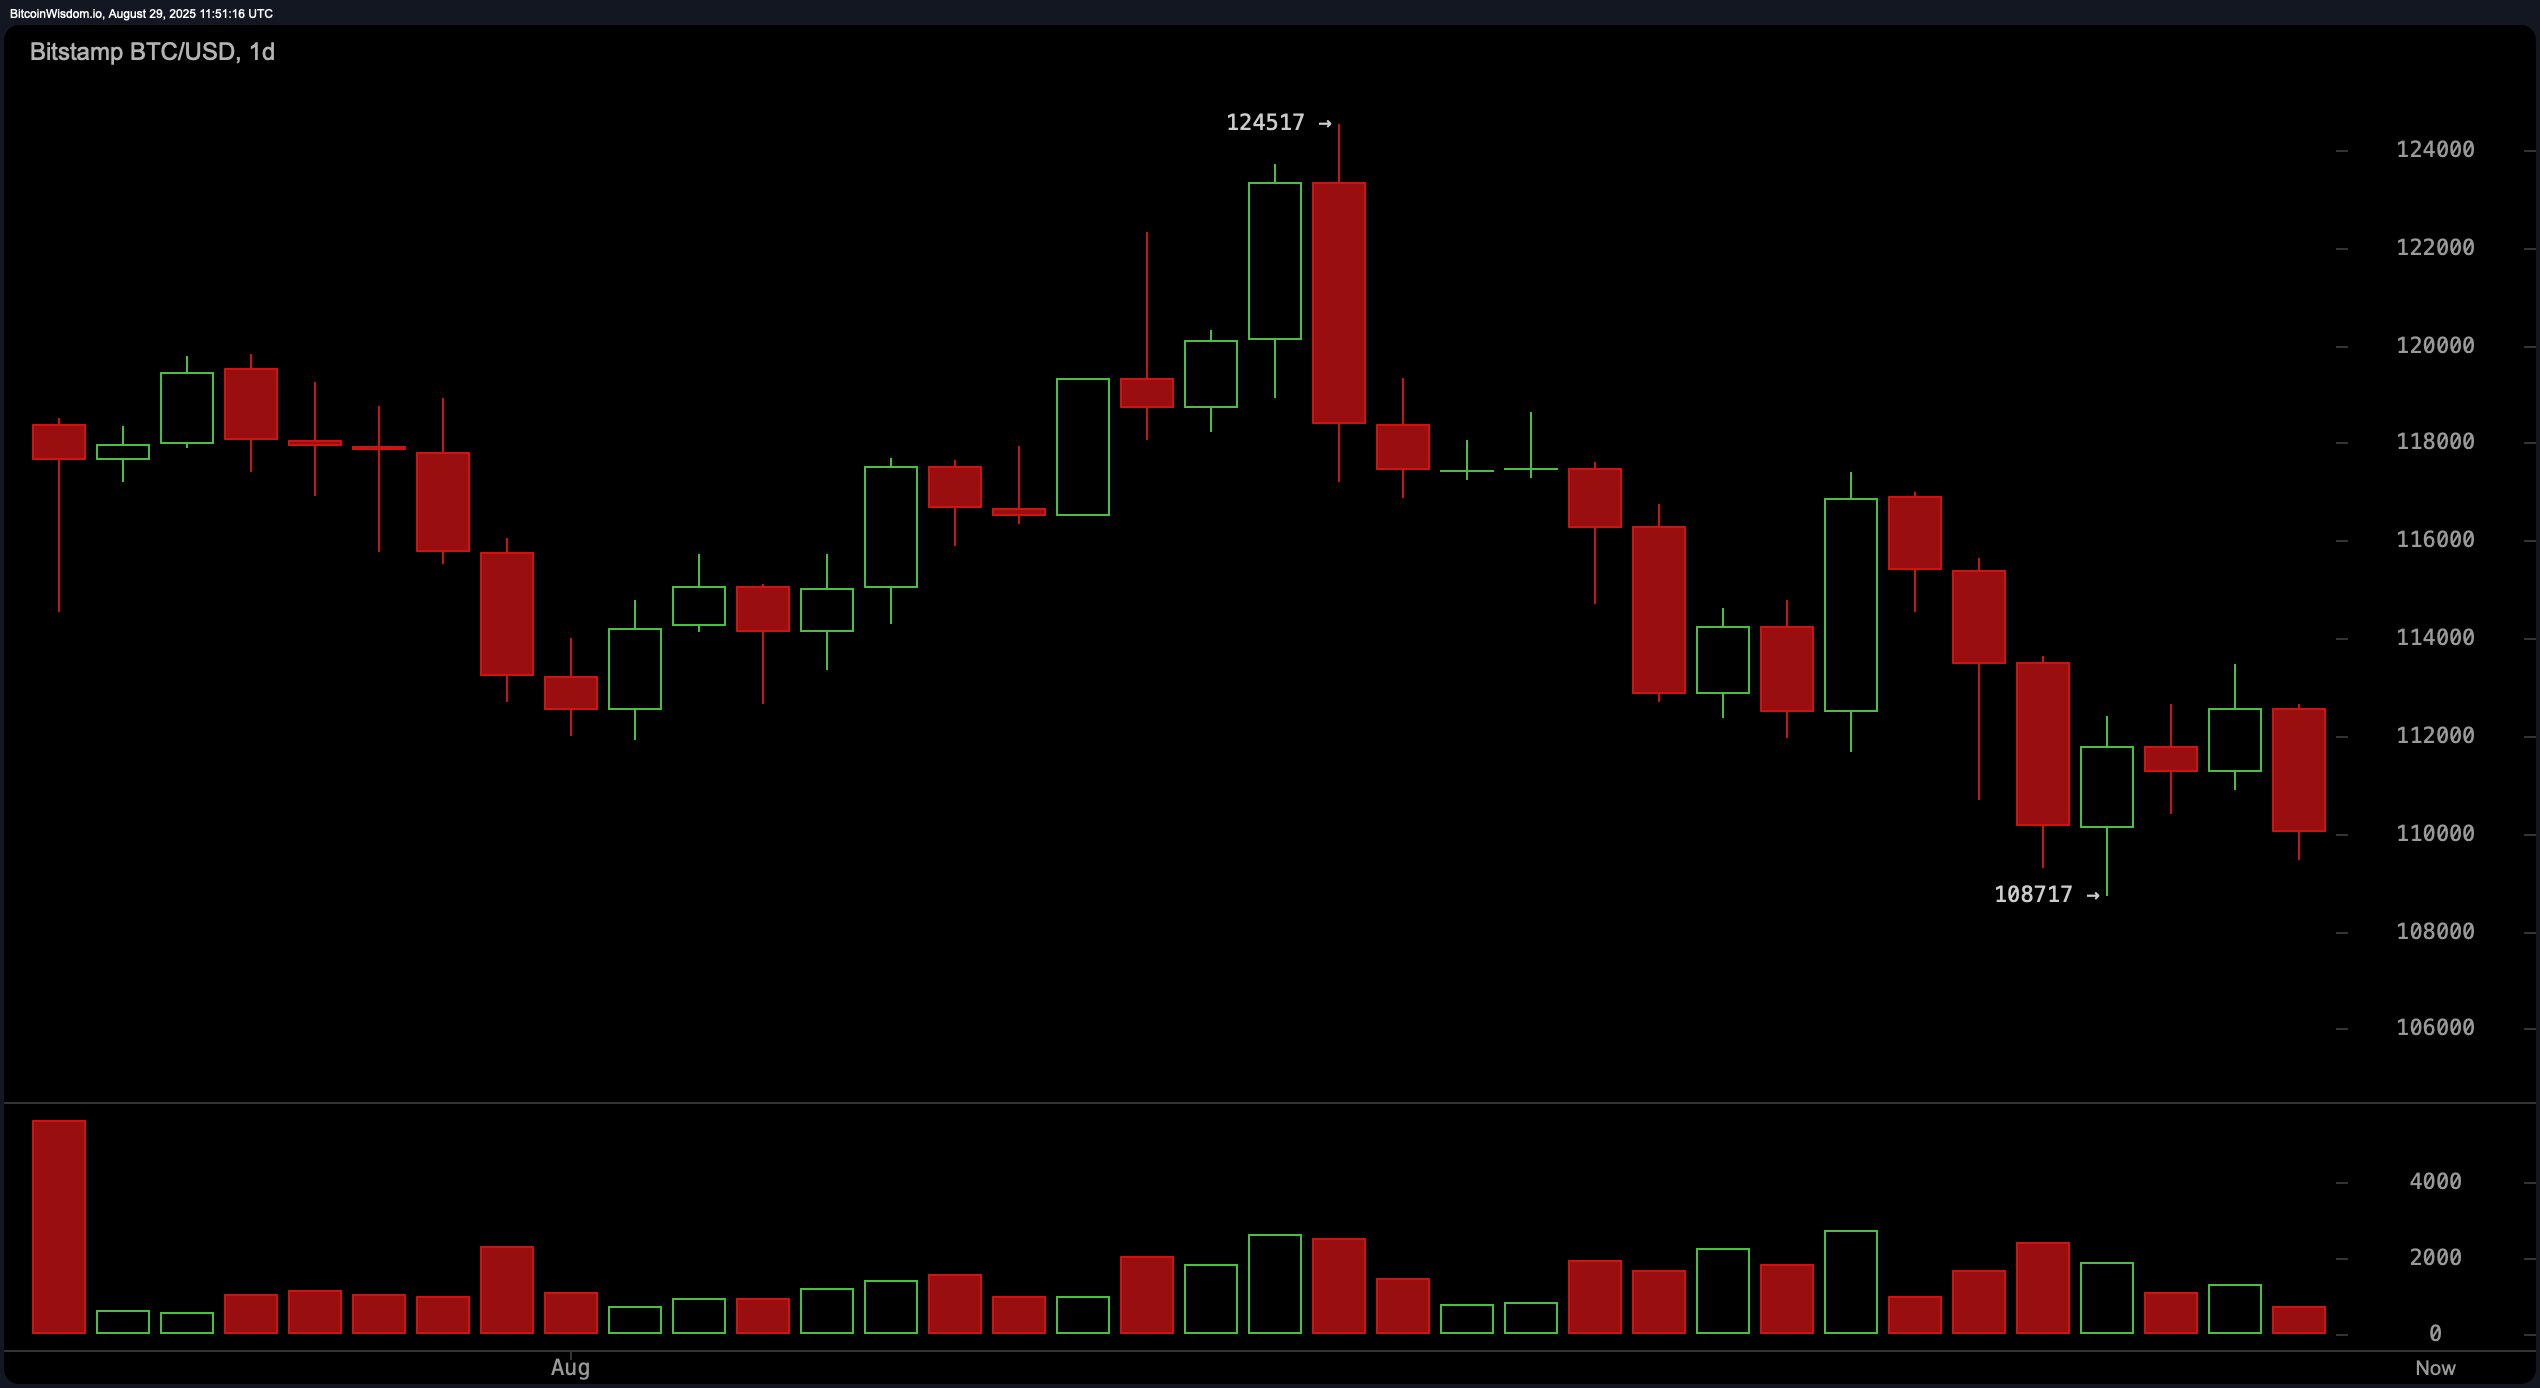
The broader trend, assessed through the daily chart, remains decisively bearish. Bitcoin has been unable to maintain levels above $116,000, with the most recent rejection at that level reinforcing a structure of consistent lower highs and lower lows. The decline in trading volume alongside this downtrend indicates weakening buying interest and increased trader indecision. The support at $108,717—formed by a recent low—now stands as a key threshold. Should bitcoin breach this level with strong volume, it could signal a continuation of the current downtrend.
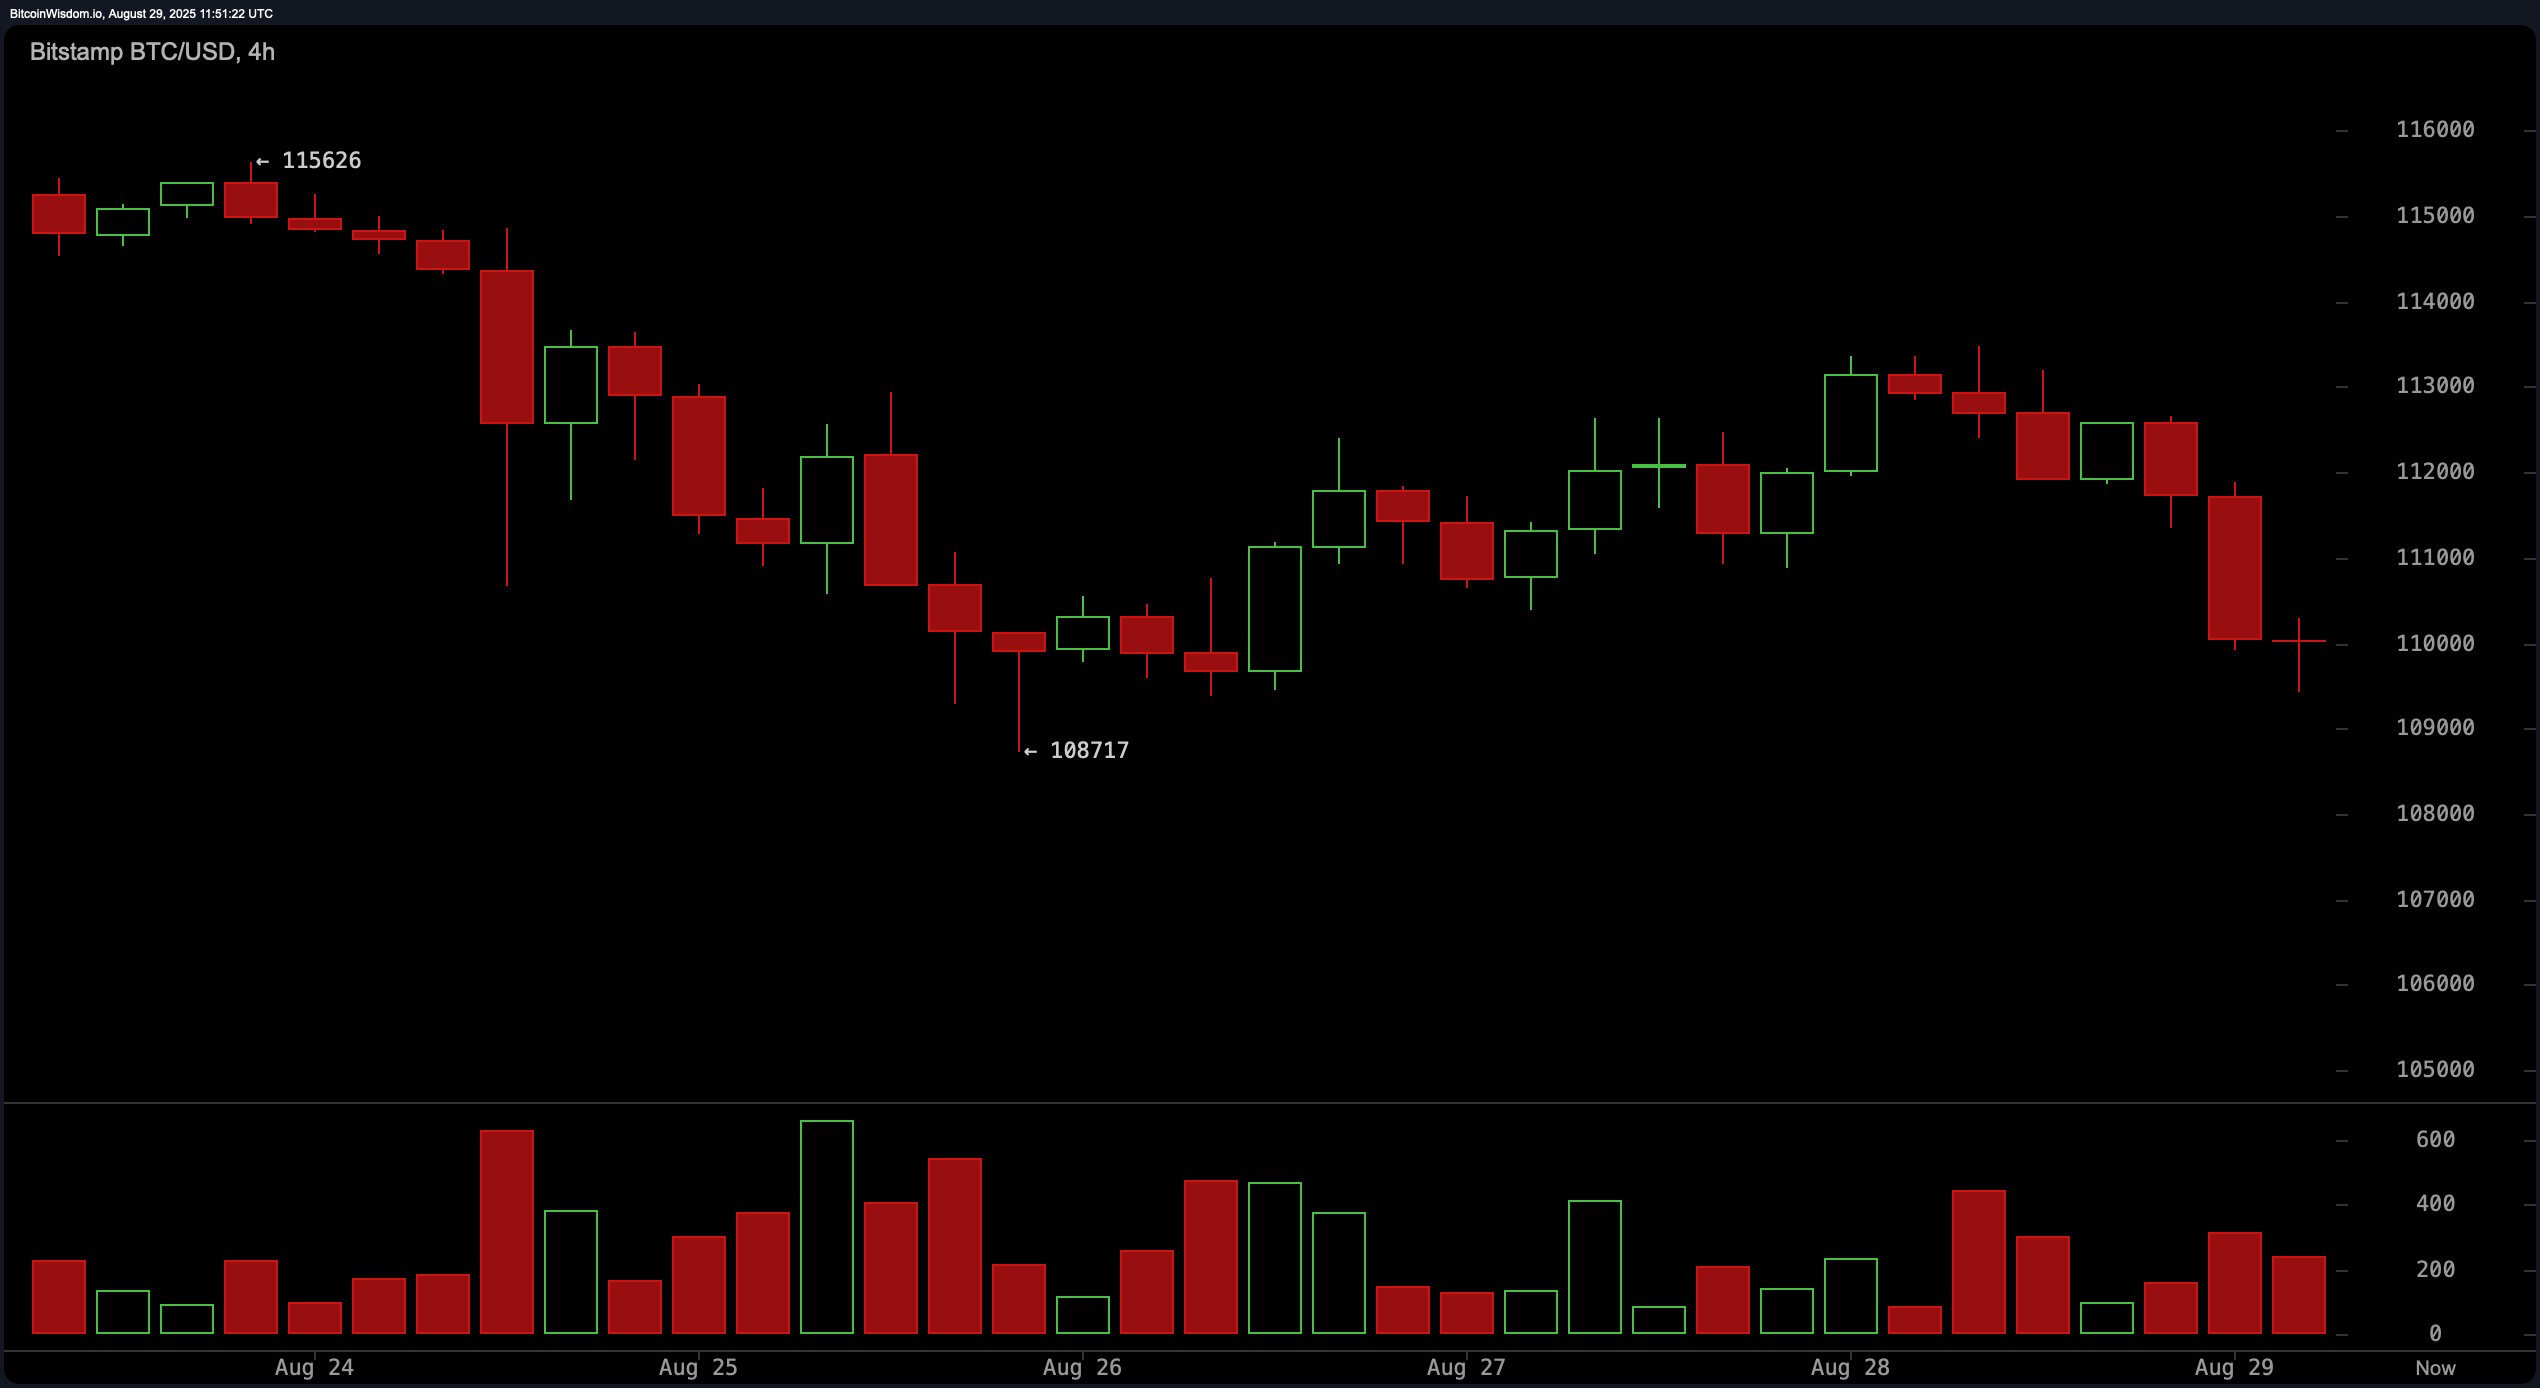
On the 4-hour bitcoin chart, the price experienced a minor bounce off the $108,717 support level but failed to break through resistance near $113,000. This movement appears to form a bear flag, a classic pattern that suggests further downside. Moreover, lower buying volume during upward moves, when compared with stronger volume on red candles, signals bearish divergence. Sellers remain firmly in control, with any rally facing significant rejection pressure before gaining traction.
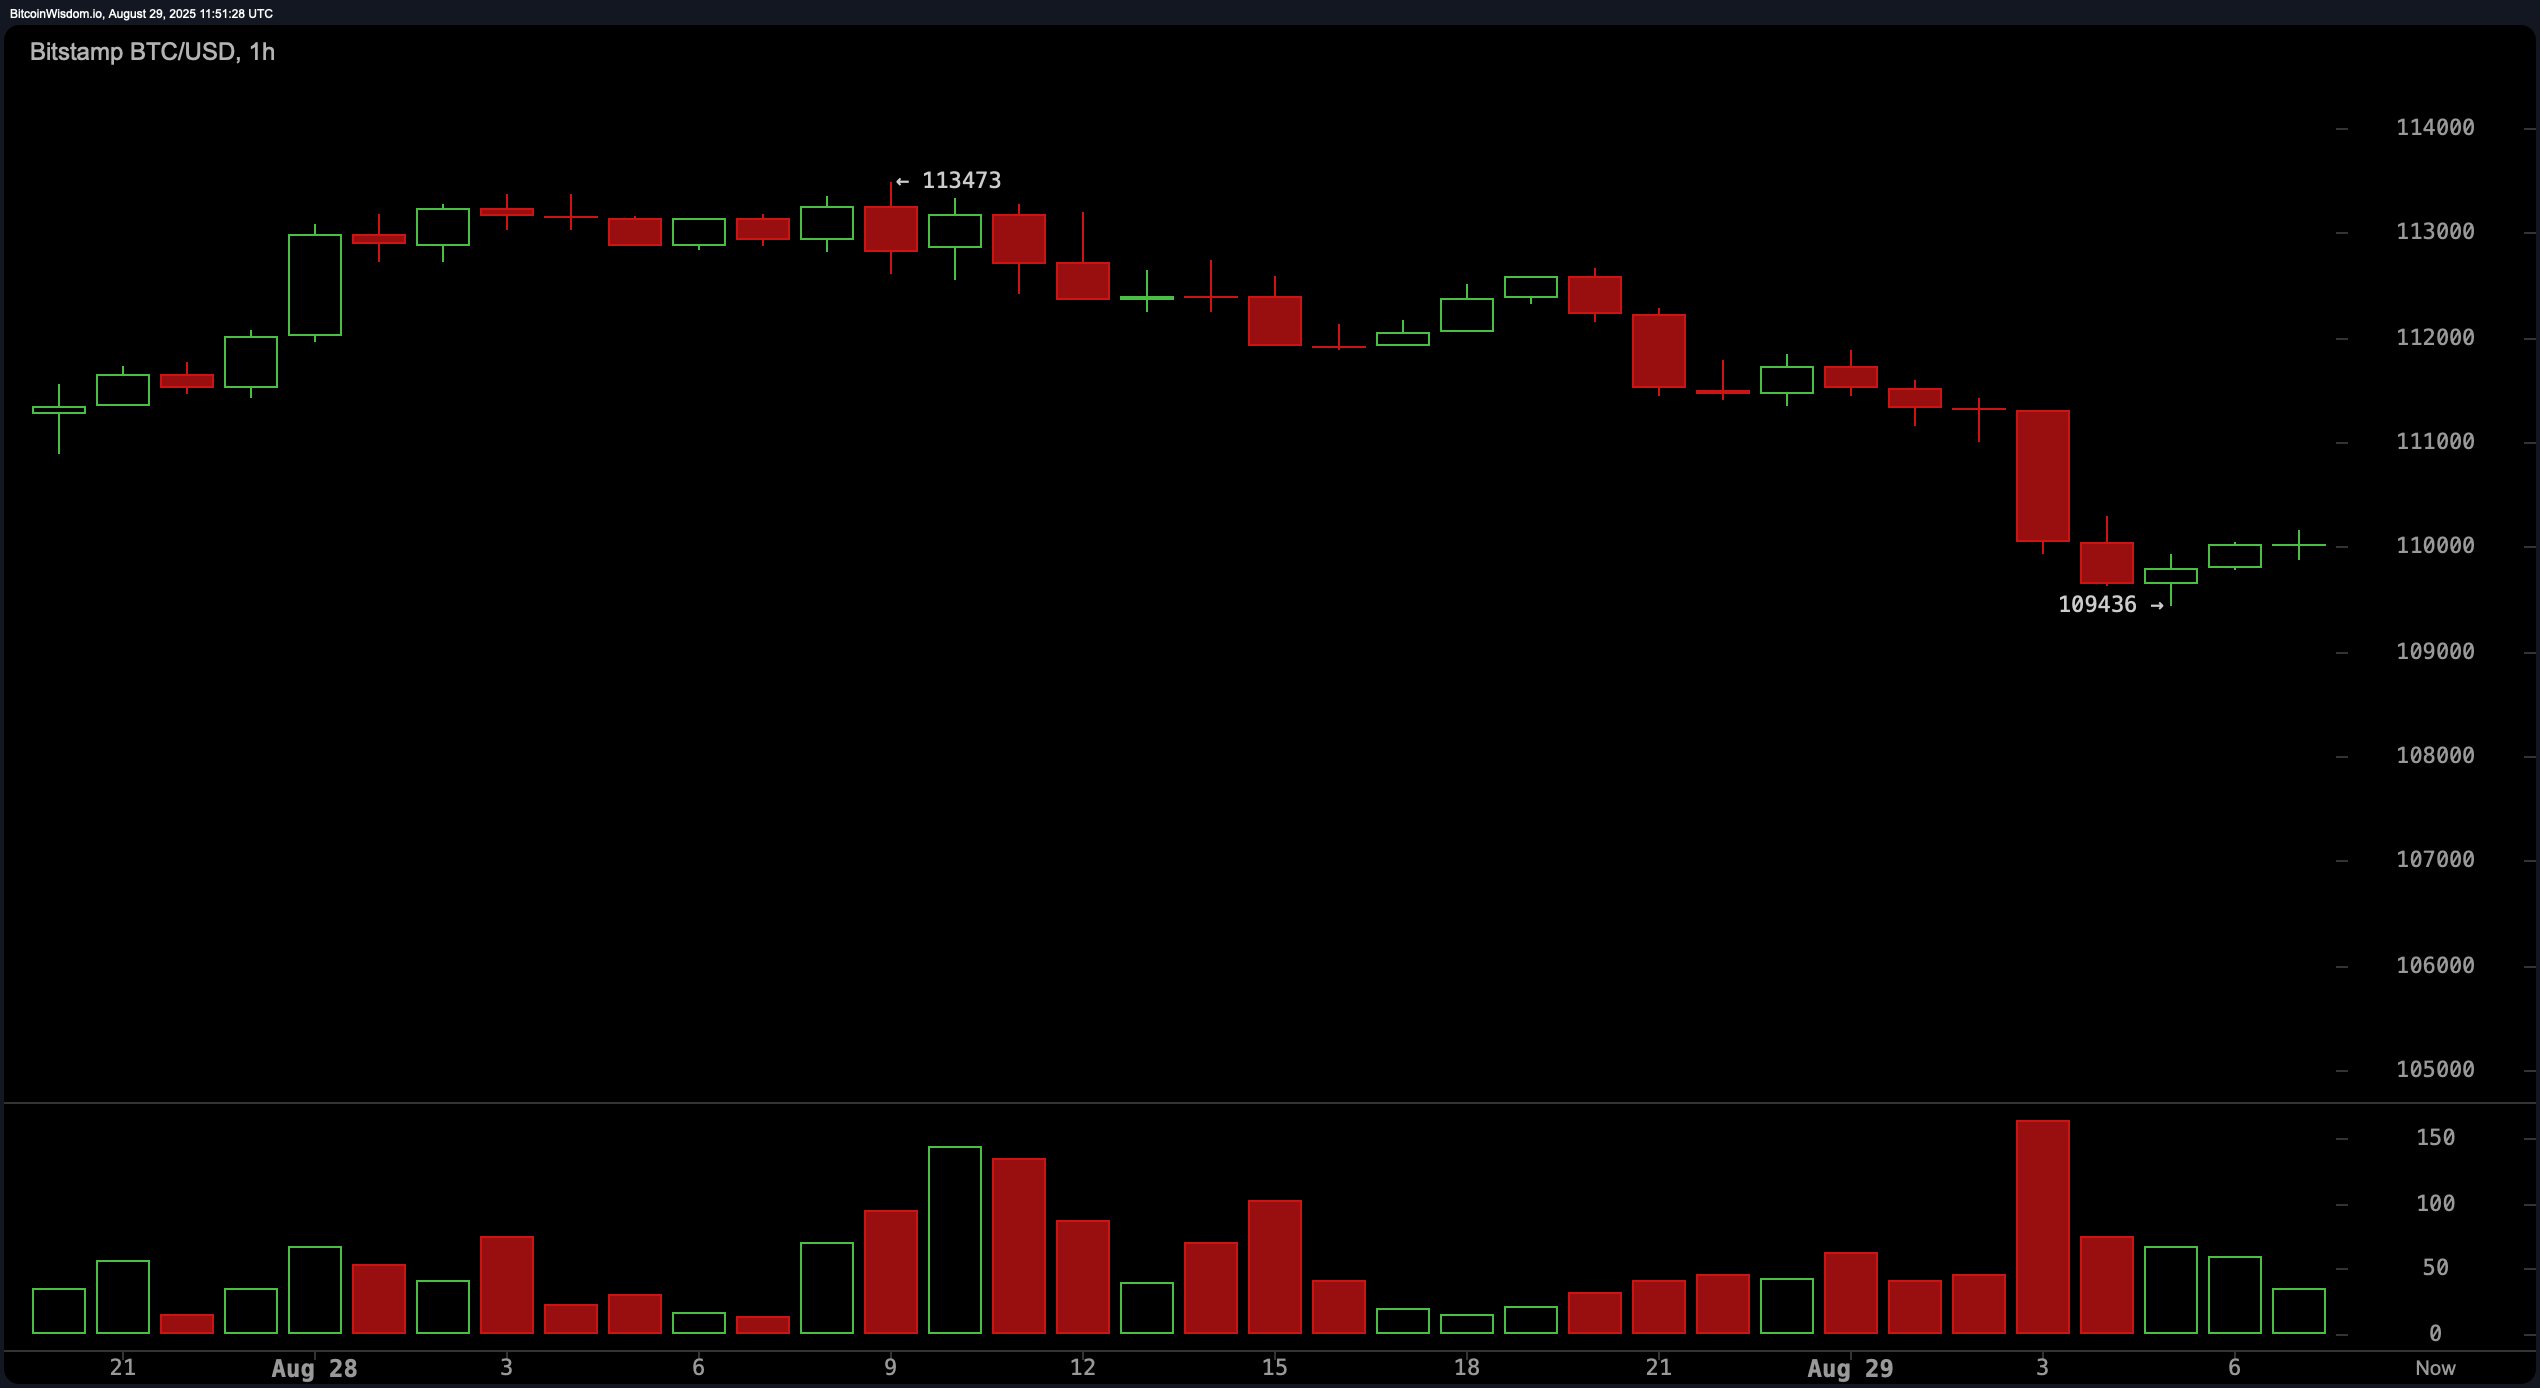
From a 1-hour perspective, bitcoin appears to be consolidating within a micro-range, attempting to base around $109,436. However, the lack of volume and small-bodied candles indicates that neither bulls nor bears are currently dominating this timeframe. While downward pressure has eased, bullish conviction remains absent. Until a breakout above $113,500 with corresponding volume materializes, short-term traders should treat the base-building efforts cautiously.
The technical indicators offer a mixed outlook. Among oscillators, the relative strength index (RSI) sits at 40, reflecting a neutral stance, while the Stochastic oscillator reads 22, also neutral. The commodity channel index (CCI) is at -110, indicating potential oversold conditions, but not yet prompting reversal signals. The average directional index (ADX) at 17 suggests a weak trend, and the Awesome oscillator’s value of -4,390 supports the lack of bullish momentum. Momentum at -2,964 gives a bullish signal, while the moving average convergence divergence (MACD) level at -1,417 remains bearish.
Looking at moving averages (MAs), bitcoin trades below nearly all key short- and medium-term levels. The exponential moving averages (EMA) and simple moving averages (SMA) for the 10, 20, 30, 50, and 100-periods all generate sell signals. Only the long-term 200-period EMA and SMA offer a glimmer of bullish support, as they maintain a positive rating at $103,995 and $101,155, respectively. These suggest that while the long-term structure remains intact, the short- to mid-term bias remains firmly negative.
Bull Verdict:
If bitcoin can sustain a move above $113,500 with strong buying volume confirmed on the 1-hour and 4-hour charts, a short-term reversal could be underway. This would position bulls to target the $116,000 and $118,500 resistance zones, though success depends on decisive momentum and market participation.
Bear Verdict:
The dominant trend remains bearish across all timeframes, with consistent rejections at key resistance and lower highs forming on each bounce. A confirmed break below $108,700 would reinforce the downtrend and open the door for declines toward $105,000 or even $102,000, especially if volume continues to spike on red candles.