
Bitcoin maintained a narrow trading band to start the month, holding above a critical support level of $107,000 while facing persistent resistance around the $112,000–$114,000 range. The technical landscape remains tilted toward consolidation with bearish undertones, as suggested by key oscillators and moving averages across the 1-hour, 4-hour, and daily charts.
Bitcoin
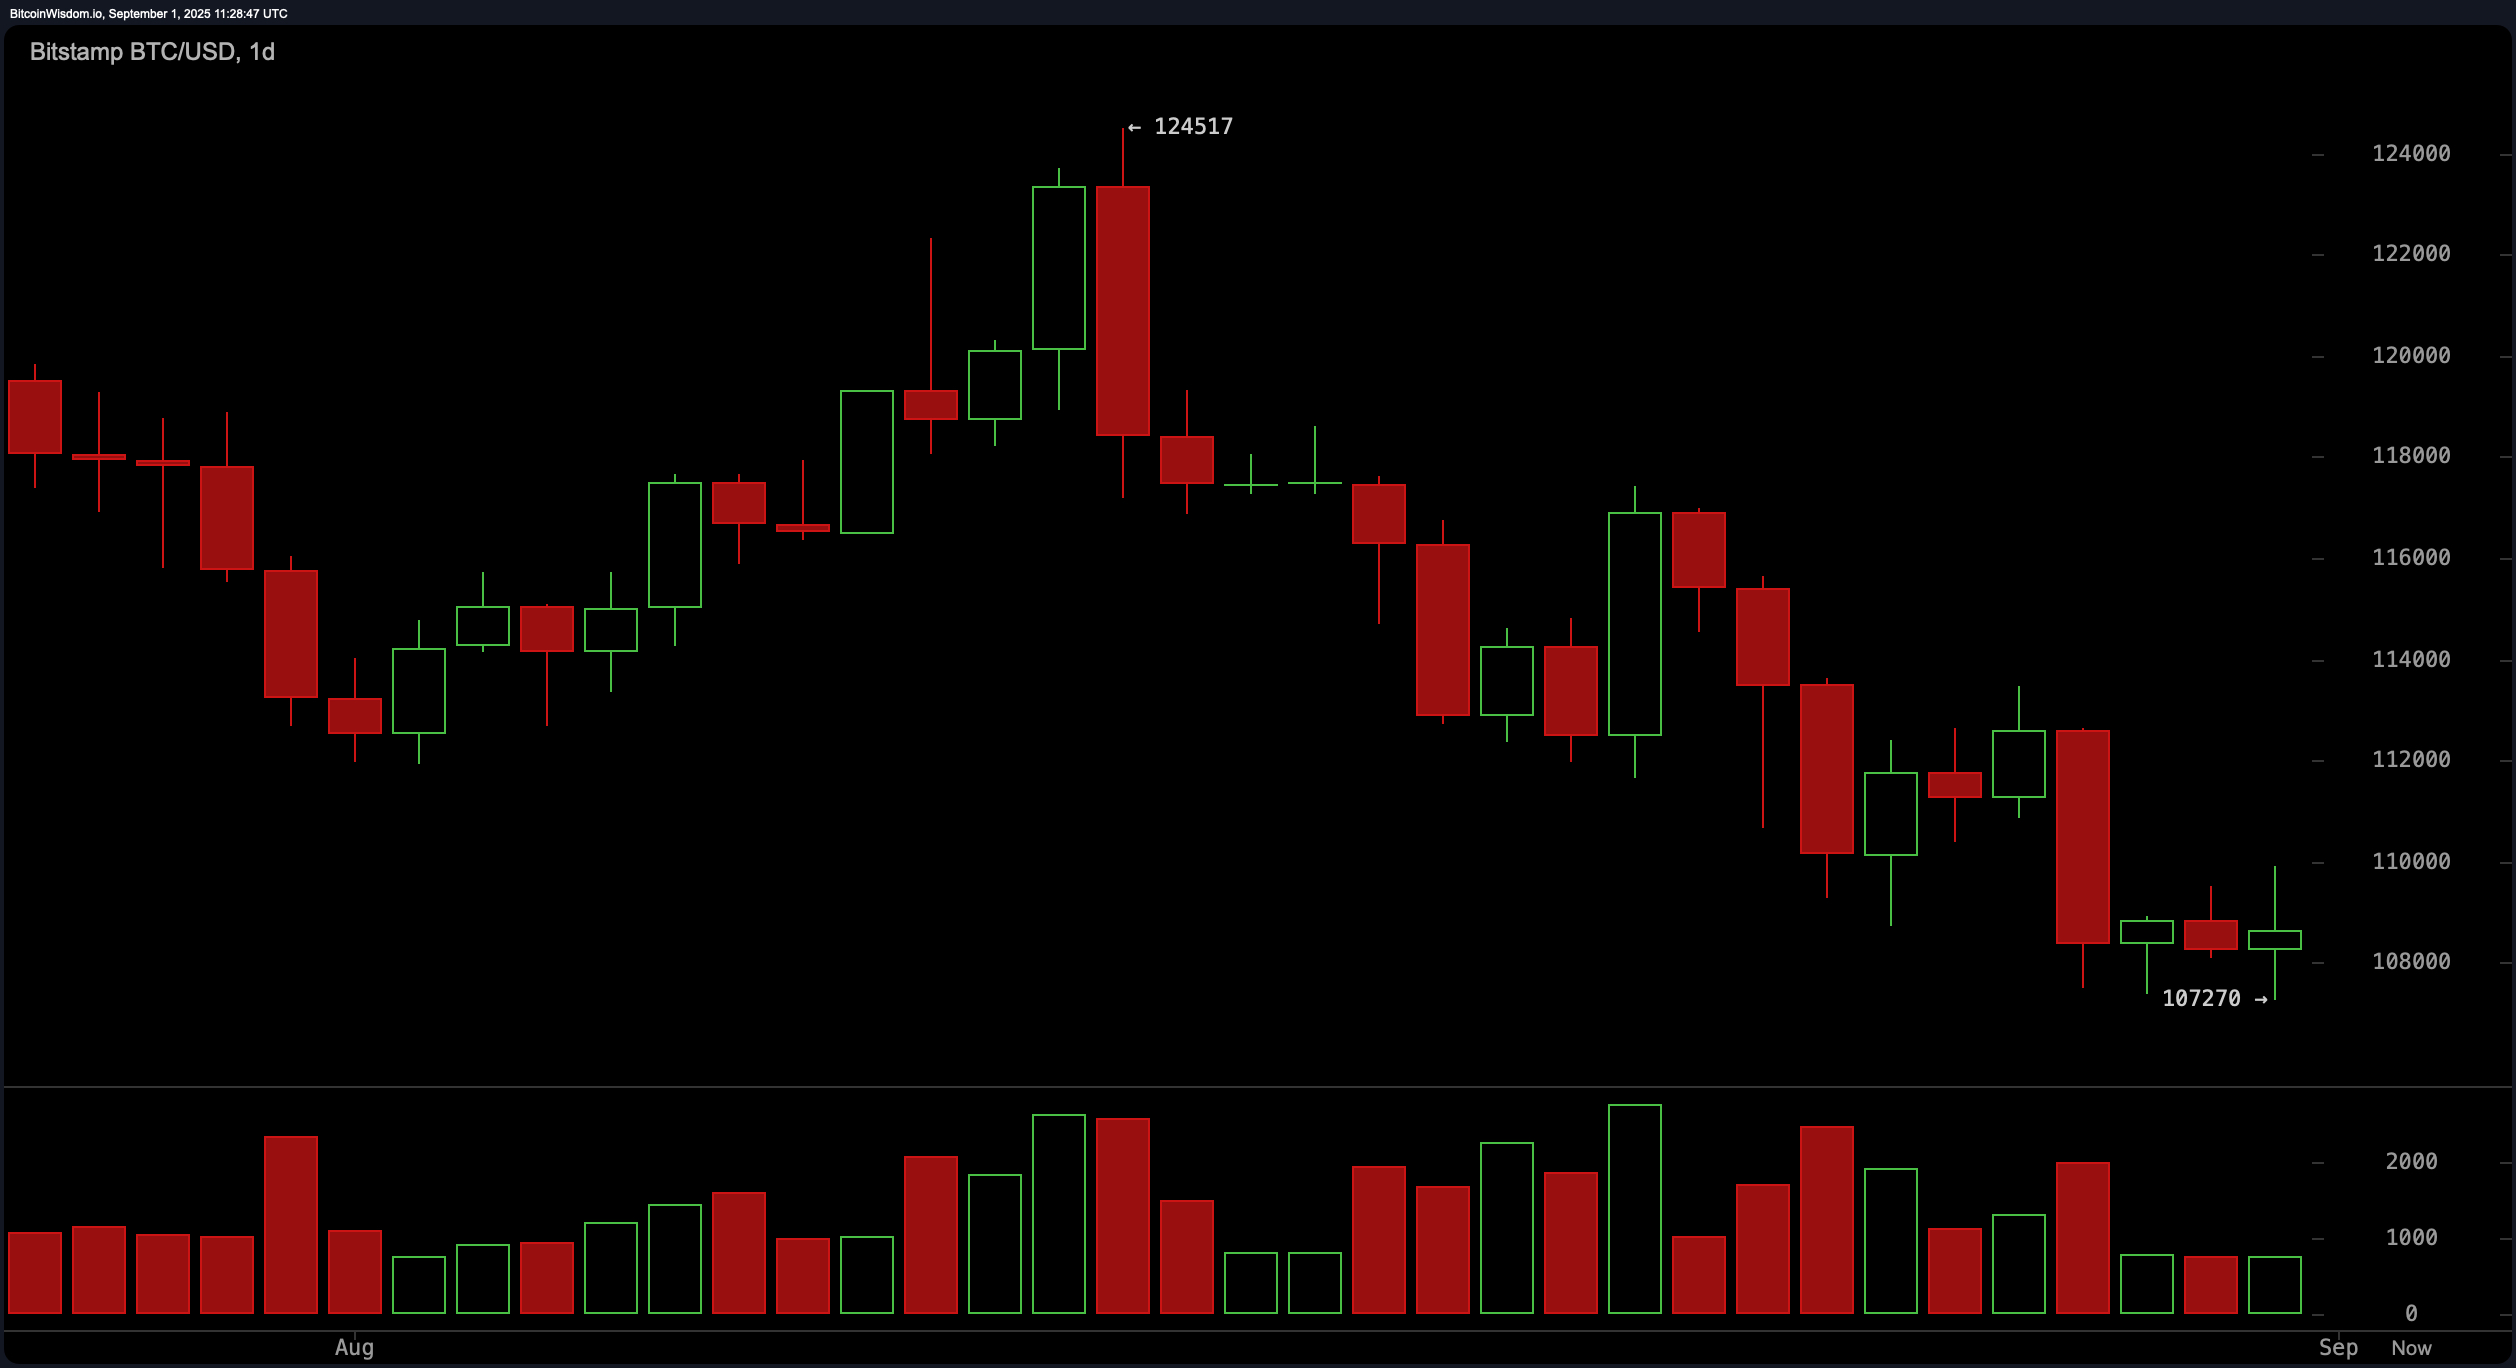
On the daily chart, bitcoin is navigating a defined downtrend from a recent peak of approximately $124,500 to a low near $107,270. This move has carved out a pattern of lower highs and lower lows, confirming a short-term bearish trend. Despite an attempted rebound, price action faltered near $112,000, reinforcing resistance at that level. Elevated volume on red candles highlights ongoing selling pressure. While the area around $107,000 continues to act as a strong support zone, any breakdown below it could open a path toward $104,000. Until a decisive bounce with volume materializes above $110,000, sentiment remains cautious.
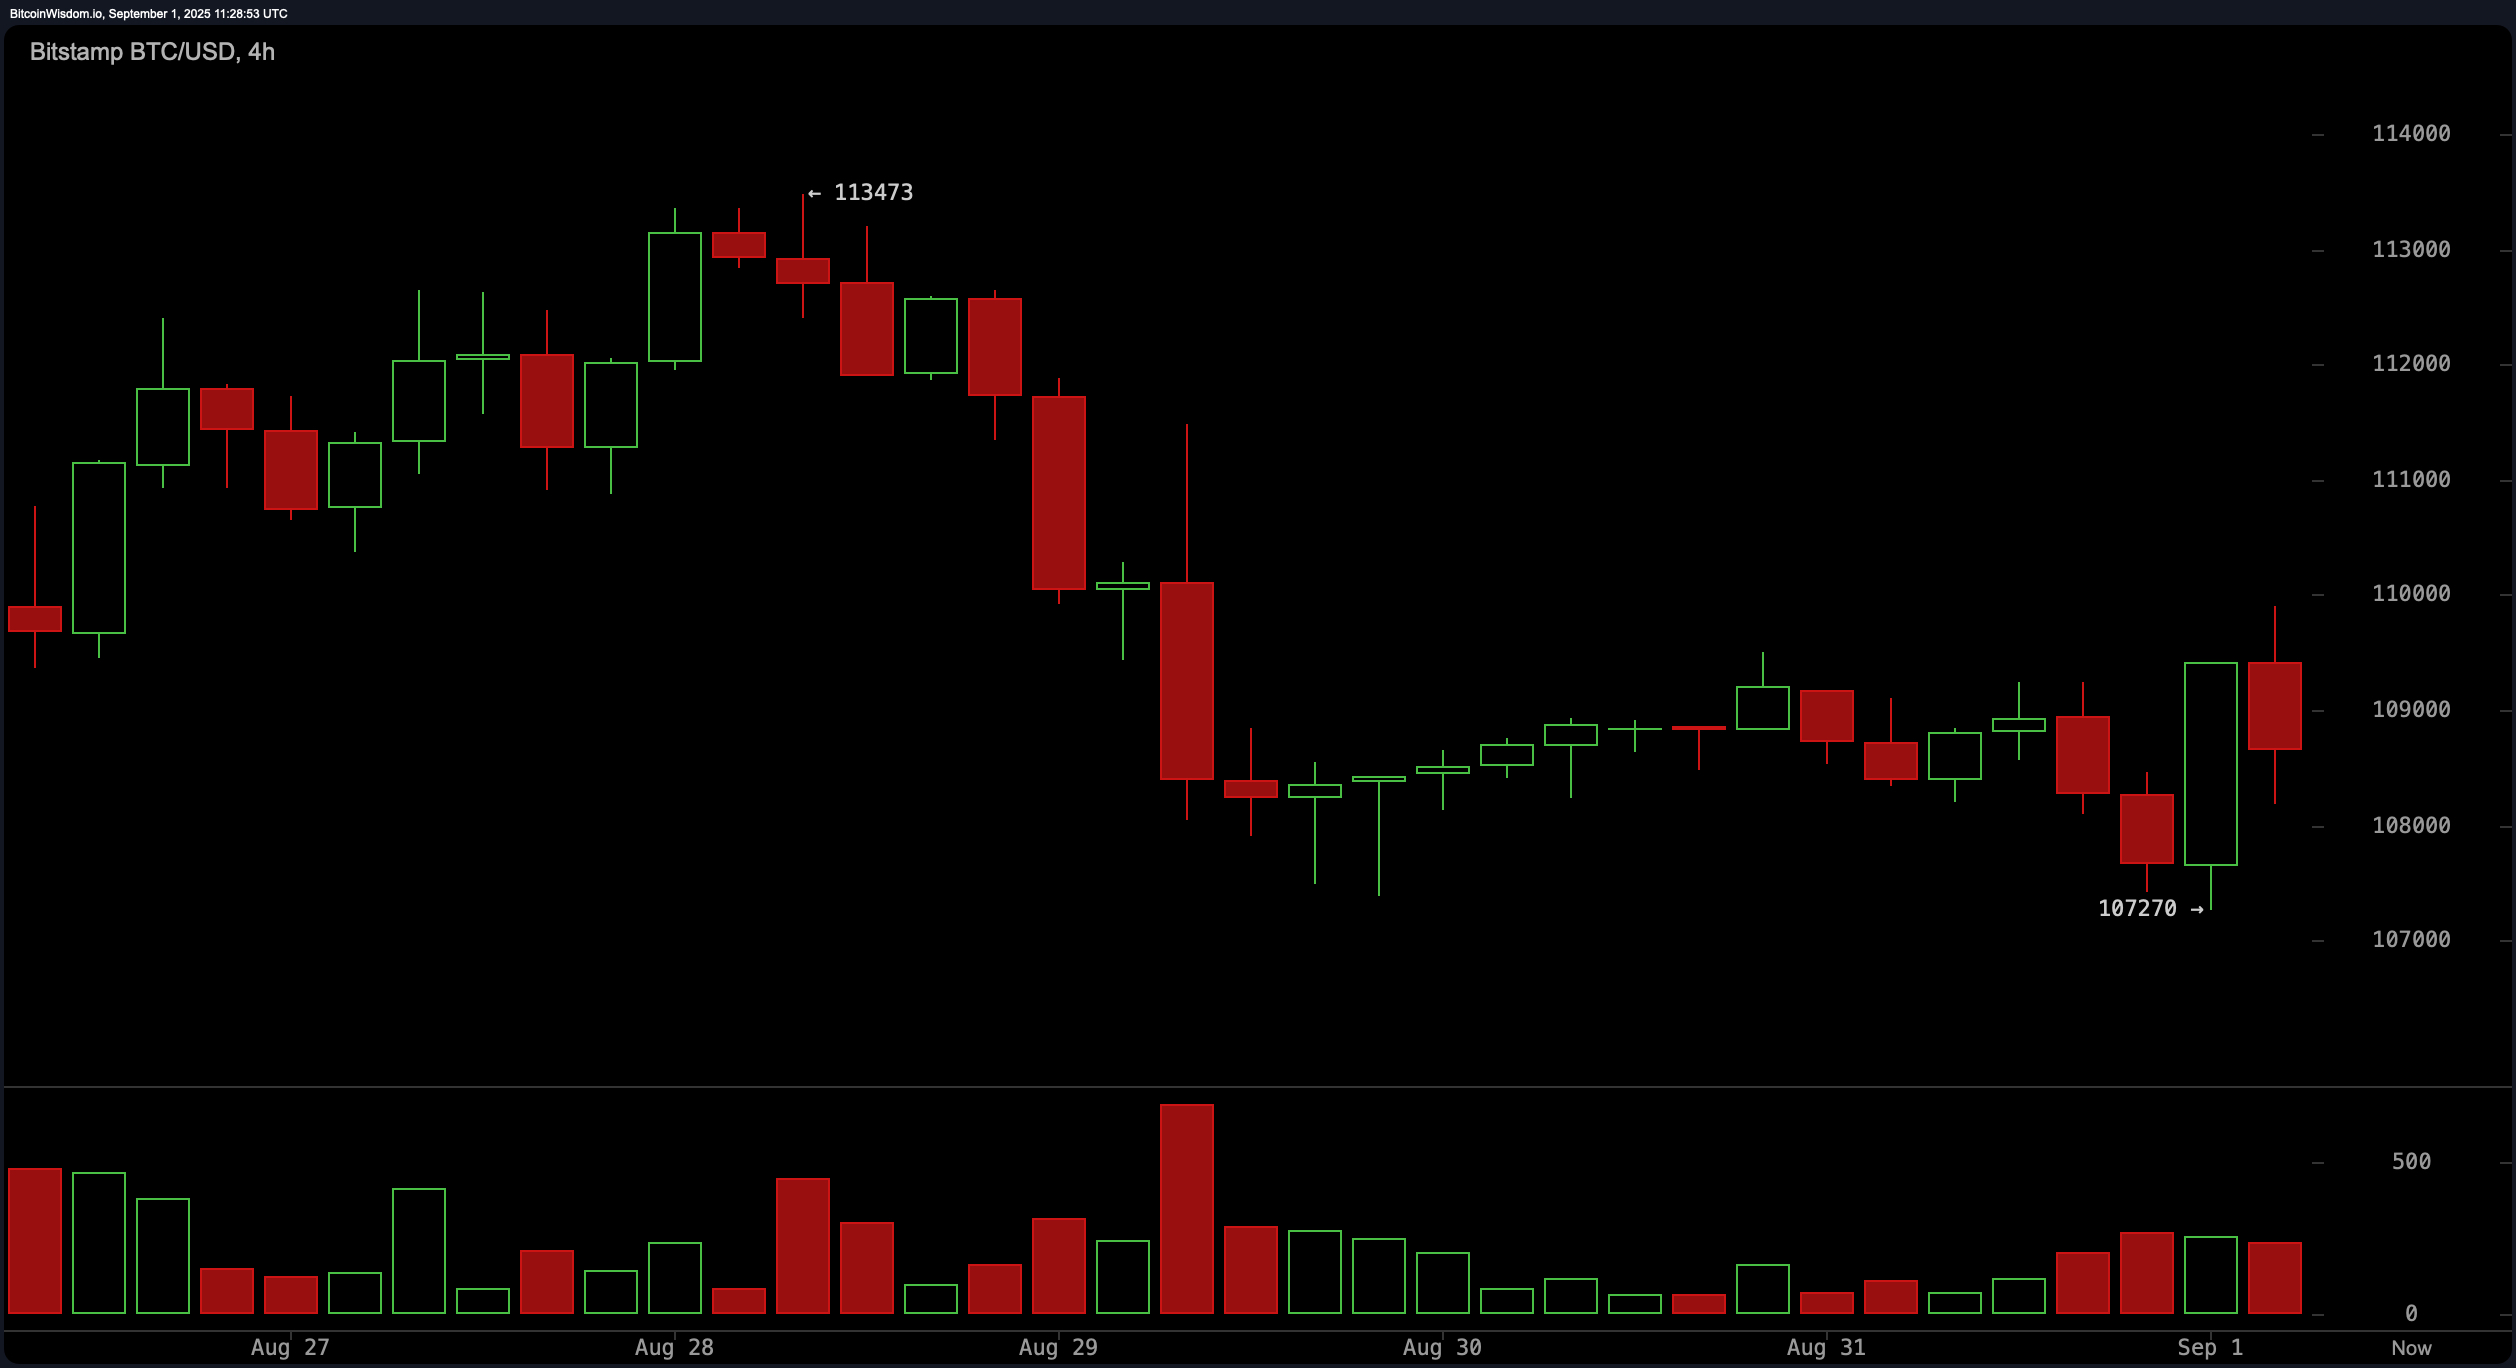
The 4-hour bitcoin chart reveals mid-term consolidation within a broader downtrend, with a recent bounce from $107,270 up to nearly $109,000 before retreating. Slight increases in volume on green candles point to emerging buyer interest, but momentum lacks conviction. A sustained move above $109,000 with strong volume could justify entries aiming for targets between $111,000 and $113,000. However, a failure to maintain this threshold risks invalidating the pattern and turning focus back to the support at $107,270.
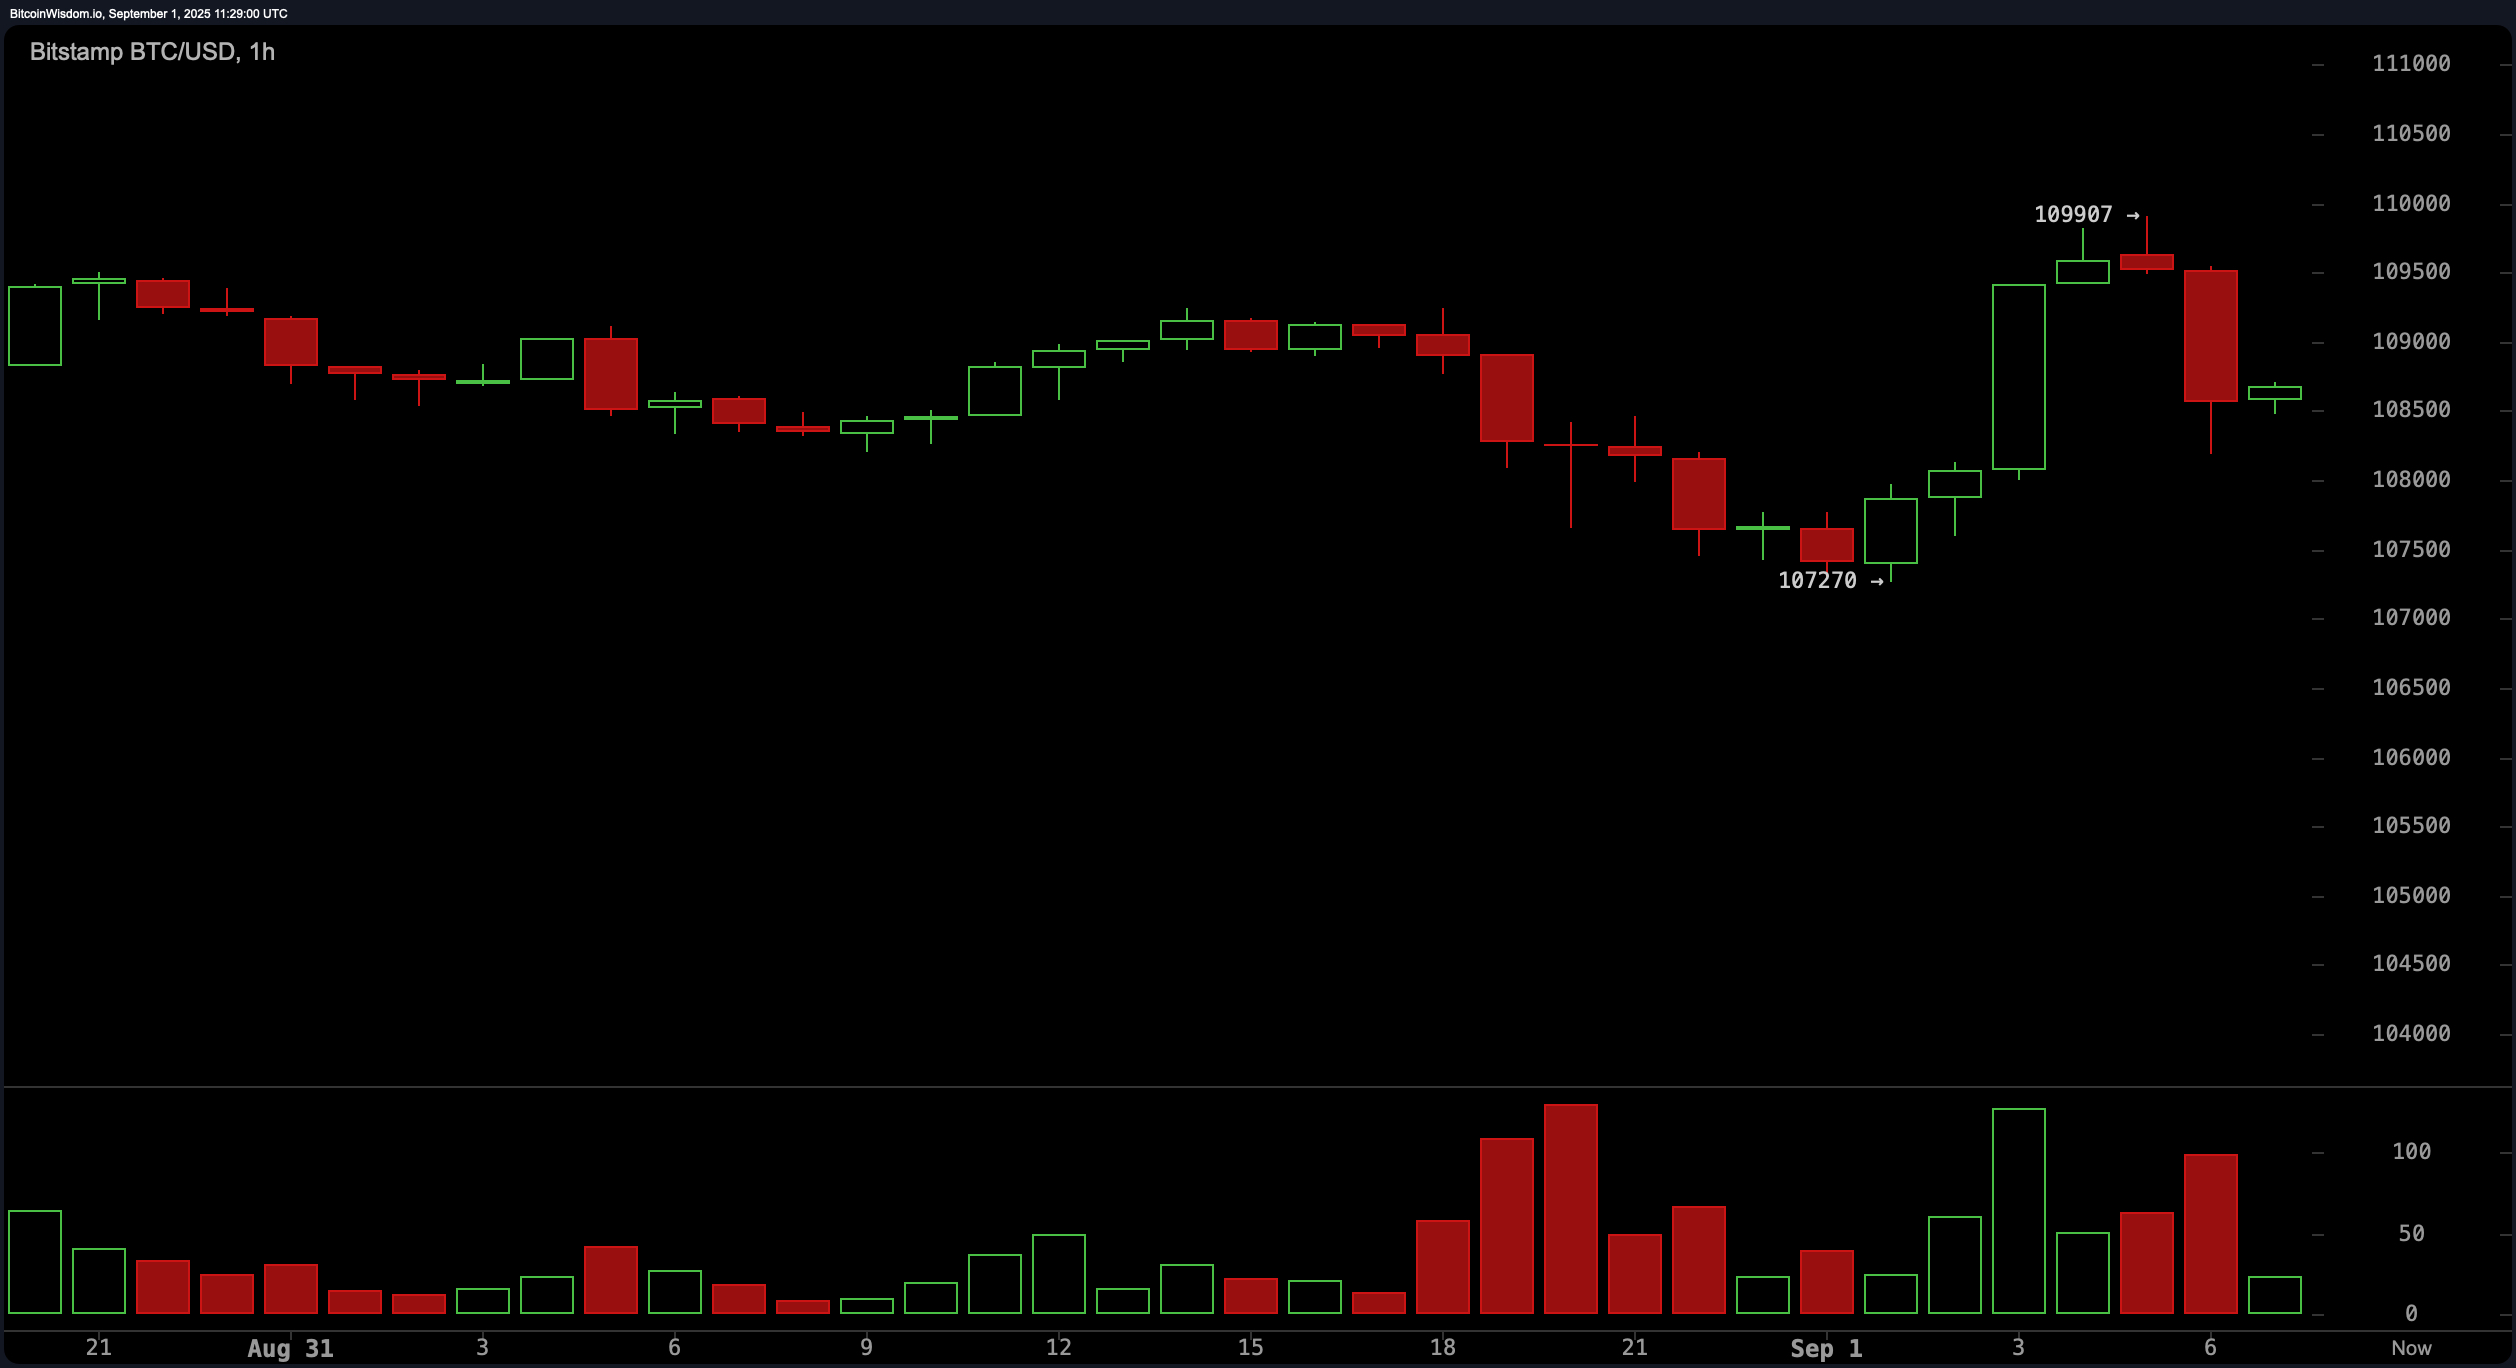
The 1-hour bitcoin chart paints a more optimistic, albeit fragile, picture. A micro uptrend from $107,270 to $109,900 was followed by a pullback, and the chart now appears to be forming a higher low. This could suggest bullish intent if price action holds above $108,500. A break and retest of the $109,000–$109,500 range may offer short-term trading opportunities targeting $110,500 to $111,000. Intraday volatility is high, and a close below $107,270 would invalidate bullish setups.
Oscillator readings further underline the mixed technical signals. The relative strength index (RSI) stands at 39, indicating neutral momentum. The Stochastic oscillator and average directional index (ADX) also suggest neutrality, while the commodity channel index (CCI) signals a potential bullish sign. Conversely, momentum and the moving average convergence divergence (MACD) levels are in a bearish territory, reflecting negative price acceleration and weak trend conviction.
Moving average data leans heavily bearish in the short to mid-term. All major short-term indicators—exponential moving averages (EMAs) and simple moving averages (SMAs) for 10, 20, 30, 50, and 100 periods—are positioned above the current price and show negative signals. Only the 200-period exponential moving average (EMA) and simple moving average (SMA), sitting at $104,116 and $101,324, respectively, register as bullish signals, indicating that while long-term support remains intact, shorter-term pressure prevails.
In summary, bitcoin is perched on critical support as bulls attempt to stabilize momentum. A conclusive move above $110,000 could shift the near-term outlook, but until then, traders remain on alert for breakdowns below $107,000. Market participants should watch for volume confirmation and key price action signals in the $109,000–$114,000 range to gauge directional intent.
Bull Verdict:
If bitcoin can sustain support above $108,500 and reclaim the $109,000–$110,000 range with volume, a short-term rebound toward $112,000–$114,000 remains plausible. A break above $114,000 would mark a potential shift in structure and could initiate a broader bullish reversal.
Bear Verdict:
With momentum indicators flashing sell signals and moving averages stacking against price, bitcoin remains vulnerable to further downside. A decisive close below $107,000 would invalidate bullish setups and open the door to a potential retracement toward $104,000 or lower.