
As September begins, the cryptocurrency market is on edge over the possibility that Bitcoin (BTC) may adopt a sustained bearish outlook, based on its historical performance.
Data shows that September has been Bitcoin’s weakest month since 2013, with an average return of -3.77%. The recent 5.91% drop in August has only added to the skepticism, as traders weigh the risks of further losses amid looming interest rate hikes.
However, prominent online cryptocurrency analyst TradingShot suggested that technical signals indicate Bitcoin may potentially break its September curse.
In a TradingView post on September 1, the analyst noted that since May, BTC has traded within a clear upward channel, producing two bullish legs of almost identical size, rising 22.07% and 21.05% respectively.
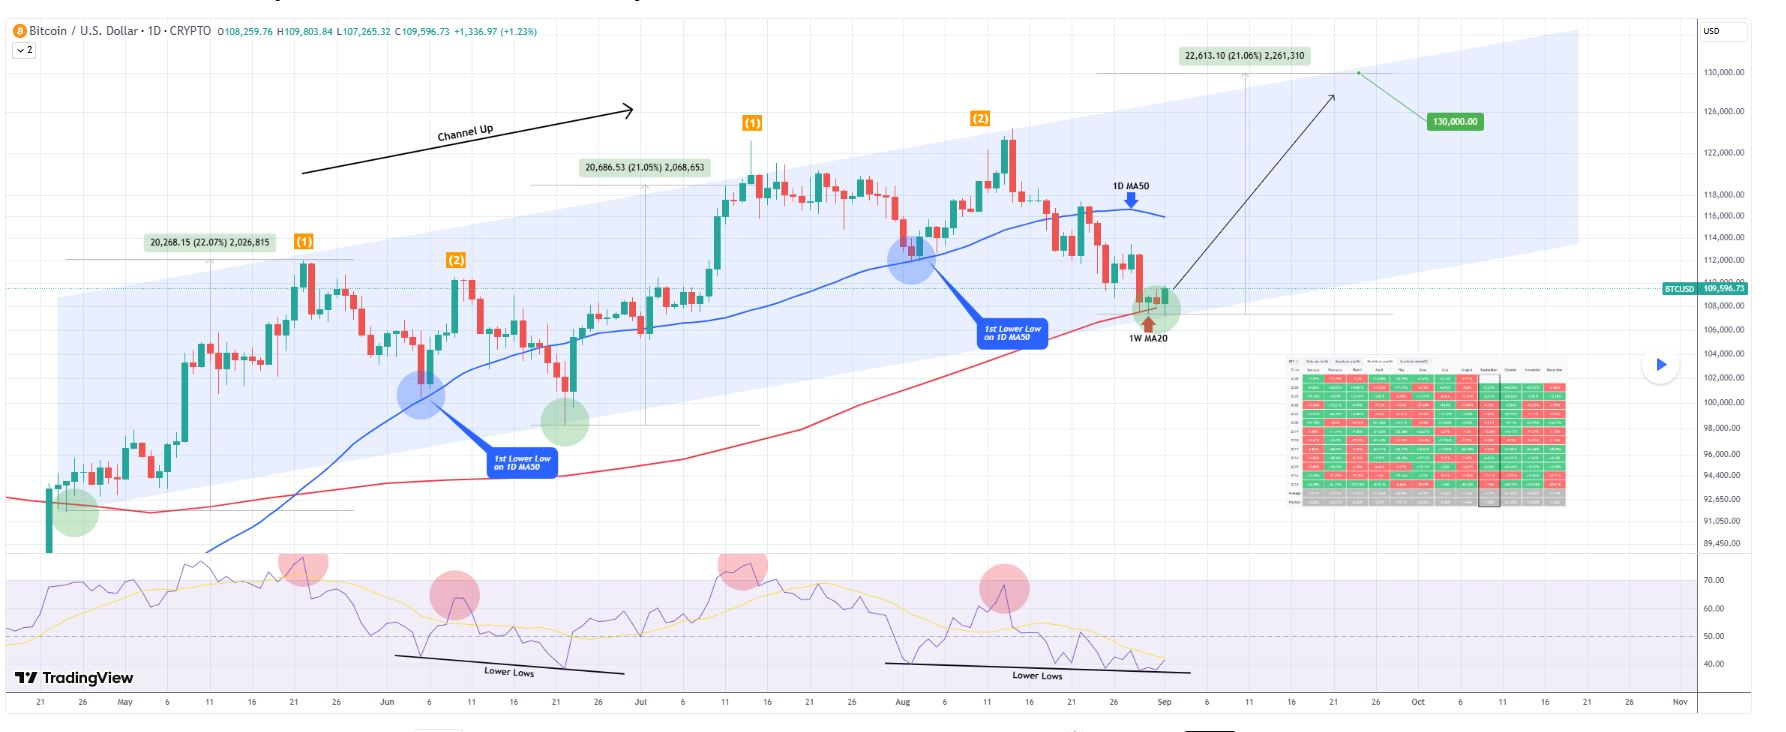
Each correction followed a predictable pattern, first bottoming at the 50-day moving average (MA) and later at the channel’s lower boundary.
Interestingly, the current setup strengthens the case for a rebound. Bitcoin has now tested the 20-week MA, a level that has historically served as a launchpad for major rallies in bull cycles.
Momentum indicators also support this view, with the daily relative strength index (RSI) forming lower lows, similar to conditions that preceded previous rebounds, such as June’s rally.
If Bitcoin repeats this pattern, even a conservative bullish leg of 21% could drive the price toward $130,000, according to TradingShot. This outlook aligns with cycle-top models, which anticipate further upside as long as the broader channel structure remains intact.
Bitcoin price analysis
At press time, Bitcoin was trading at $108,400, down less than 0.1% in 24 hours but nearly 3% lower on the weekly chart.
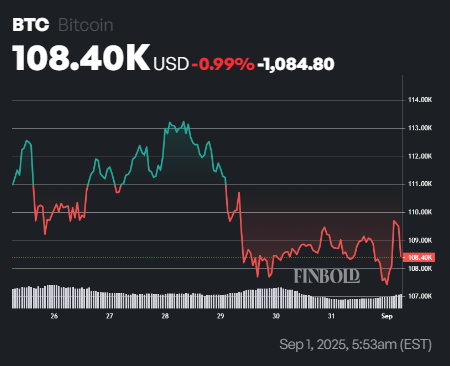
From a technical perspective, Bitcoin’s 50-day SMA sits higher at $116,091, acting as near-term resistance, while the 200-day SMA remains well below at $95,954, confirming that the broader trend is still bullish despite short-term weakness.
Momentum, however, remains fragile. The 14-day RSI stands at 38.05, indicating oversold territory, which signals selling pressure but also suggests rebound potential if buyers re-enter the market.
Featured image via Shutterstock.