Bitcoin’s futures market is cooling down after months of high-stakes activity. New data suggests retail traders are now dominating the scene, as whales scale back.
- Whale participation in Bitcoin futures is declining, as shown by lower average order sizes and reduced large trades.
- Retail traders now dominate the BTC futures market, contributing to weaker price momentum and increased volatility.
- Futures sentiment has turned bearish, with taker sell volume outweighing buys since late July, despite BTC holding above $110K.
- Bitcoin is consolidating between $100K–$125K, and without renewed whale interest, a breakout remains unlikely in the near term.
Bitcoin’s (BTC) futures market appears to be entering a cooling phase, with declining participation from whales and growing influence from retail traders. This shift has sparked concerns of bearish sentiment and potential range-bound movement, despite broader market optimism.
BTC futures market weakens as whale activity declines
According to CryptoQuant analyst EgyHashX, the futures market is transitioning from being whale-driven to more retail-led, with implications for Bitcoin’s near-term trajectory.
“Bitcoin’s futures market is cooling, with reduced whale activity and stronger retail influence reinforcing bearish sentiment. Unless whales demand returns, the price is likely to remain range-bound or face downside pressure,” EgyHashX stated.
The Futures Average Order Size chart, which reflects trading volume per transaction, shows a clear decline in large trades.
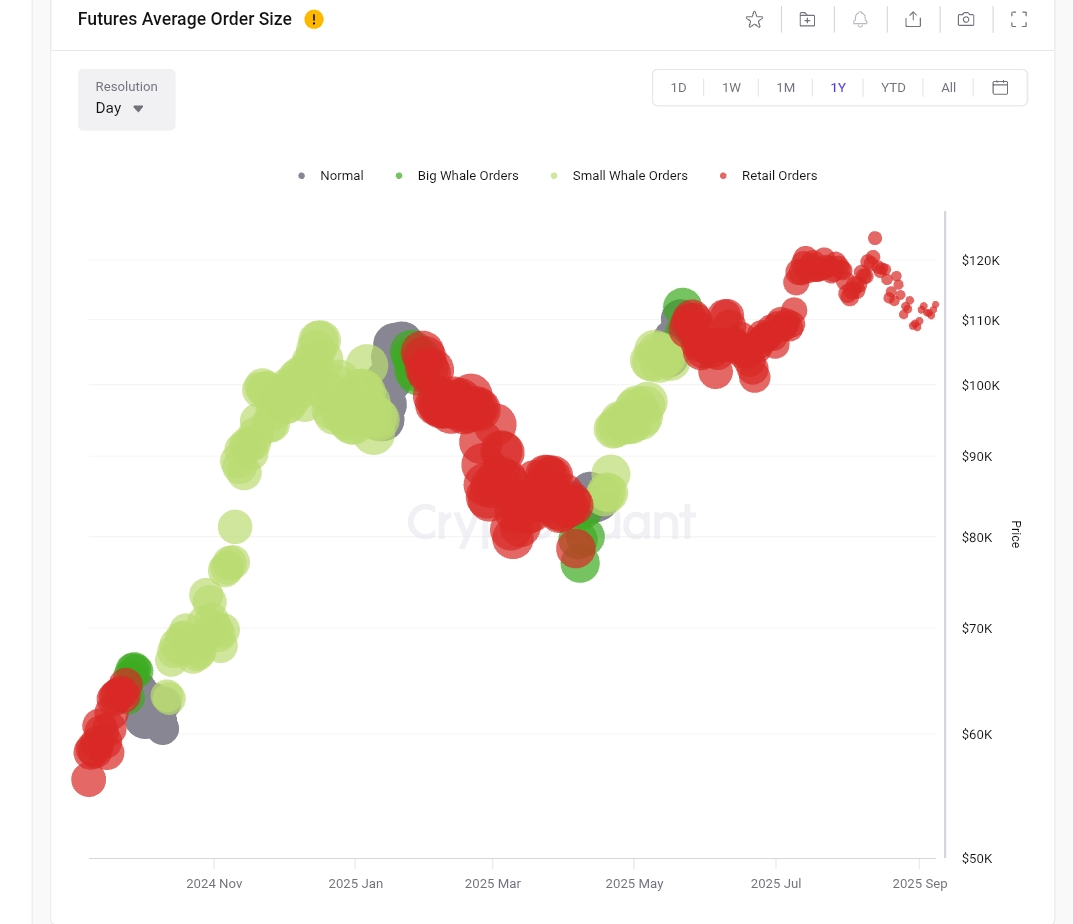
During Bitcoin’s rise from $100K to $120K between June and September 2025, retail participation surged, overpowering the influence of institutional players. This pattern stands in contrast to the October 2024 to January 2025 period, when whales entered the market during Bitcoin’s sub-$90K accumulation phase.
Supporting this observation, the Futures Volume Bubble Map highlights how the current price rally differs from earlier speculative spikes.
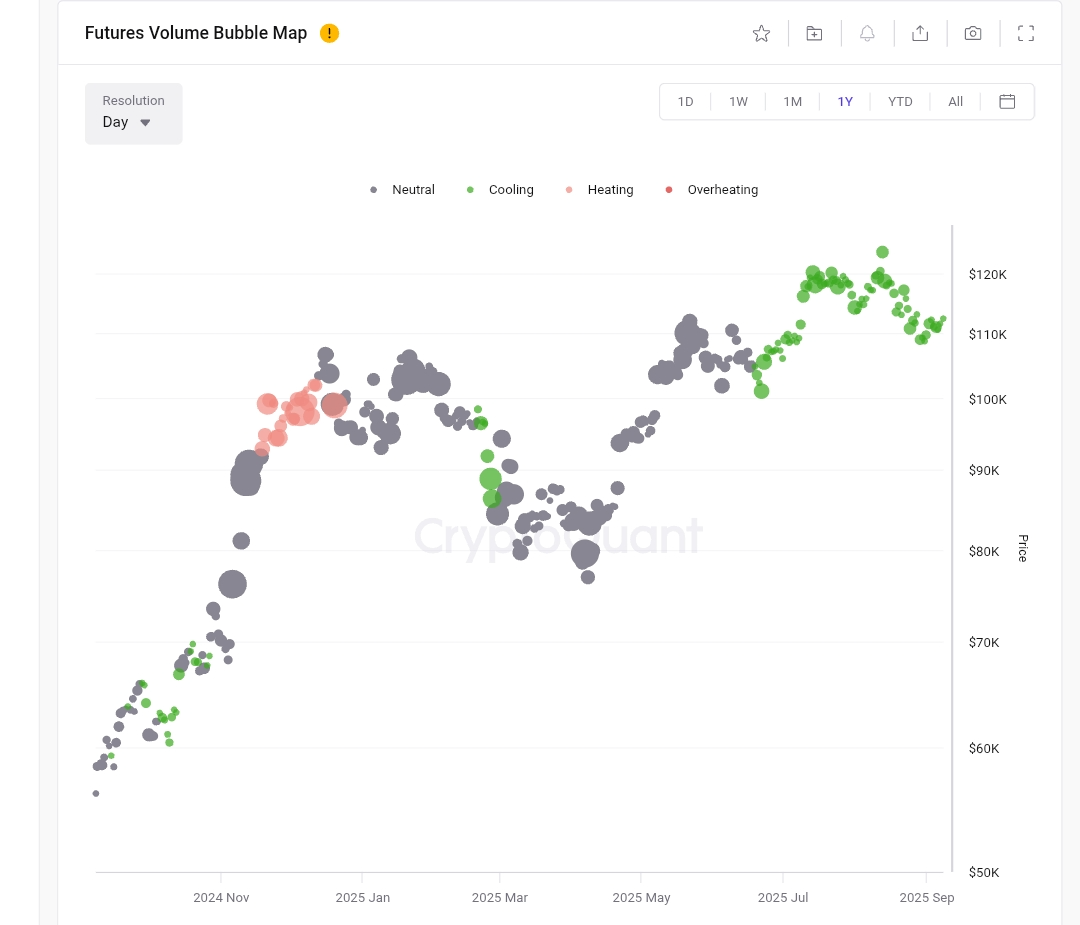
The recent months have shown mainly green “cooling” bubbles, suggesting healthy trading activity without the excess leverage that often precedes sharp corrections. The organic nature of the current rally implies a more structurally stable climb, but it also indicates reduced market excitement, pointing to a more cautious sentiment among large players.
Sellers take control as rice rises
Adding to the bearish tone is the Bitcoin Futures Taker CVD (Cumulative Volume Delta), which reflects dominant selling activity.
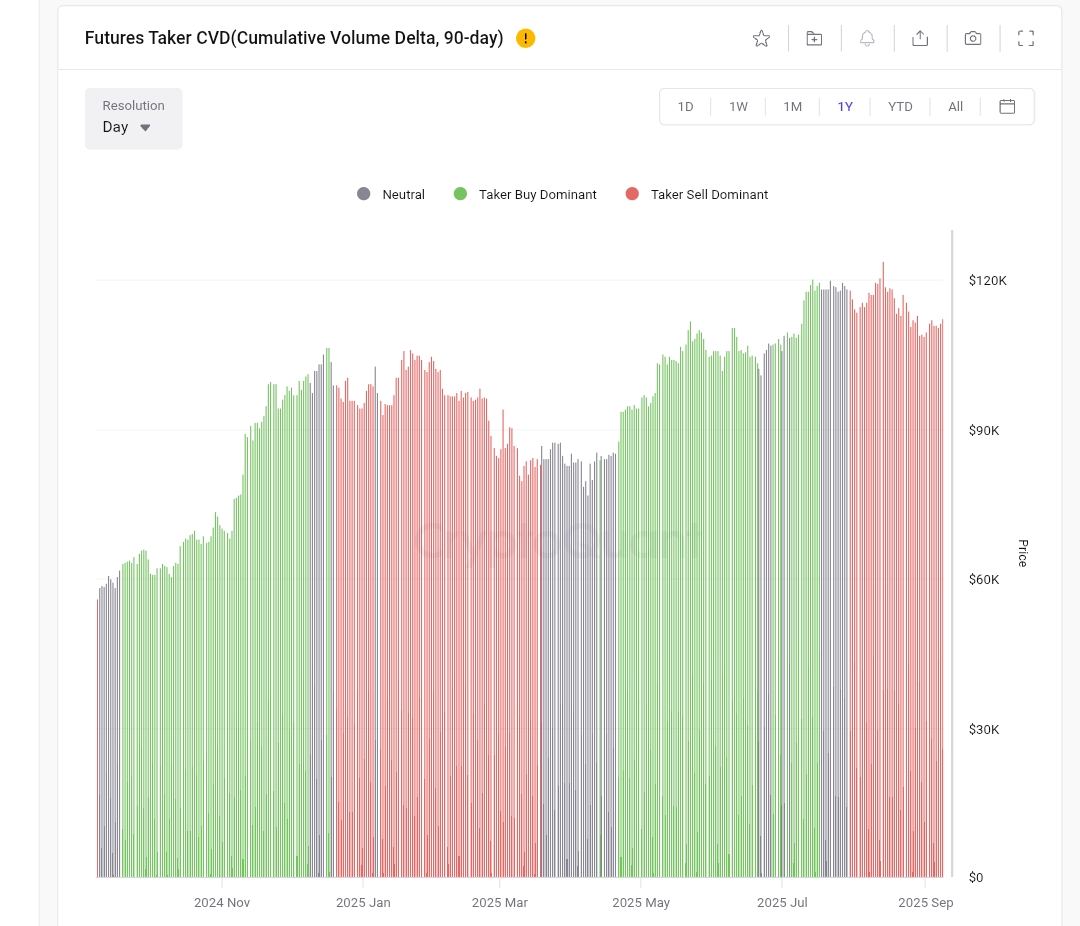
Between January and April 2025, red bars on the chart signaled that taker sell orders had taken over. There was a short-lived buyer revival in May-July, but since late July, sellers have again taken the upper hand despite Bitcoin price surging above $110K. This mismatch between price action and futures sentiment makes the current uptrend less convincing.
crypto.news reported earlier that whales have dumped 100,000 BTC in the past 30 days, further supporting the latest shift from a whale to a retail-led market. For now, market data shows that Bitcoin is trading at $112,952 at press time, slightly recovering after falling out of the $110,000 support zone.
Meanwhile, technical indicators are turning bullish. The MACD histogram has flipped green, and the MACD line is crossing above the signal line, indicating early bullish momentum. The RSI stands at 51.55, recovering from oversold territory, suggesting neutral-to-positive momentum.
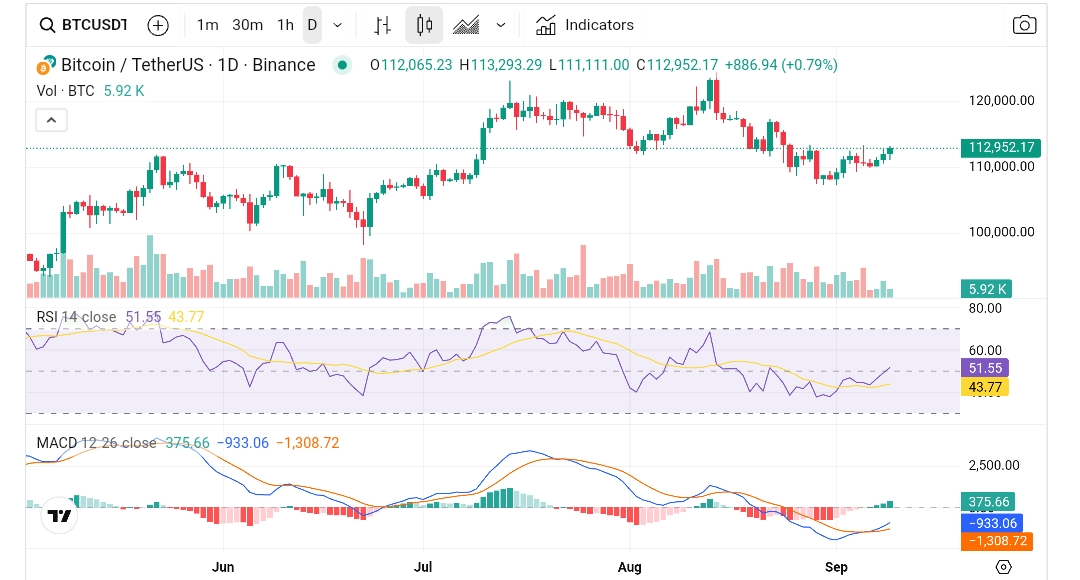
Nevertheless, the major resistance at $114,800 has to be overcome to allow BTC to test the $118,500 or even revisit the current high of $124,475. On the other hand, $110,000 and $107,500 are important support levels. A drop below might open Bitcoin to additional correction, possibly to as low as $103,000.
Although the current picture is optimistic, the declining futures market and whale involvement indicate that the continuation of a bullish trend will depend on new institutional demand. Without it, BTC may continue to trade sideways in the coming days.