Despite experiencing a significant plunge from ATH levels earlier last month, the Bitcoin price continues to test crucial levels that could shape the trajectory of its next move. A fresh analysis from crypto market expert Casitrades suggests that the coming days could define whether the broader market will face a macro correction or extend its bullish momentum. For now, Fibonacci zones, Elliott Wave structures, and Relative Strength Index (RSI) behaviour align to build a critical narrative around BTC’s price direction.
Possible Scenarios For Bitcoin Price Macro Correction
On Friday, Casitrades explained in an X social media post that Bitcoin’s recent price surge has tested the 0.5 Fibonacci retracement level around $116,000, an important milestone in the recovery phase. Interestingly, despite this sudden push higher, the RSI highlighted on the price chart is yet to show the exhaustion one would typically expect at a major top. This suggests buyers may still have room to drive prices further upward before hitting a ceiling.
Notably, the analyst pointed out $118,000 as the next critical level to watch, noting that it coincides with the 0.618 Fibonacci retracement and the 1.236 C-wave target within the developing Wave 2 structure. Casitrades has described this area as a decisive confluence point. A sharp rejection here could confirm that Bitcoin’s bull run has officially ended, reinforcing the theory that the cryptocurrency remains locked in a Wave 2 macro correction phase.
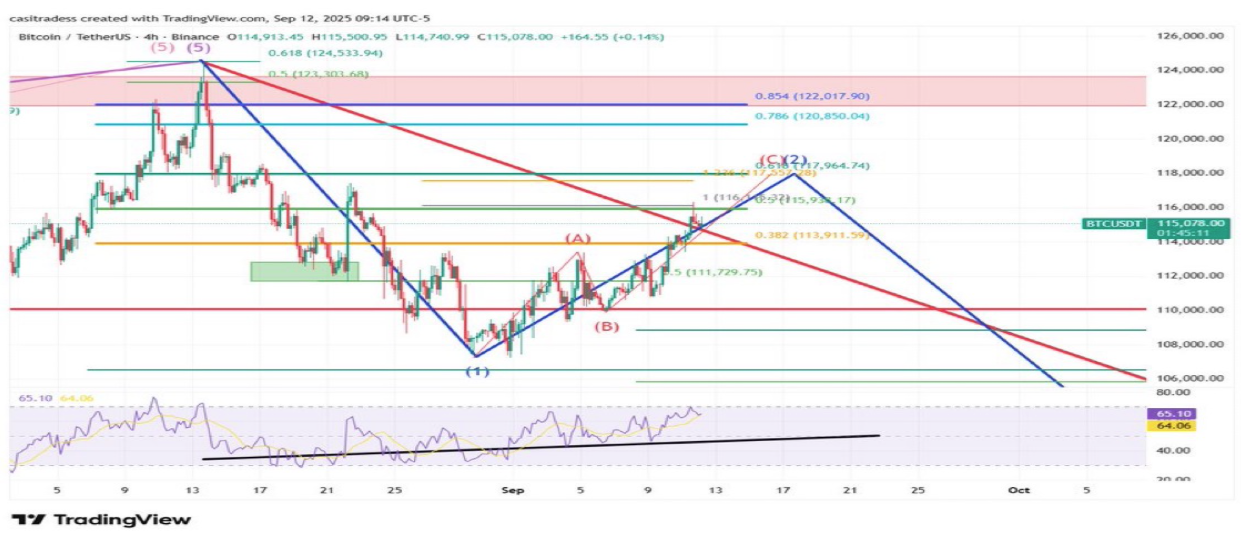
On the other hand, the analyst noted that forming a top around the decisive confluence point would confirm that BTC is not ready to challenge or break into new all-time highs and could instead retrace deeper. As the chart illustrates, potential downside targets lie well below Bitcoin’s current price levels above $115,800, hinting that a failure at $118,000 could lead to a steeper correction that might drag the cryptocurrency back into the $110,000 – $106,000 zone in the near term.
$122,000 Marks Final Test For Macro Correction
While $118,000 remains the first line of resistance for Bitcoin, Casitrades highlighted that the cryptocurrency could extend its rally higher into the $120,000 – $122,000 zone if momentum persists. This level is viewed as the final test that will decide whether the macro correction holds or fails. It aligns with the 0.786 Fibonacci retracement, making it an even more formidable resistance area.
The expectation is that if Bitcoin’s RSI shows signs of exhaustion and the cryptocurrency faces strong rejection in this region, the correction could be swift and significant. In this scenario, Bitcoin would set up for a macro downturn, confirming the theory that the rally from recent lows has merely been a corrective leg.
The projected correction could then reset the broader structure, allowing for healthier long-term price action. However, if Bitcoin manages to break through $122,000 convincingly, Casitrades notes that it would invalidate the macro correction narrative altogether and potentially send it to price levels between $122,000 – $124,000.
Featured image from Unsplash, chart from TradingView