Bitcoin traded at $115,051 as of Sept. 15, 2025, with a market capitalization of $2.29 trillion. The 24-hour trading volume reached $39.26 billion, with an intraday price range spanning from $114,790 to $116,689, reflecting tight consolidation amid uncertain market direction.
Bitcoin
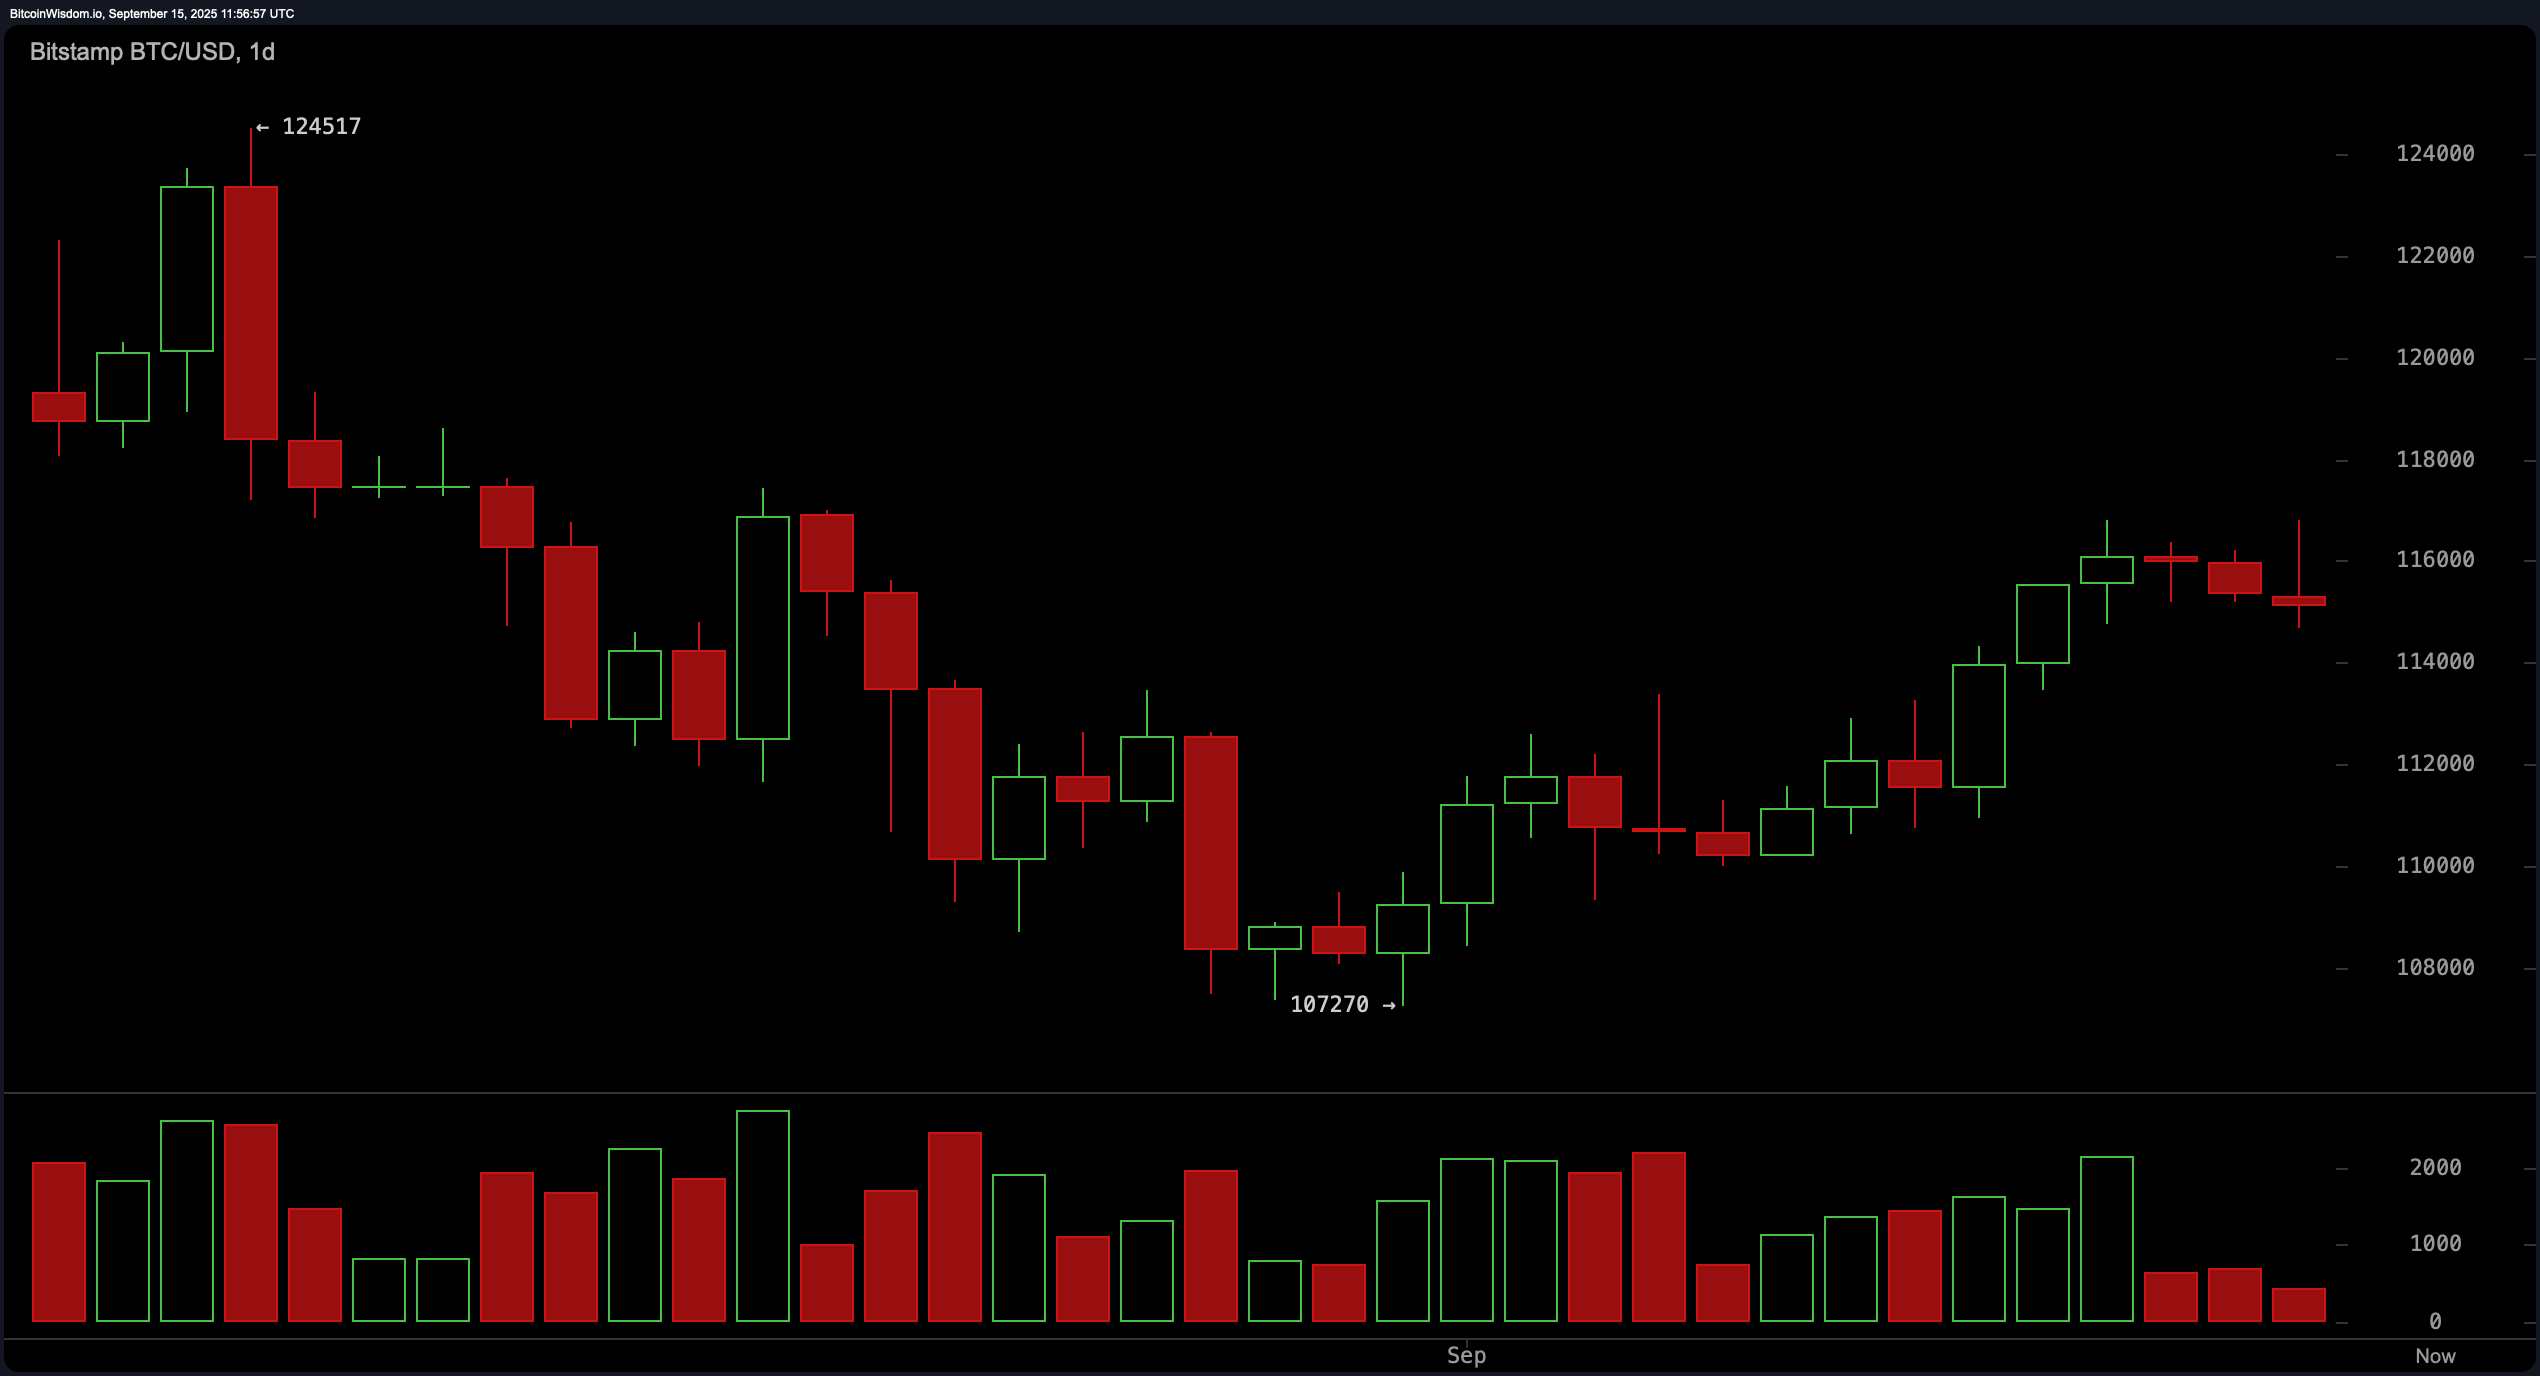
On the daily chart, bitcoin remains in a recovery phase following a strong pullback from its previous peak of $124,517. The structure reveals a series of higher lows and higher highs, indicating an emerging short-term uptrend. A key support level has formed between $112,000 and $113,000, where buyers have previously stepped in. Momentum, however, appears to be stalling near the $116,000 resistance zone, as evidenced by the presence of small-bodied candles and weaker bullish conviction. A daily close above $117,000 would likely trigger a push toward the $120,000 level, but any breakdown below $110,000 could invalidate the bullish structure.
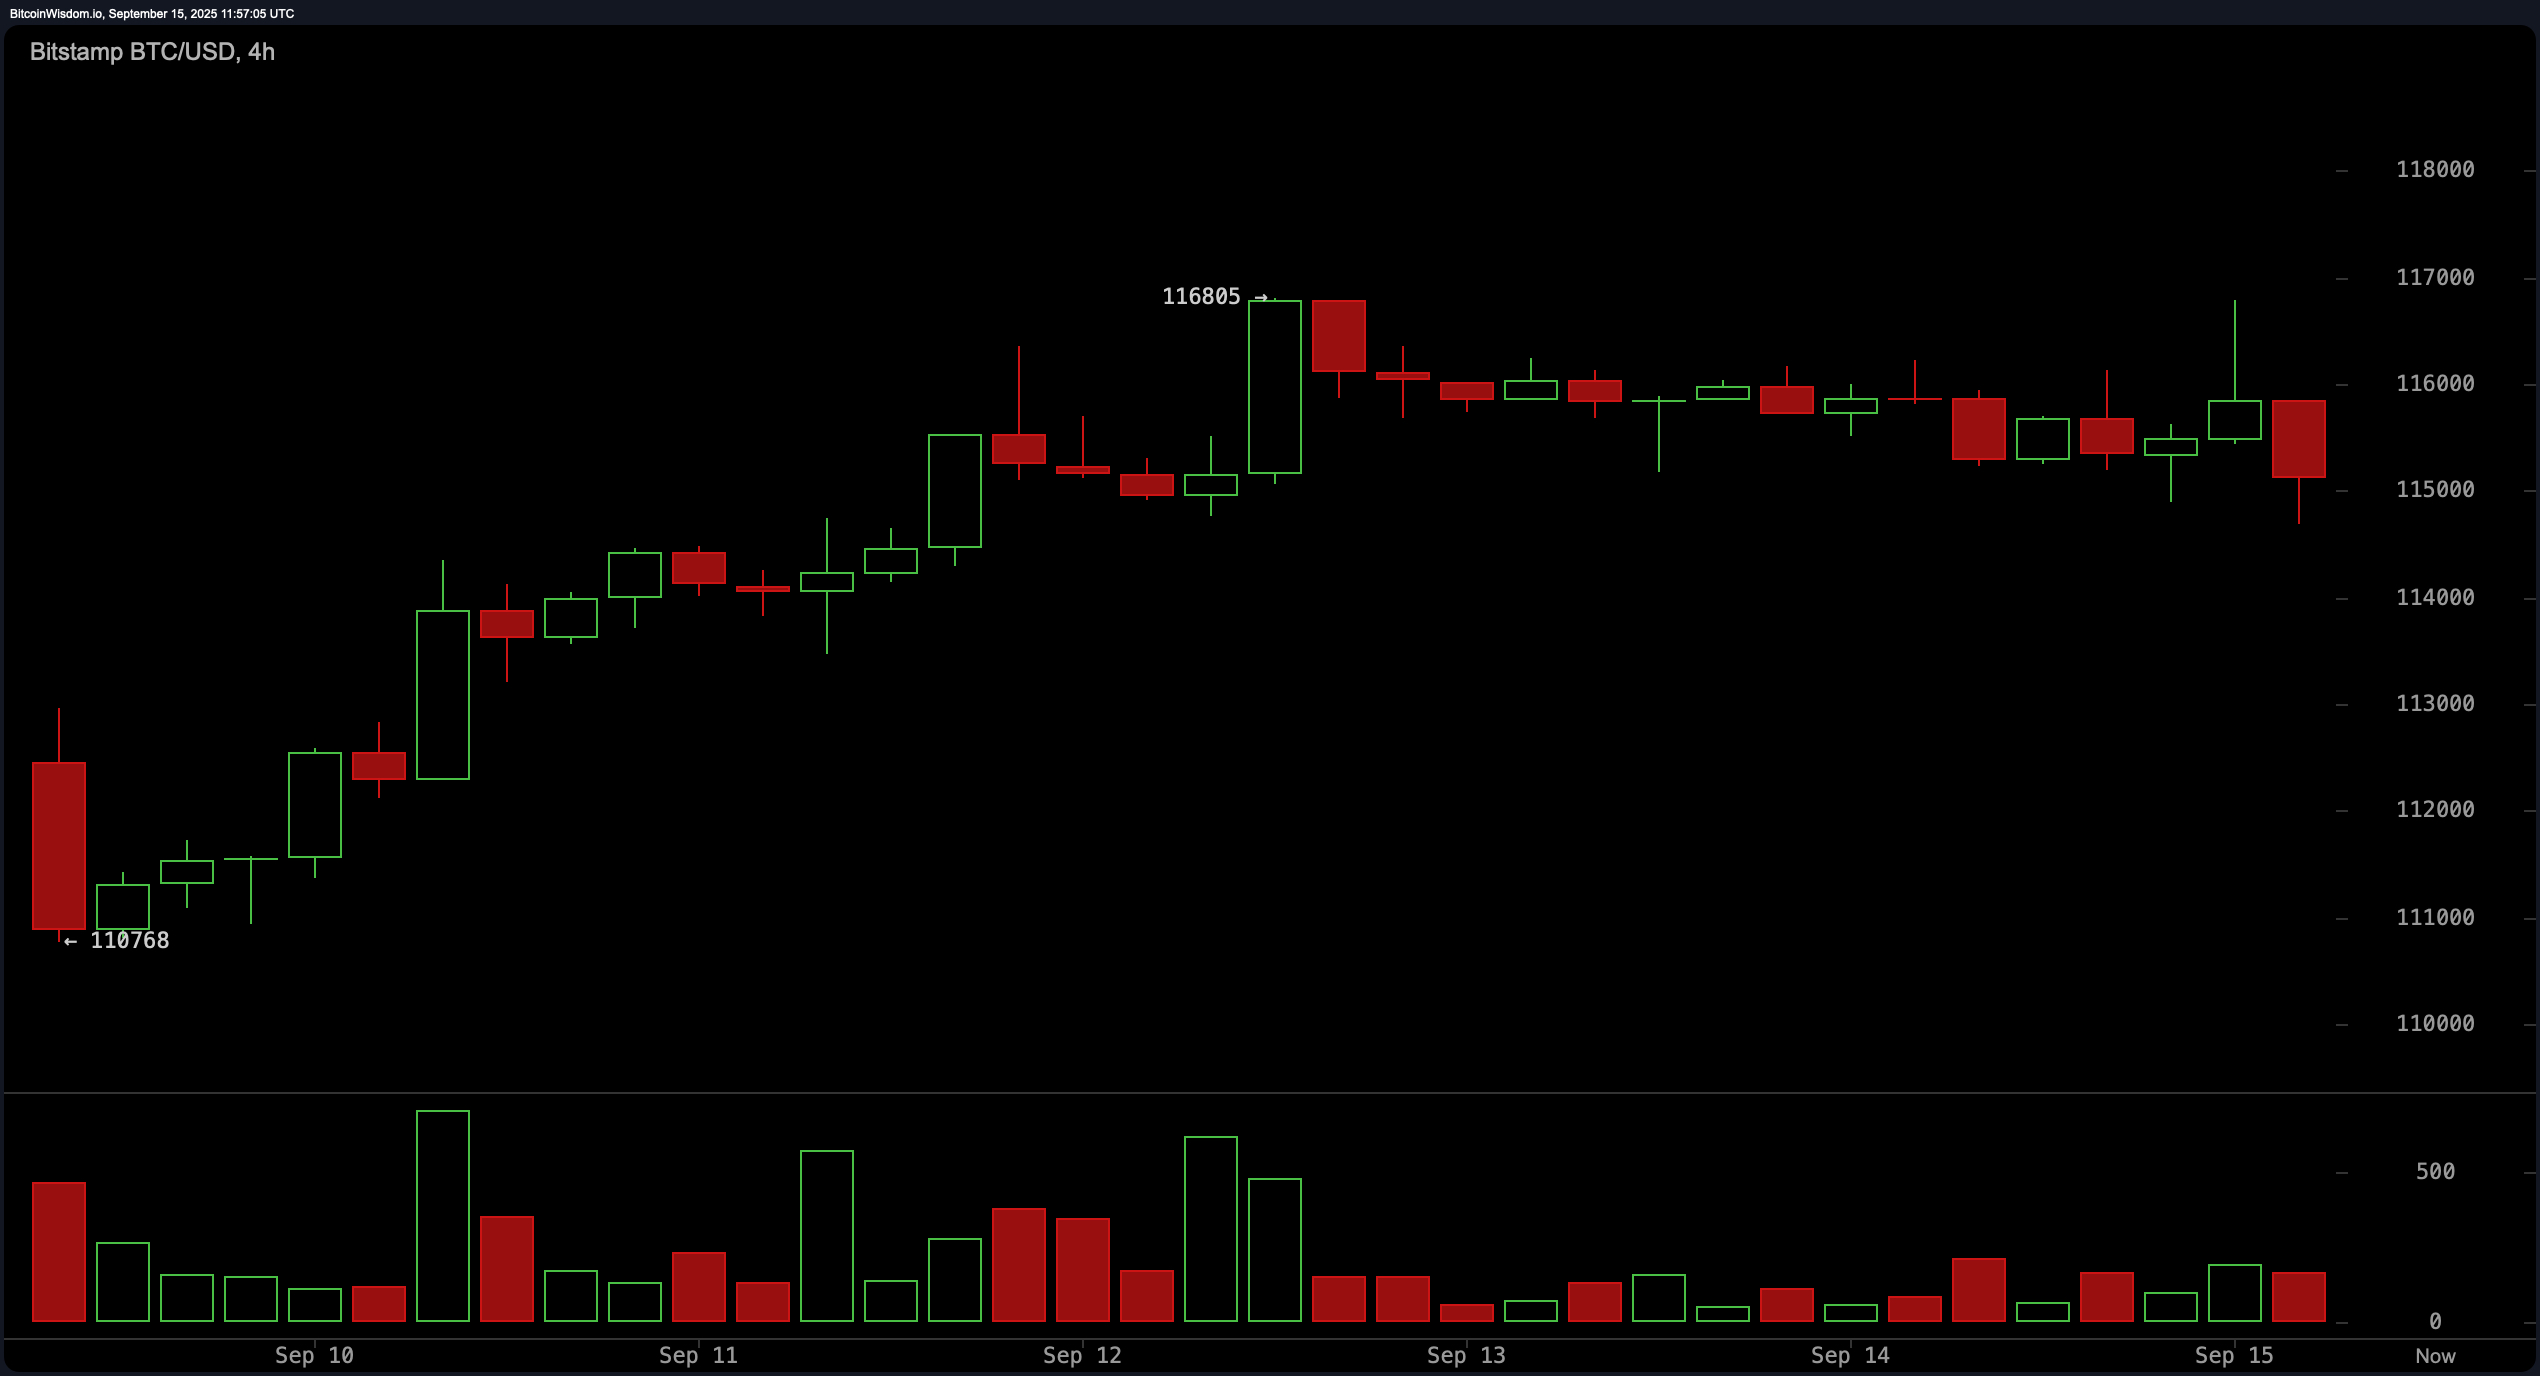
The 4-hour chart illustrates a period of sideways consolidation, with bitcoin trading within a compressed range from $110,768 to $116,805. The lack of significant volume suggests that the market is awaiting a catalyst to break out of this holding pattern. The formation of a flat top near resistance levels supports the possibility of a bullish continuation, provided the price can break above $116,800 on increased volume. Until then, traders are advised to exercise caution, watching for a confirmed breakout or a retracement to the $114,000 zone with support confirmation. A strong resistance remains around $117,500 to $118,000, which could limit upside potential in the near term.
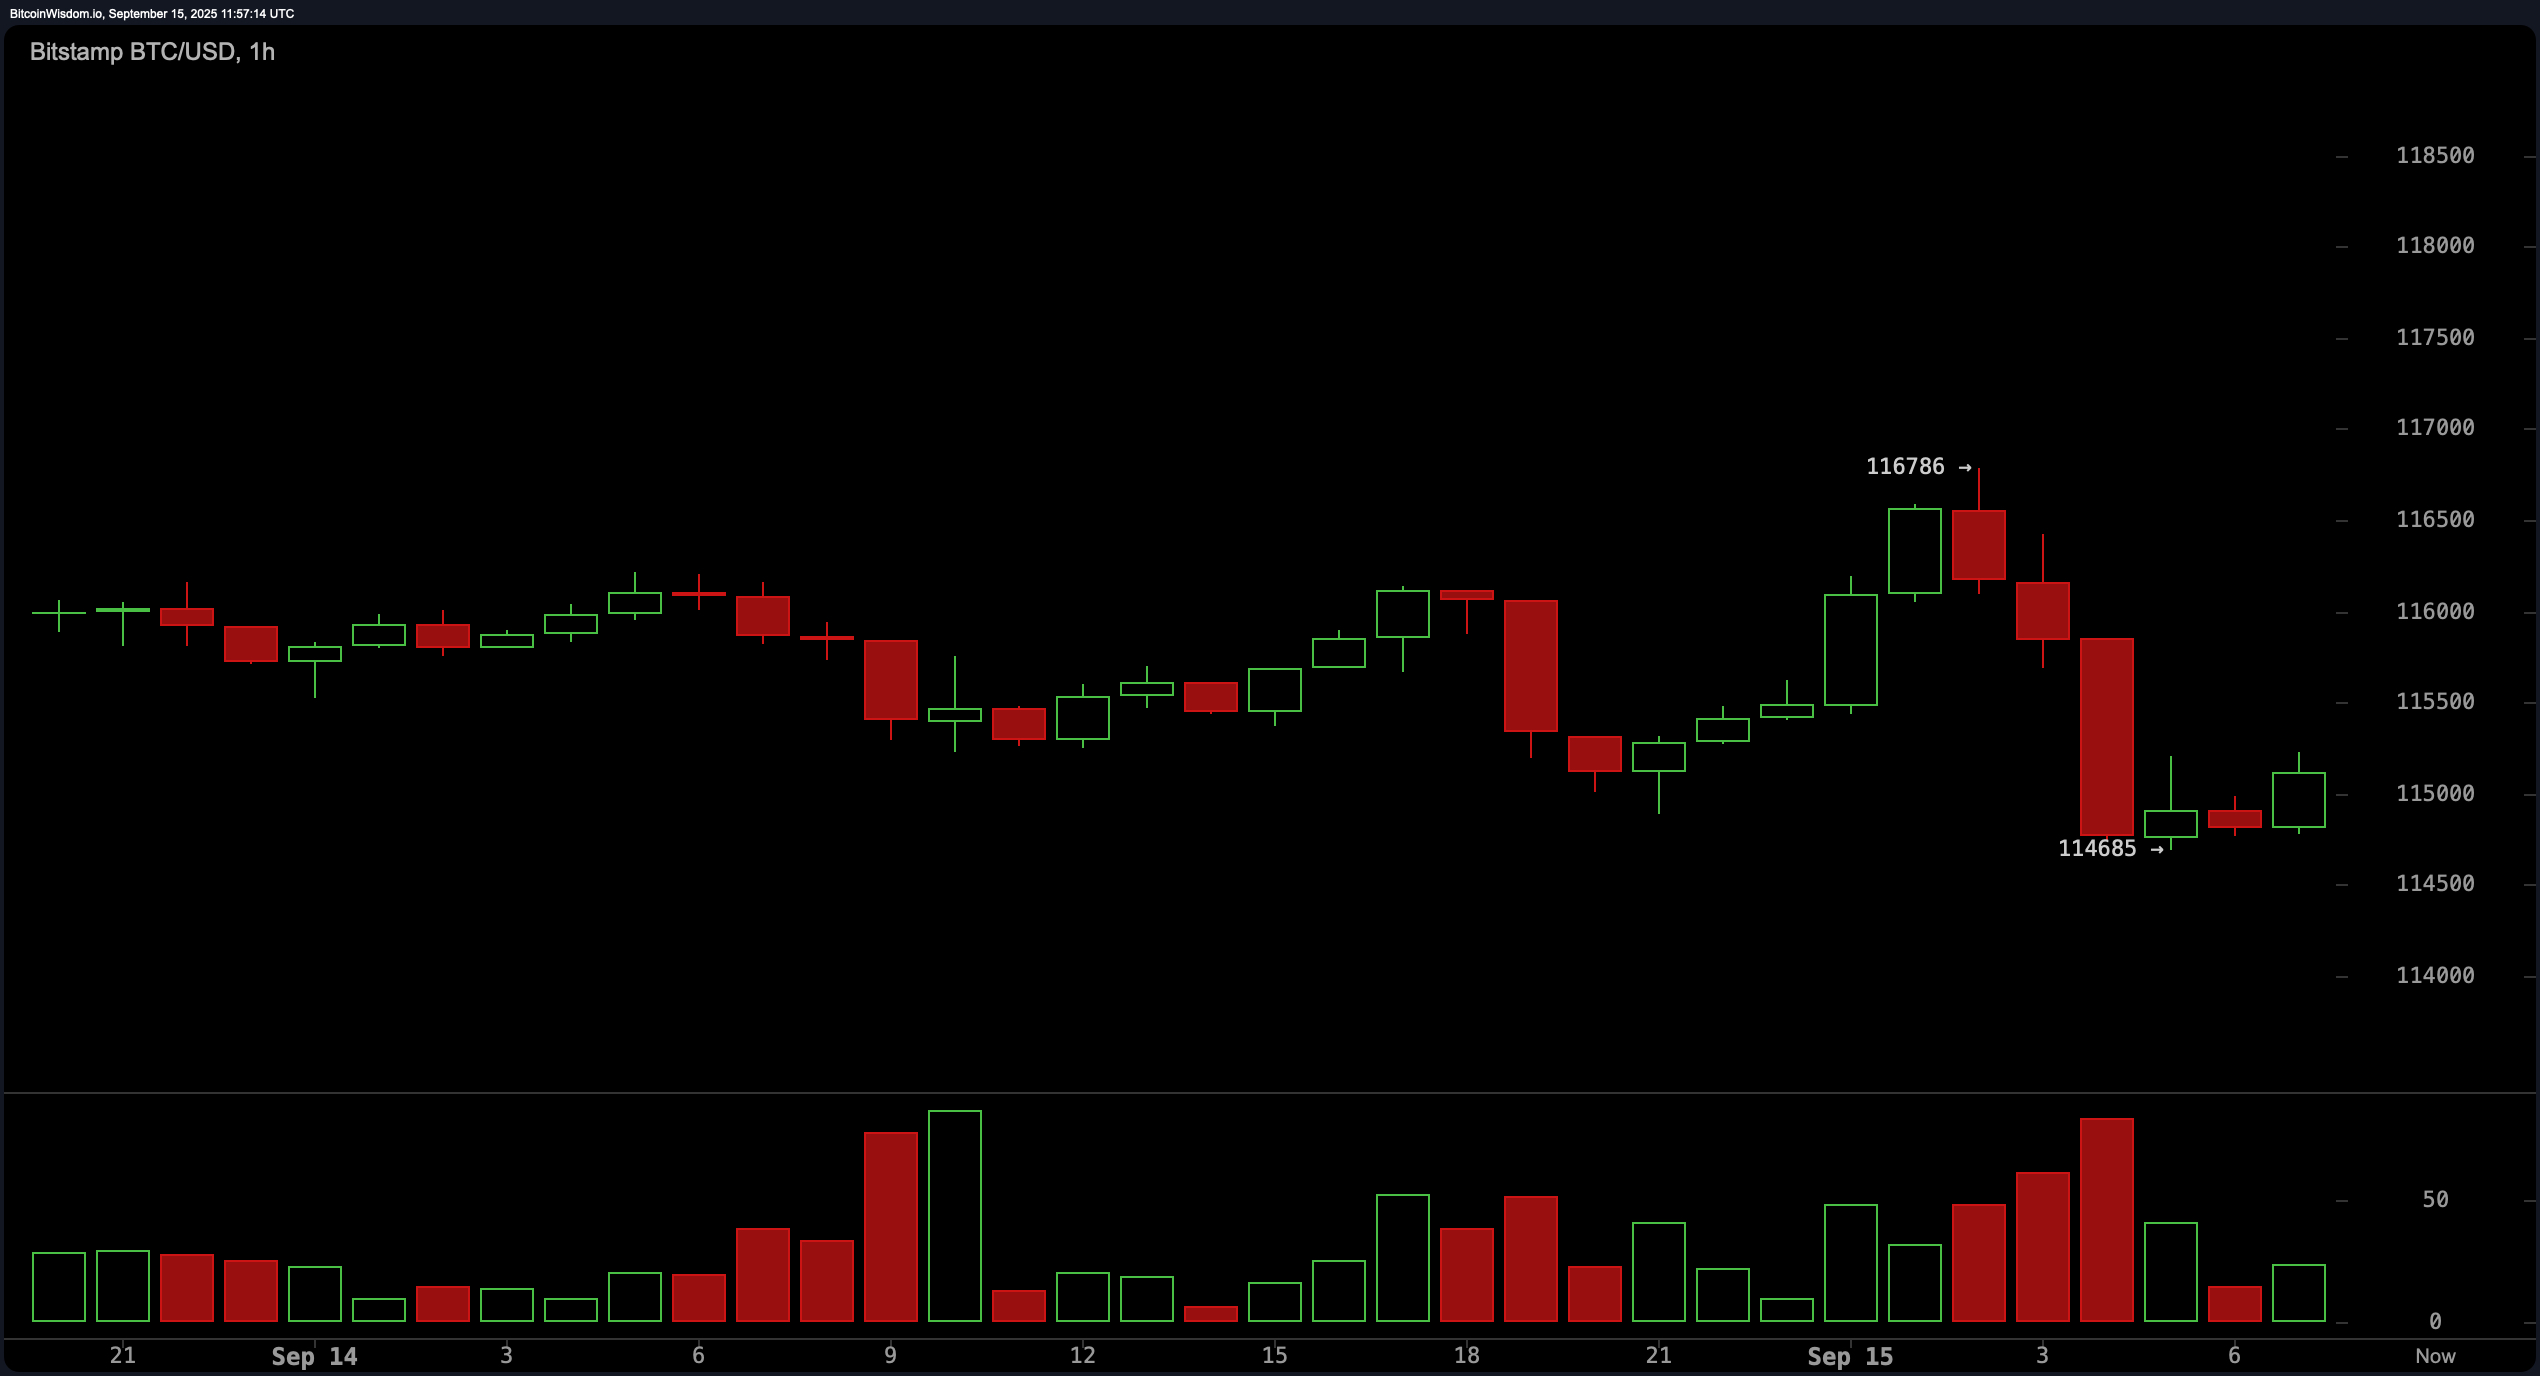
From the 1-hour chart, a bearish short-term pattern has emerged following a rejection near $116,700, where a bearish engulfing candle pushed the price down to $114,600. Price action shows difficulty in reclaiming the $115,500 level, pointing to short-term selling pressure. The formation resembles a mini double top, increasing the likelihood of continued downside unless reclaimed. Intraday traders should monitor the $114,500 level; a break below this support with volume could drive price down toward $113,000, while a decisive move above $115,500 may present a brief opportunity to target $116,200.
Oscillator indicators paint a mixed technical outlook. The relative strength index (RSI) reads 56, suggesting neutral momentum, while the Stochastic oscillator sits at 85, also in neutral territory. The commodity channel index (CCI) at 123 signals a negative condition, and the momentum indicator at 4,480 supports that view. Conversely, the moving average convergence divergence (MACD) level of 443 indicates a bullish signal, adding further ambiguity to short-term sentiment. Meanwhile, the average directional index (ADX) at 18 confirms the absence of a strong trend.
Moving averages offer a clearer bullish bias, with all key short- and long-term averages aligning above current price levels. The exponential moving averages (EMAs) for the 10, 20, 30, 50, 100, and 200 periods all signal bullish conditions, ranging from $114,133 to $105,287. Similarly, simple moving averages (SMAs) across those timeframes also indicate positive signals, with the 200-period SMA at $102,658 providing a strong foundational support level. The alignment of these moving averages beneath current prices supports the case for continued bullish pressure, assuming no breakdown occurs below the key $110,000 threshold.
Bull Verdict:
Bitcoin remains structurally bullish across higher timeframes, with all key moving averages aligning in support of further upside. A sustained break above the $116,800 resistance zone could pave the way for a push toward the $120,000 level, especially if volume confirms the move. Until a breakdown below $110,000 occurs, the bias remains tilted toward continuation of the short-term uptrend.
Bear Verdict:
Despite the broader bullish structure, short-term weakness on lower timeframes and mixed oscillator signals suggest caution. Failure to reclaim $115,500 and a decisive breakdown below $114,500 could accelerate downside momentum toward $113,000 or lower. A breach beneath $110,000 would likely invalidate the current recovery trend and reintroduce a bearish outlook.