Bitcoin’s price is quickly recovering and paving its way toward a new all-time high after the Federal Reserve cuts interest rates by a quarter point and signals there are still more to come in the upcoming year. Therefore, investors’ fears are alleviated, and the market is likely to rally further in the coming weeks.
By Shayan
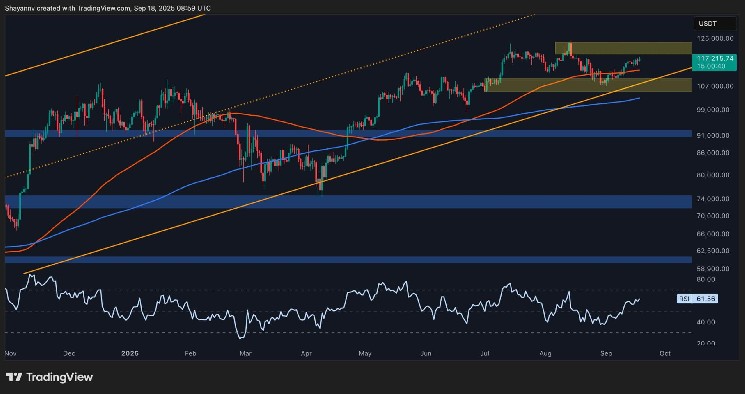
The Daily Chart
Bitcoin’s daily chart demonstrates a clear bounce from the $107K demand zone and a rise back above the 100-day moving average, located around the $113K mark. After yesterday’s Fed rate cut, the asset is continuing its path toward the $124K supply zone, which aligns with the current BTC all-time high.
The RSI is also trending above the 50% level, indicating that the momentum has now shifted bullish once again. All these signals point to a potential continuation toward the $124K ATH and likely a further rally toward $130K and even higher.
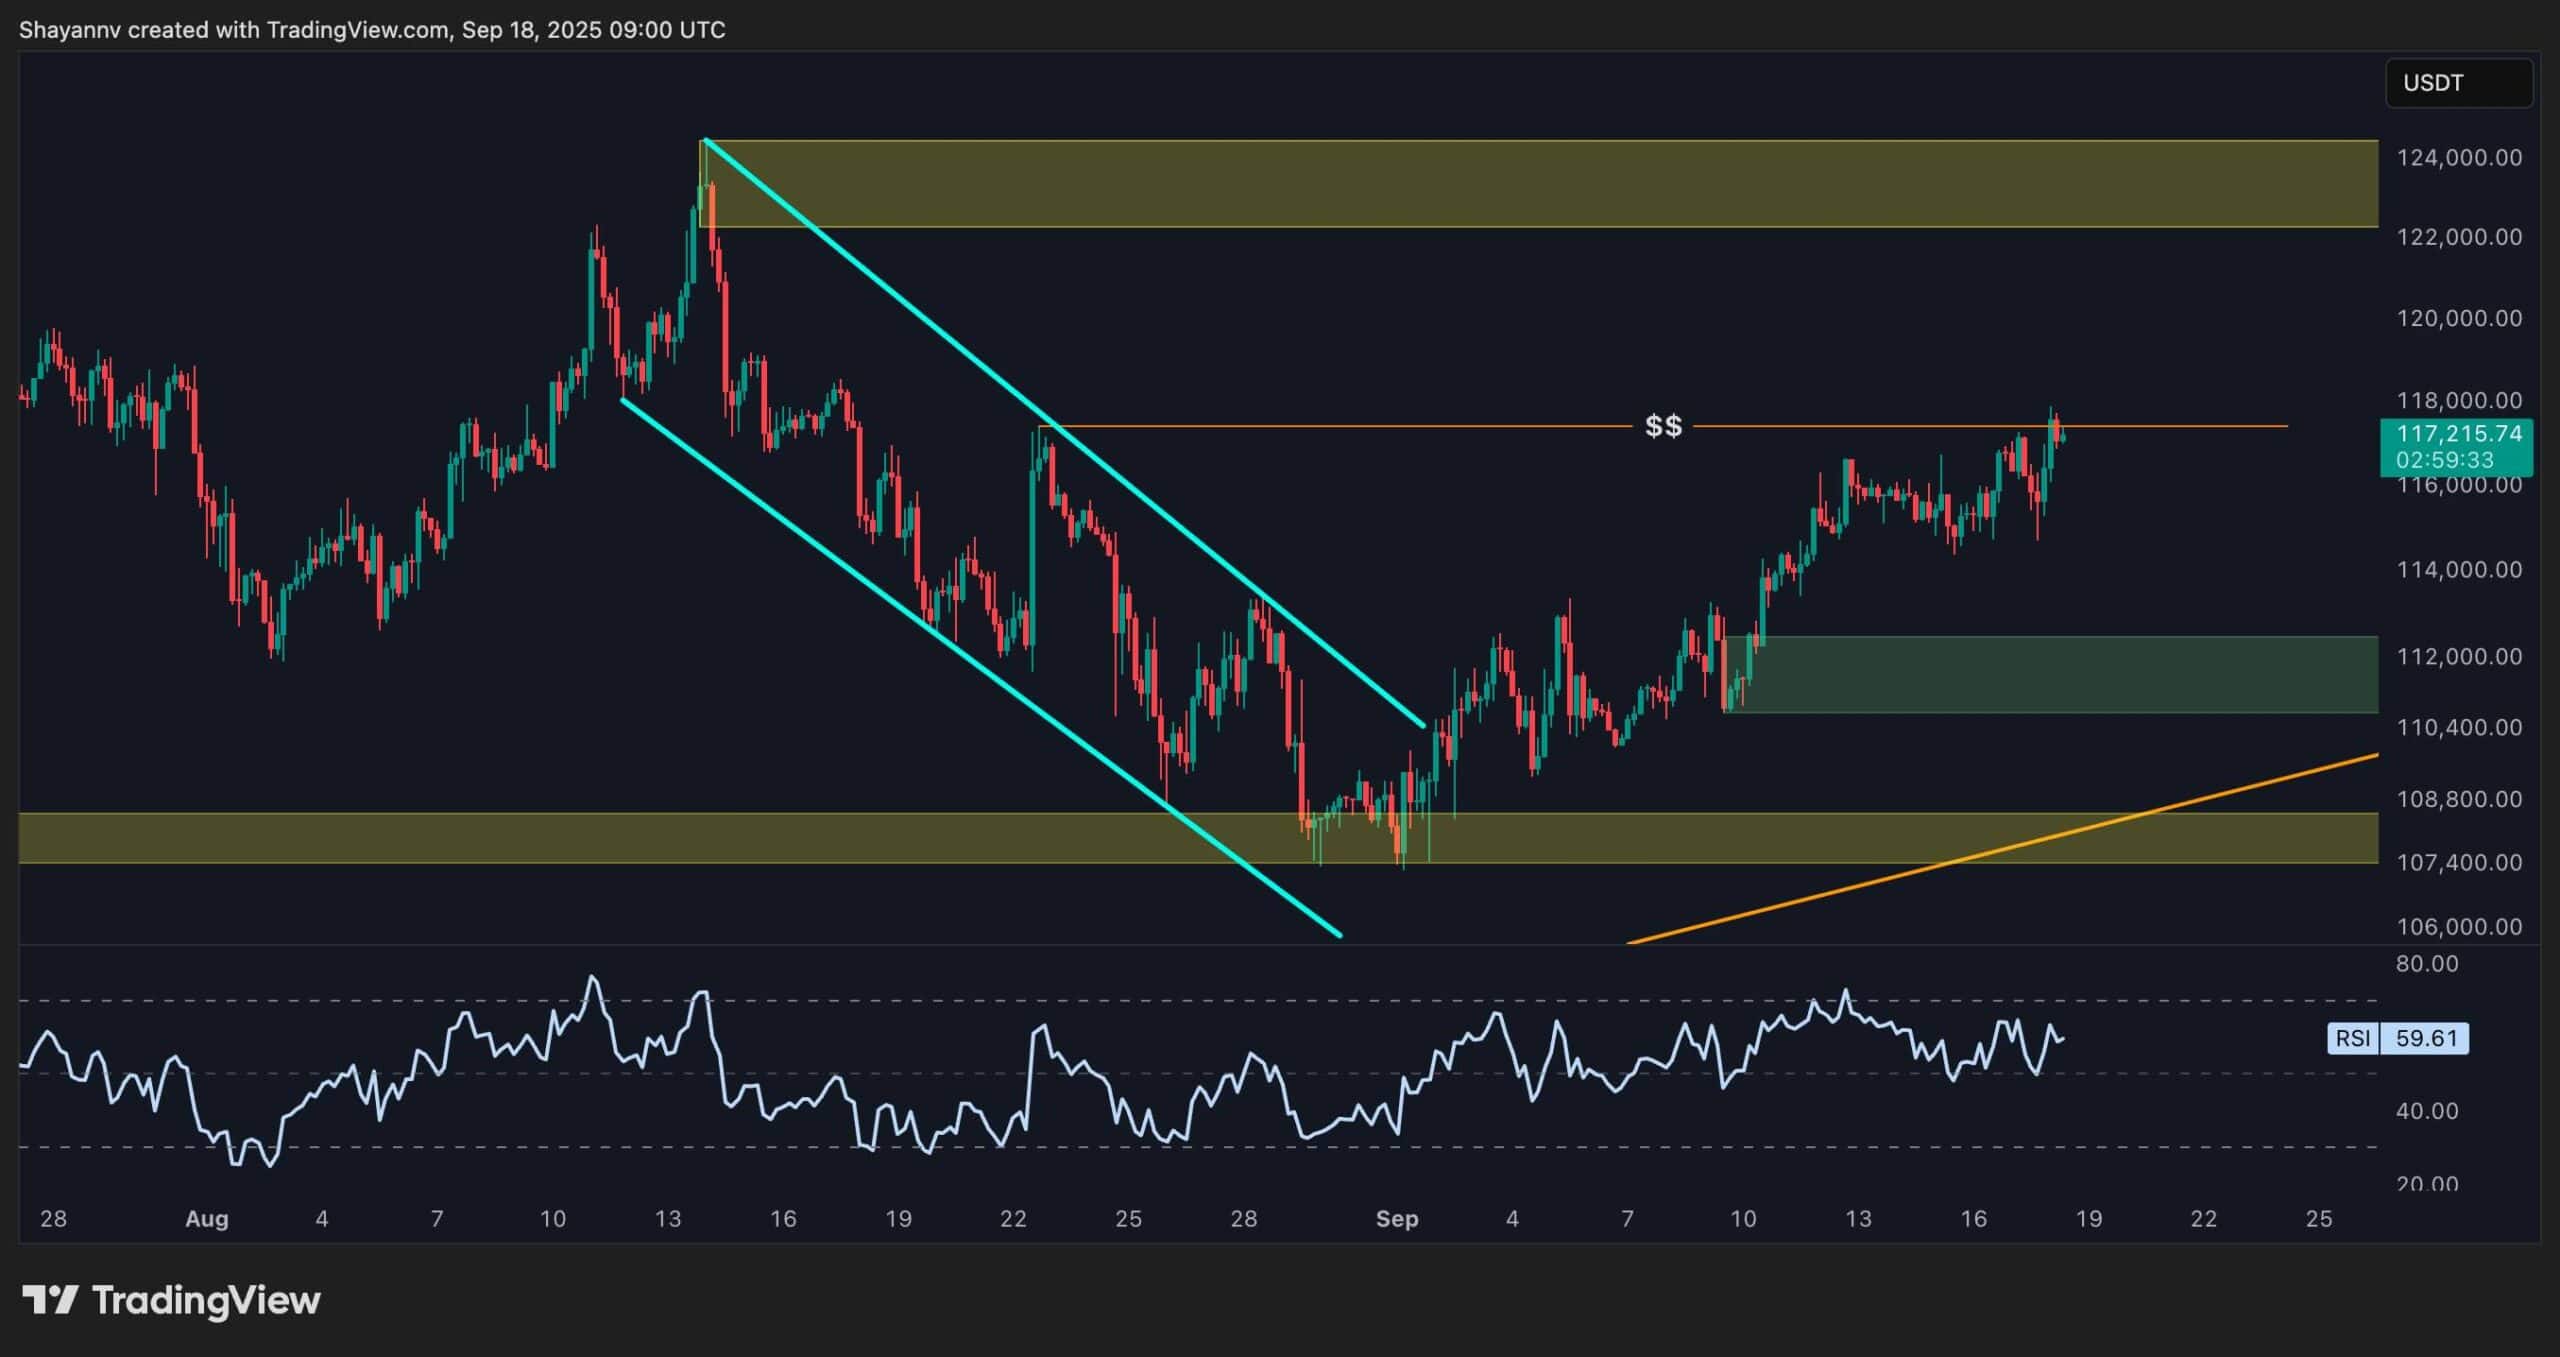
The 4-Hour Chart
As the 4-hour chart demonstrates, Bitcoin’s recent rally has occurred after the price successfully broke out of a descending channel, following a swift double bottom rebound at the $108K supply zone.
The asset has now swept the liquidity pool above the previous $107K high, which can lead to two possible scenarios. The market can either carry on with the uptrend and attack the $124K area once again, or it can pull back at least to the $112K order block, which is the most notable demand zone nearby. Yet, with the RSI still below the overbought region, the price seemingly has more room to grow before a correction occurs.
Sentiment Analysis
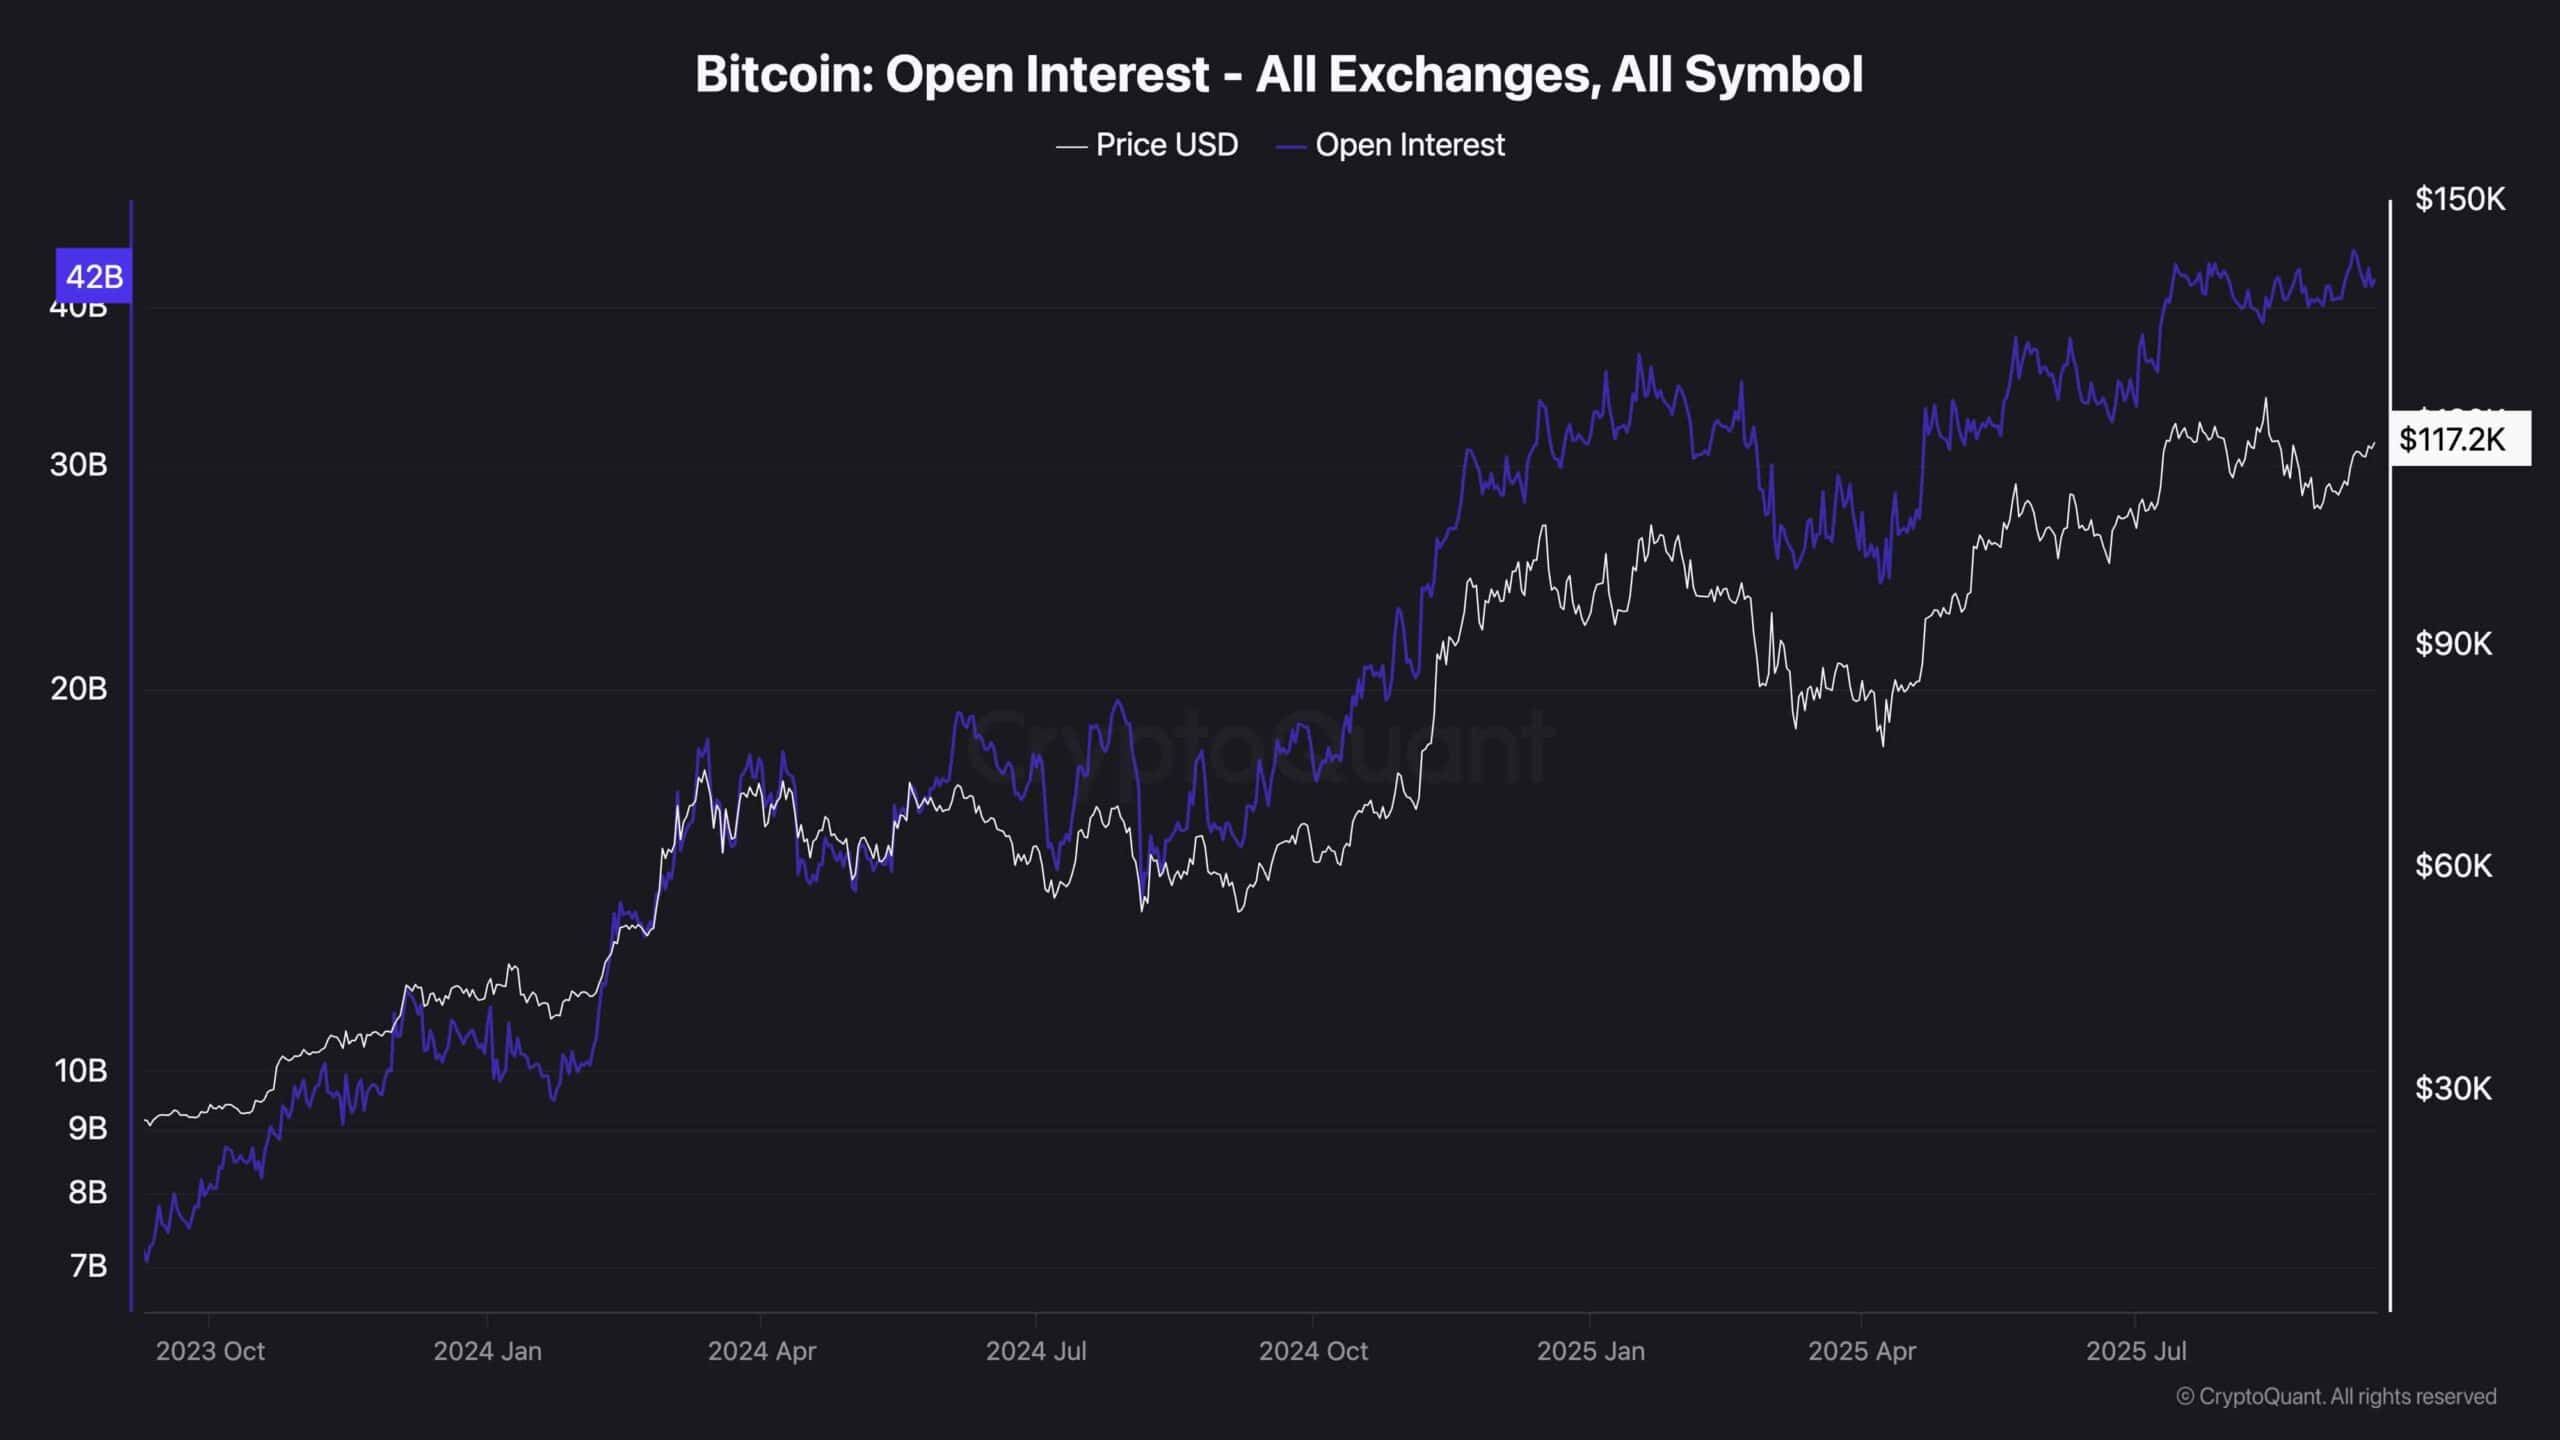
Open Interest
This chart displays the Bitcoin aggregate open interest, which shows the number of open perpetual futures positions. Typically, during bullish market conditions, this metric climbs higher or consolidates, as more and more traders are taking leveraged positions. This is exactly what can be seen on the chart.
Meanwhile, another interesting observation is that even with the market going through a short-term correction a few weeks ago, the open interest has yet to drop. While this is generally a bullish sign, it also points to the fact that the futures market might still be overheated. Therefore, there is still the probability for a liquidation cascade to happen in the short term, which could cause a flash crash before the market stabilizes again.