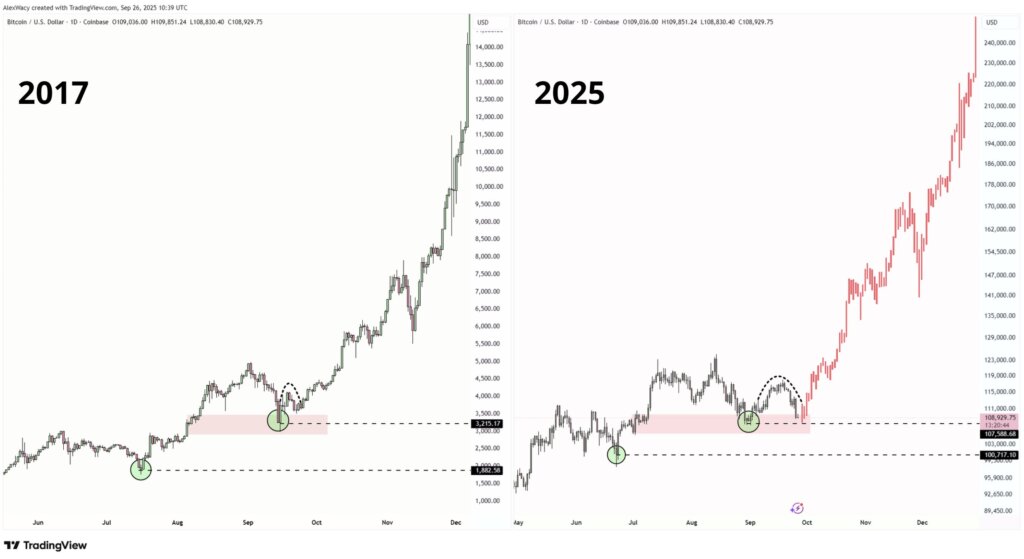
Bitcoin’s spot price movement throughout the third quarter of 2025 and its recent dip align closely with the cycle structure seen in 2017.
Throughout the summer, Bitcoin oscillated in a consolidation range between $100,000 and $115,000, forming a technical base at $107,000 while market momentum mirrored the 2017 correction and subsequent rally.
Bitcoin has held above major support with spot action repeatedly retesting levels mapped by historical cycles.
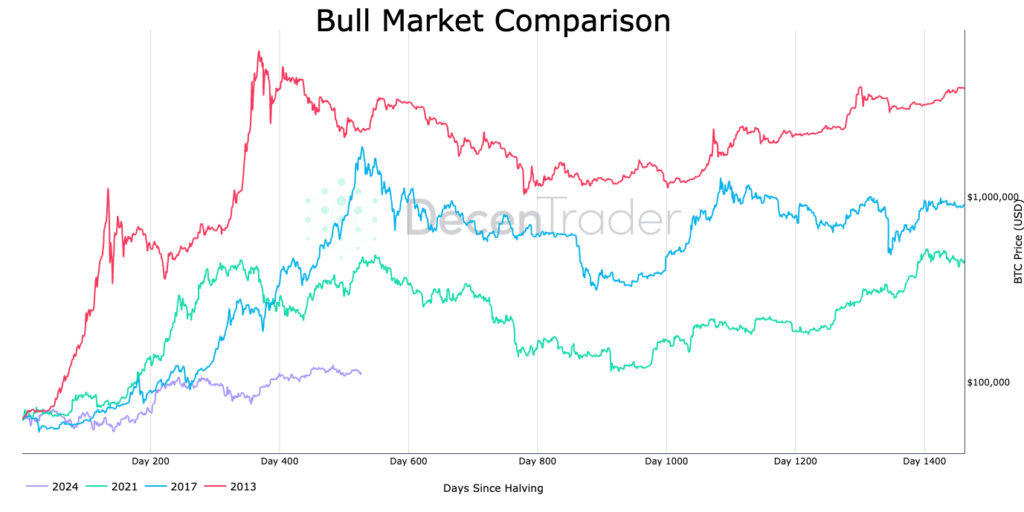
Alternative cycle analyses point to a projected upside scenario into Q4, with cycle correlations exceeding 90% as price enters the latter stages of historic market structure repeats.
2025 landscape materially differs from 2017
However, market context in 2025 diverges materially from 2017, given institutional inflows through spot ETFs, public company treasuries, and regulatory adjustments following global banking and macroeconomic shifts.
Exchange flow volume, ETF net flows, and dollar liquidity collectively shape cycle inflection, diverging from prior cycles dominated by retail orderbooks.
As cycle overlays suggest, Bitcoin’s path toward the projected $200,000 price channel is contingent on maintaining technical support and catalyzing fresh capital inflow.
From a technical perspective, weekly MACD and daily RSI trends reflect a neutral to mildly constructive technical posture. The consolidation under $115,000 maps to previous market troughs, while waning RSI and modest MACD crossovers indicate a shift in speculative positioning as open interest flattened through mid-September.
Churn increased as volatility reset, but the market retained its structure, with price bouncing off the $107,000 threshold multiple times.
Surge potential remains attached to breaking above the $115,000 resistance, as technical modeling aligns with multi-cycle fractal overlays from 2015-2017 and 2021-2025.
Still, unlike 2017, institutional dynamics and global monetary policy developments shape the market structure as Q4 approaches.
Macro-tracking sources note that persistent dollar strength, changing US Federal Reserve policy, and global demand for duration assets remain influential for spot price direction.
ETF product flow fades have exerted temporary pressure, adding nuance to cycle analogs. Risk remains, as observed in the case where $107,000 fails to retain support, resulting in broader deleveraging and potential price slippage below technical base, which would prompt a realignment of short and long positions across major exchanges.
How Bitcoin could replicate 2017 rally
Forward projections modeled by price-cycle researchers offer upside channels derived from fractal repetition and market structure overlays. If price sustains closing action above $115,000 during early Q4, a parabolic rise is possible.
As historical correlations persist, technical modeling points to a blow-off phase reminiscent of 2017. Real-time price modeling and cycle overlays indicate further price extension beyond previous cycle highs if macro conditions and flows stabilize.
Cycle inflection zones act as catalysts that sustain upside, but caution remains warranted as persistent macro volatility and policy intervention could recalibrate the projected path.
The prevailing structure observed on multi-year overlays demonstrates a continuing alignment with the market’s historical rhythm, underlying each pattern.
Bitcoin price action follows a familiar cadence, positioning the asset for a potential cycle extension into new highs if conditions outlined above hold.
| Year | Cycle Correlation | Technical Structure | Main Support Level | Upside Channel |
|---|---|---|---|---|
| 2017 | Strong, retail-driven | Correction, parabolic Q4 break | $3,215 | $20,000 |
| 2025 | High, institutional macro factors | Consolidation, neutral momentum | $107,000 | $200,000 |
If current technical and macro conditions persist, final forward-looking projections suggest Bitcoin remains poised to track the upper boundaries of its historical cycle, with the opportunity for cycle expansion above prior highs if sustained capital inflows materialize through ETFs and institutional treasuries.
Spot price action will determine whether the red line scenario materializes, should technical, policy, and liquidity factors remain supportive, cycle continuation beyond prior limits remains a viable possibility, closing the quarter with Bitcoin once again positioned at the center of global financial conversation.