On Oct. 2, 2025, bitcoin extended its upward trajectory with price action reflecting strong bullish momentum across multiple timeframes. Market structure and indicators from the 1-hour, 4-hour, and daily charts reveal sustained strength, with several technical setups hinting at further upside potential following recent breakouts and consolidations.
Bitcoin Chart Outlook and Price Prediction
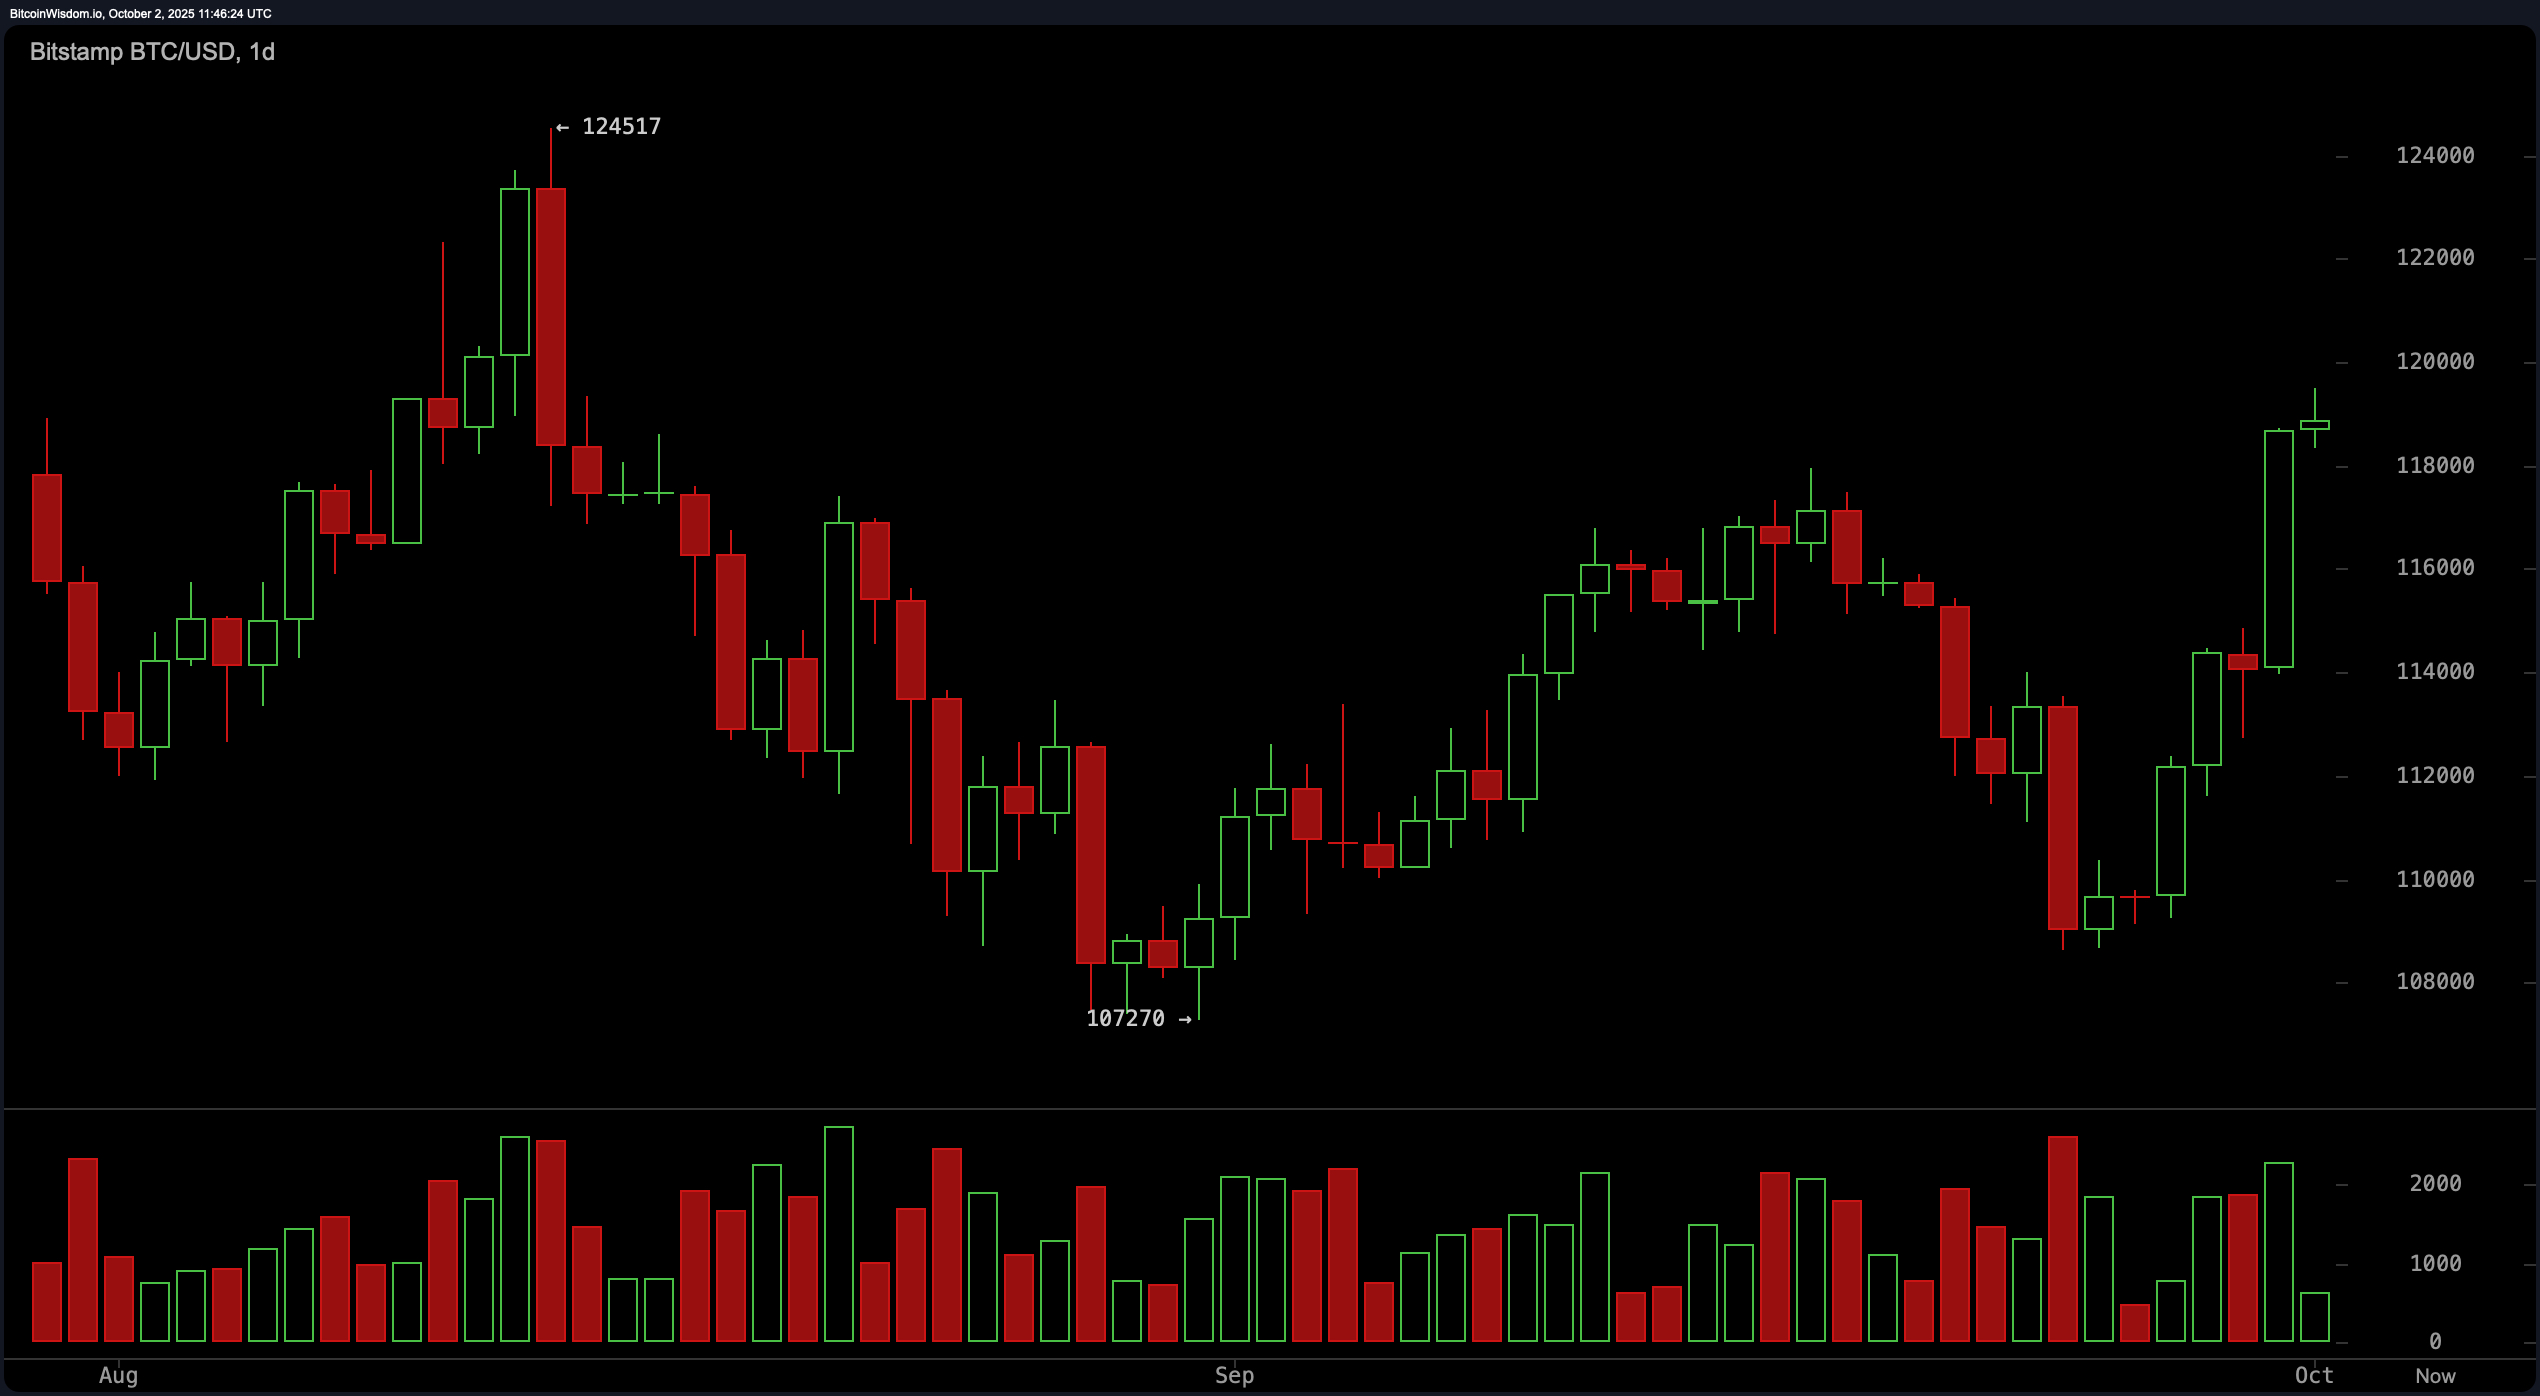
On the daily chart, bitcoin broke decisively above a mini-consolidation zone around $114,000–$116,000, signaling a bullish trend continuation. A strong green candle forming between October 1 and 2, coupled with increasing trading volume, suggests institutional participation or large-scale accumulation.
The market’s ability to reclaim levels above $118,000 after a downtrend throughout September solidifies the trend reversal. A potential pullback toward the $116,500–$117,500 zone may offer a favorable long entry point, while resistance is anticipated near the psychological barrier at $124,000–$125,000.
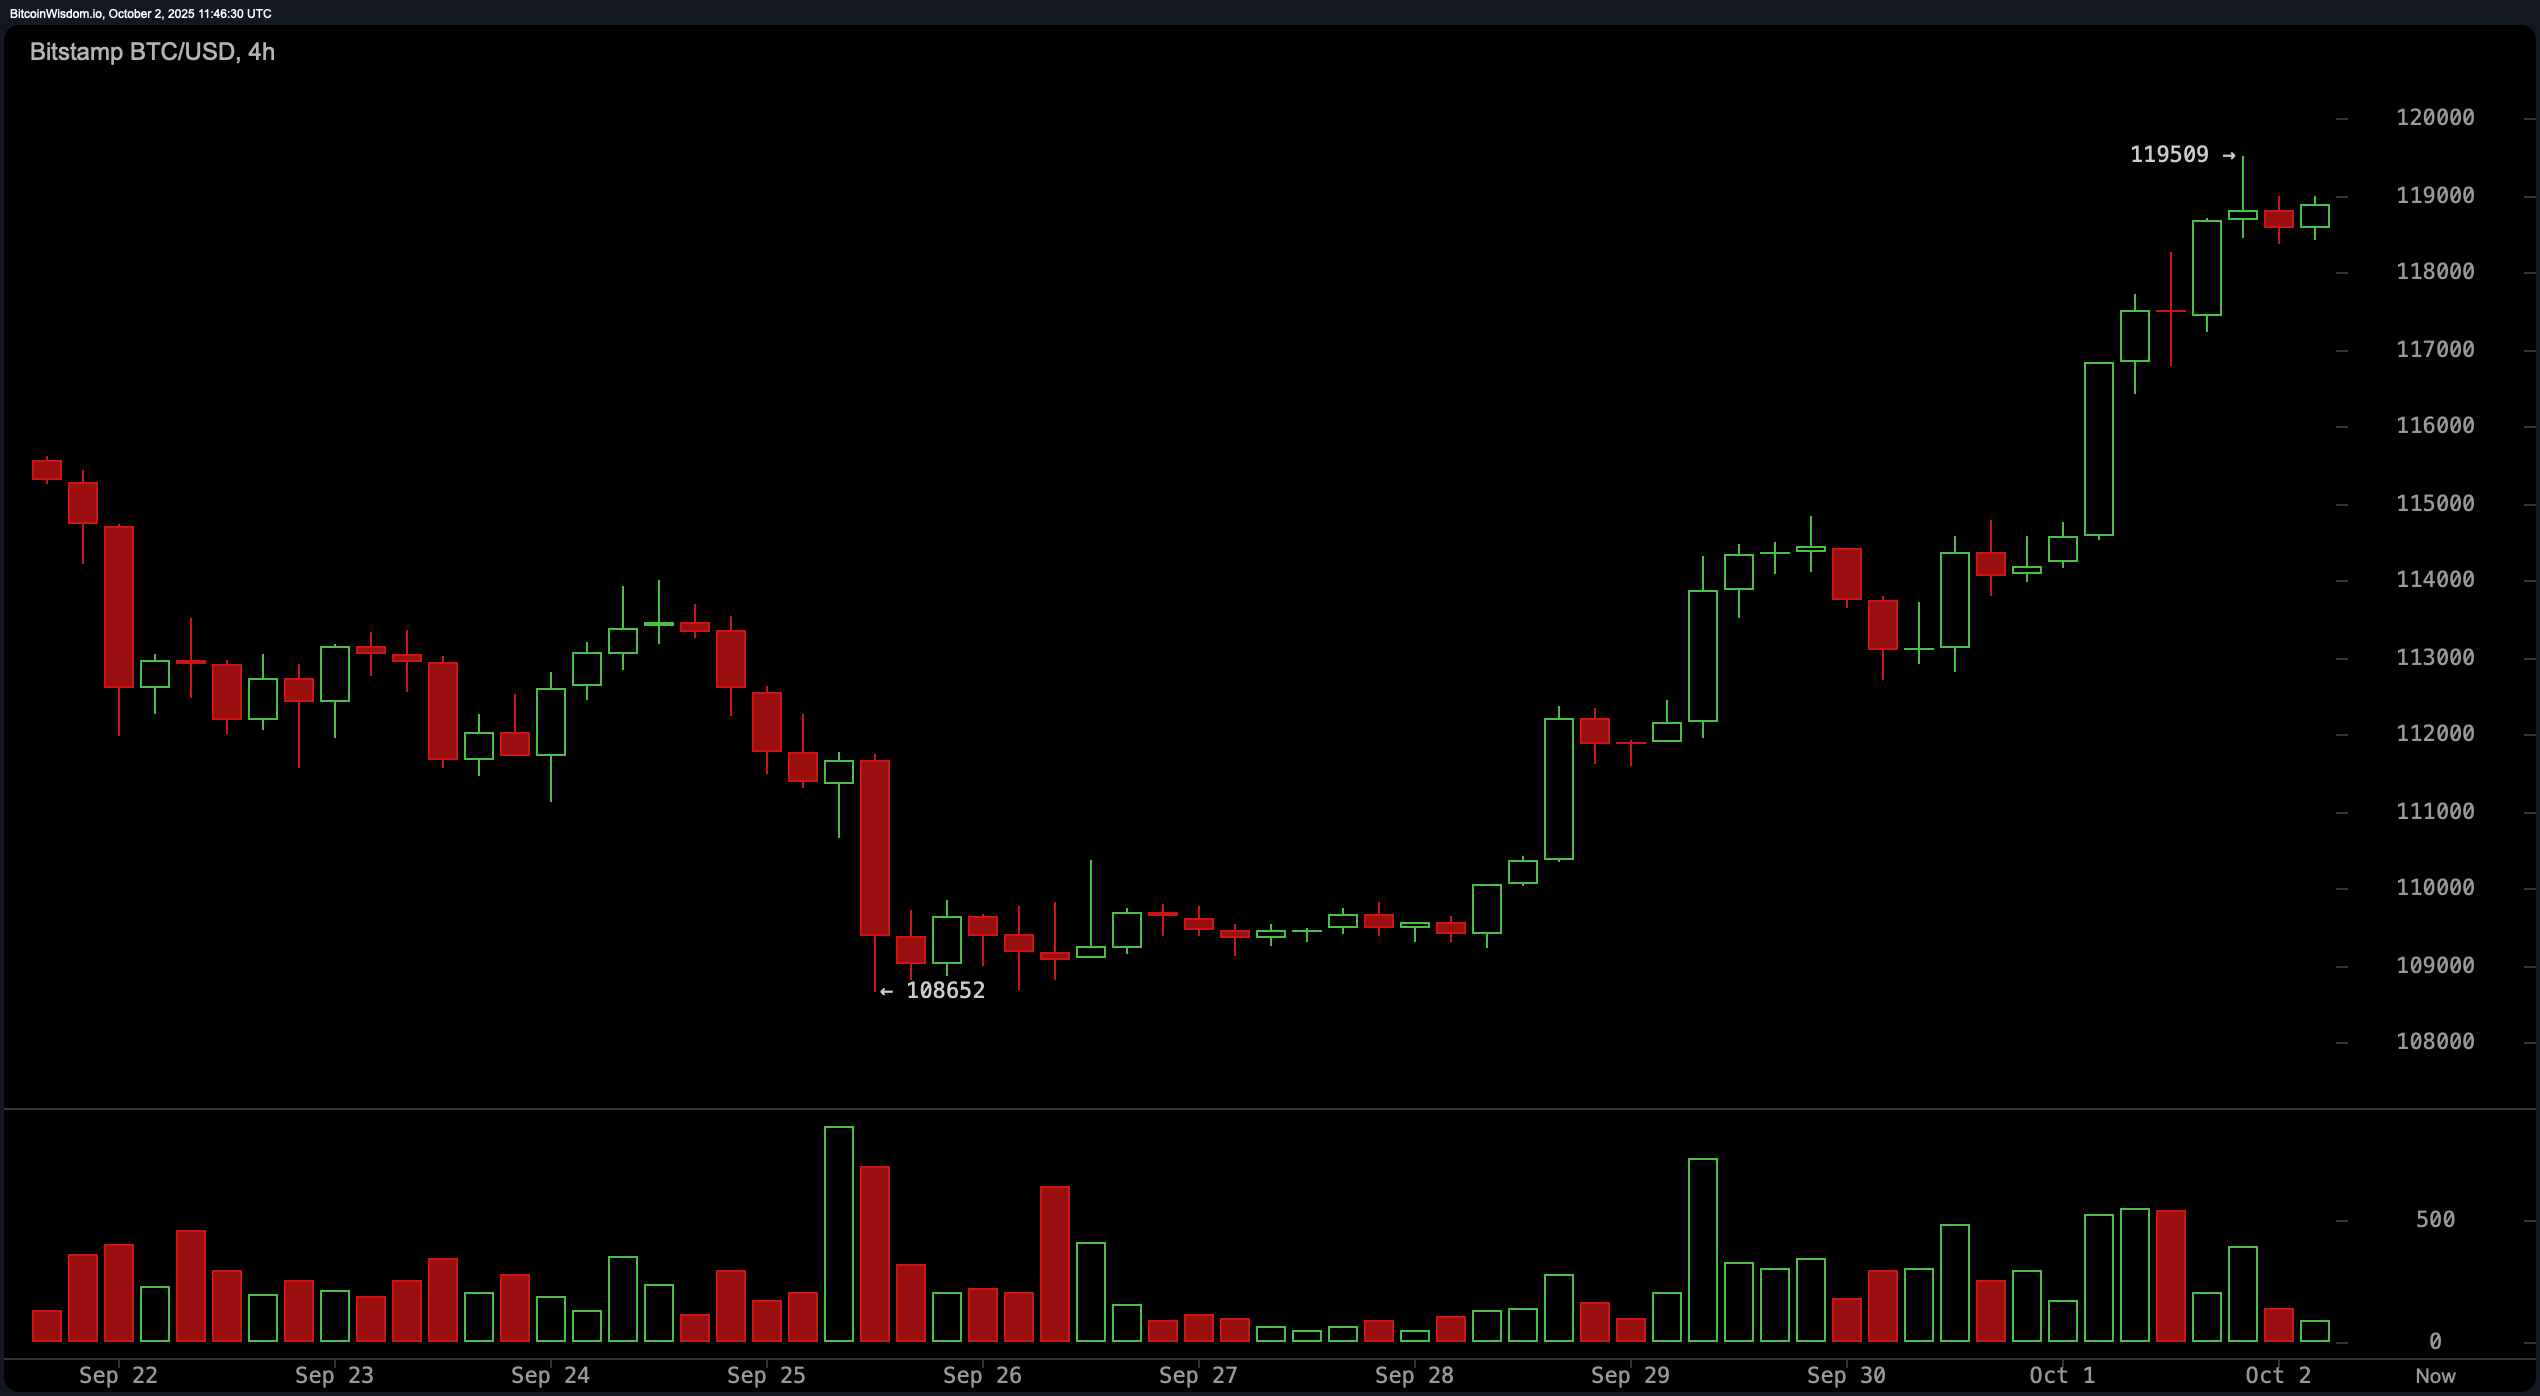
The 4-hour chart reinforces the bullish narrative with a clearly formed, rounded bottom pattern, indicating a classic reversal structure. After establishing a bottom near $108,652 on September 25, bitcoin has consistently posted higher highs and higher lows. The breakout above $113,000 with volume confirmation points to the strength of the reversal. Traders watching the $114,500–$115,500 range—previous resistance turned support—may find strategic long entries, with potential exits projected between $119,500 and $122,000, should momentum continue.
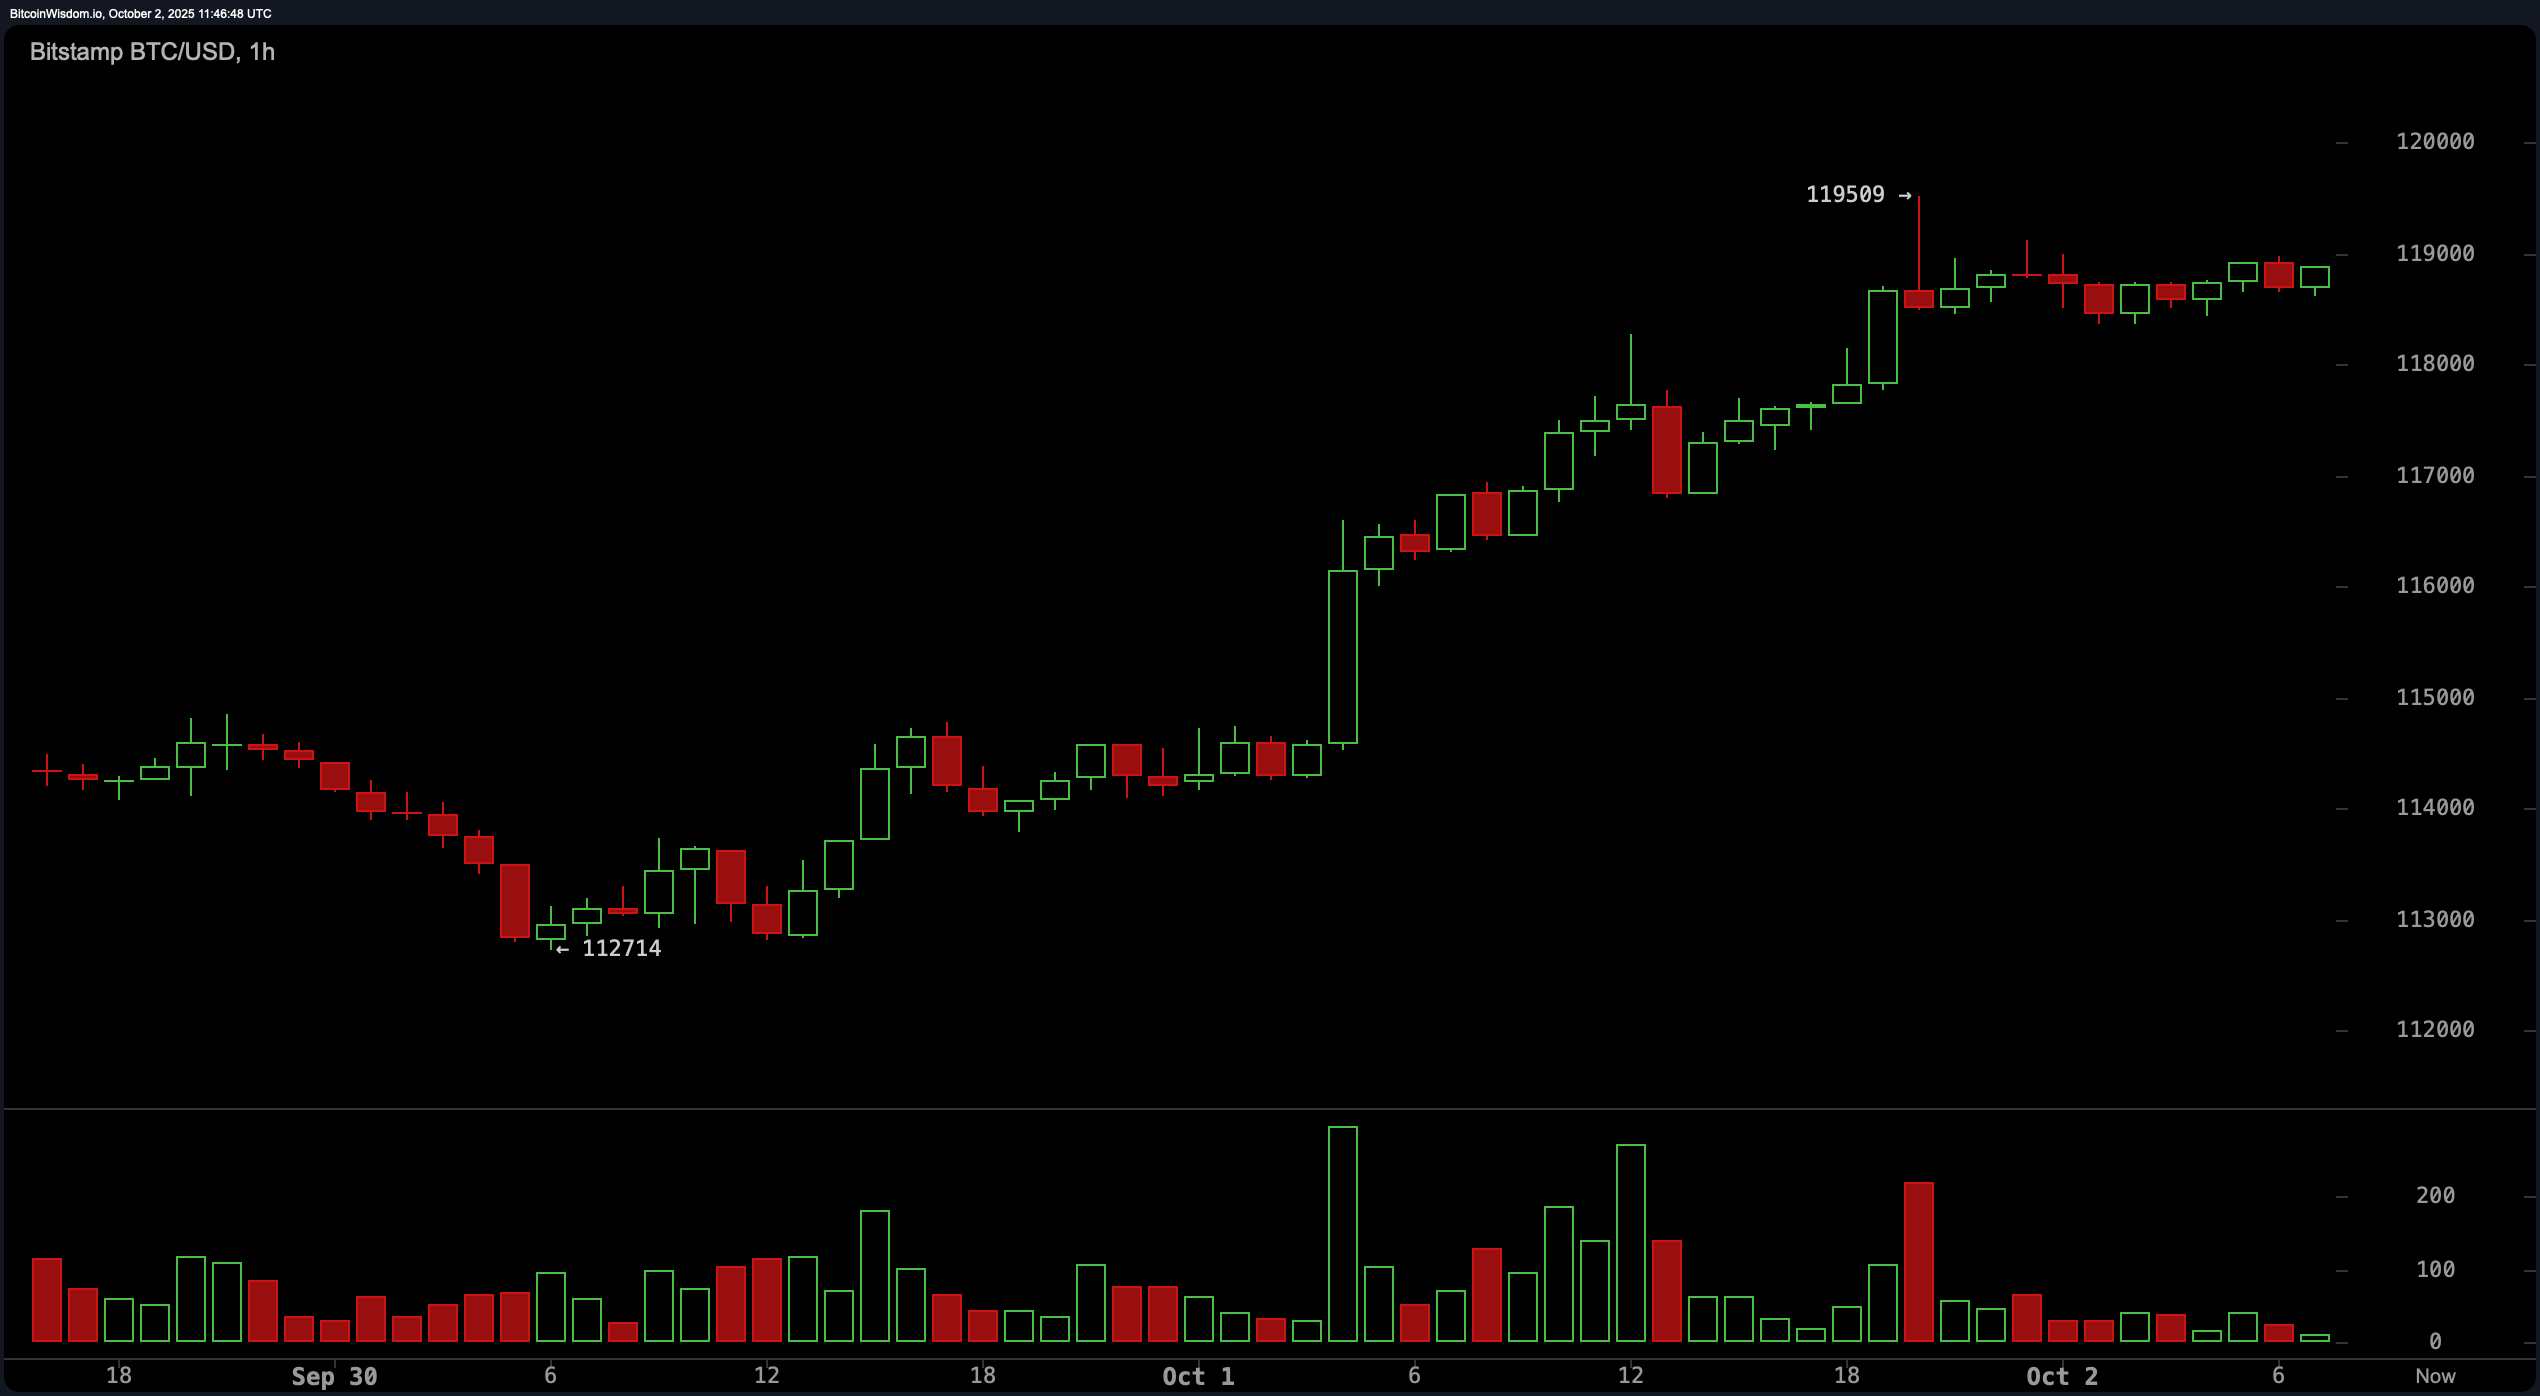
A short-term analysis from the 1-hour chart reveals an aggressive breakout from the $112,700 level, which propelled bitcoin to an intraday high of $119,509. The steep rally suggests the asset is momentarily overbought, increasing the likelihood of near-term consolidation. Despite minor sideways movement post-rally, there’s no evidence of heavy selling pressure, keeping bulls in control. A pullback toward the $117,000–$117,500 range could offer an ideal re-entry for intraday traders, while a breakout above $119,500 with strong volume could act as a catalyst for the next leg upward.
From a technical indicators standpoint, the oscillators paint a mixed but supportive picture for the bulls. The relative strength index (RSI) stands at 63, the Stochastic oscillator at 84, the commodity channel index (CCI) at 137, and the average directional index (ADX) at 20—all reading neutral. However, momentum indicators tell a more optimistic story: the Awesome oscillator shows a value of 1,534 with a bullish signal, momentum is positive at 6,080, and the moving average convergence divergence (MACD) level at 530 also signals a bullish trend. These trends confirm that while bitcoin may be short-term overbought, underlying strength remains.
Moving averages (MAs) across all major periods are uniformly bullish, further validating the upward trend. Both the exponential moving average (EMA) and simple moving average (SMA) for 10, 20, 30, 50, 100, and 200 periods are flashing bullish signals, with the price currently well above all key averages. Notably, the EMA (200) sits at $106,683 and the SMA (200) at $105,122—far below current price action—highlighting long-term trend strength. With multiple timeframe confluence and widespread moving average support, bitcoin’s technical outlook remains constructive going into the next sessions.
Bull Verdict:
With bitcoin trading decisively above key resistance levels and supported by bullish signals across all major moving averages and momentum indicators, the technical outlook favors continued upside. The sustained breakout above $118,000, strong volume on daily and 4-hour charts, and absence of significant selling pressure suggest that bitcoin may be preparing for a test of the $124,000–$125,000 resistance zone in the near term.
Bear Verdict:
Despite the strong upward momentum, signs of overbought conditions on the 1-hour chart and neutral oscillator readings could foreshadow a short-term pullback. If bitcoin fails to hold above the $117,000–$117,500 support zone on a retest, the rally may stall, and sellers could regain control, pushing price back toward $114,000 or lower before any sustained move higher resumes.