
Bitcoin’s price ranged between $117,365 and $118,057 in the last hour, reflecting intraday volatility amid a broader 3.8% decline over the past 24 hours. With a market capitalization of $2.33 trillion and a 24-hour trade volume of $72.33 billion, current market dynamics suggest a cautious stance as bitcoin trades within a daily range of $116,481 to $121,919.
Bitcoin
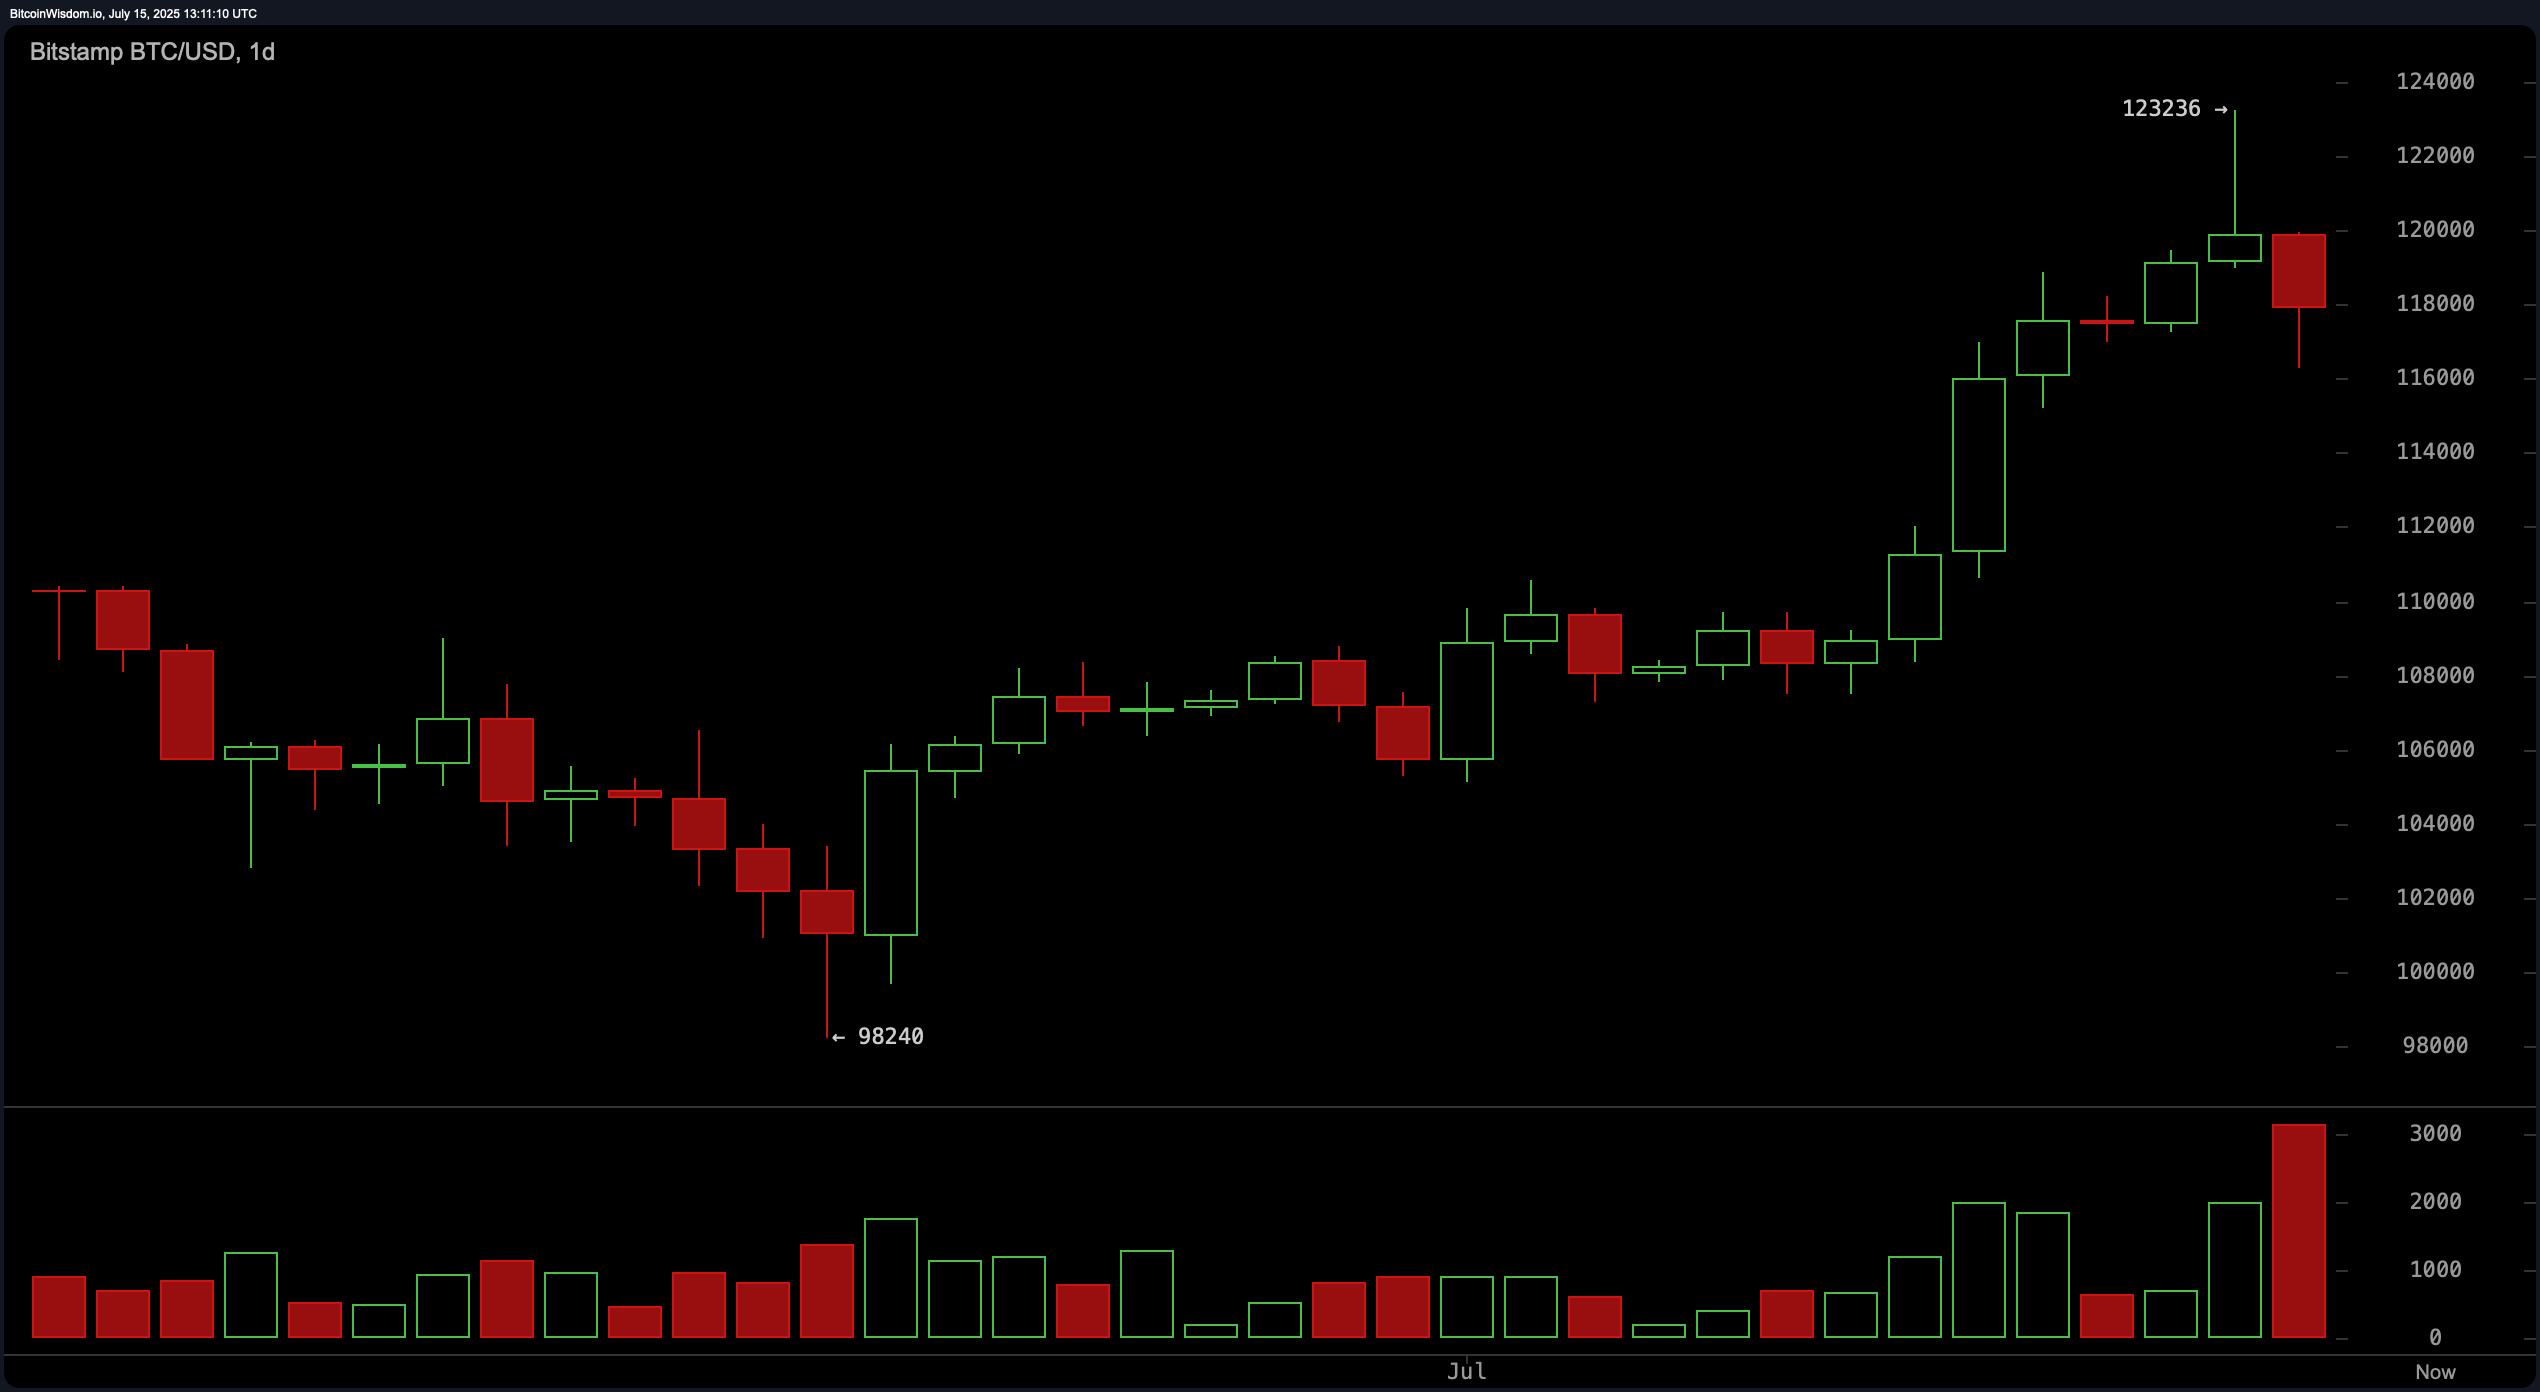
On the daily bitcoin chart, the recent bearish engulfing pattern indicates a potential reversal following a parabolic rally. This high-volume bearish candle signals panic selling or institutional distribution, with a confirmed key support level at approximately $116,000. The critical resistance stands near $123,236, the recent wick top. If bitcoin breaks below the $115,000 mark on significant volume, downside targets could extend to $112,000 or even $109,000. Conversely, a bounce from the $115,000–116,000 zone could warrant long entries if volume subsides and stabilizes.
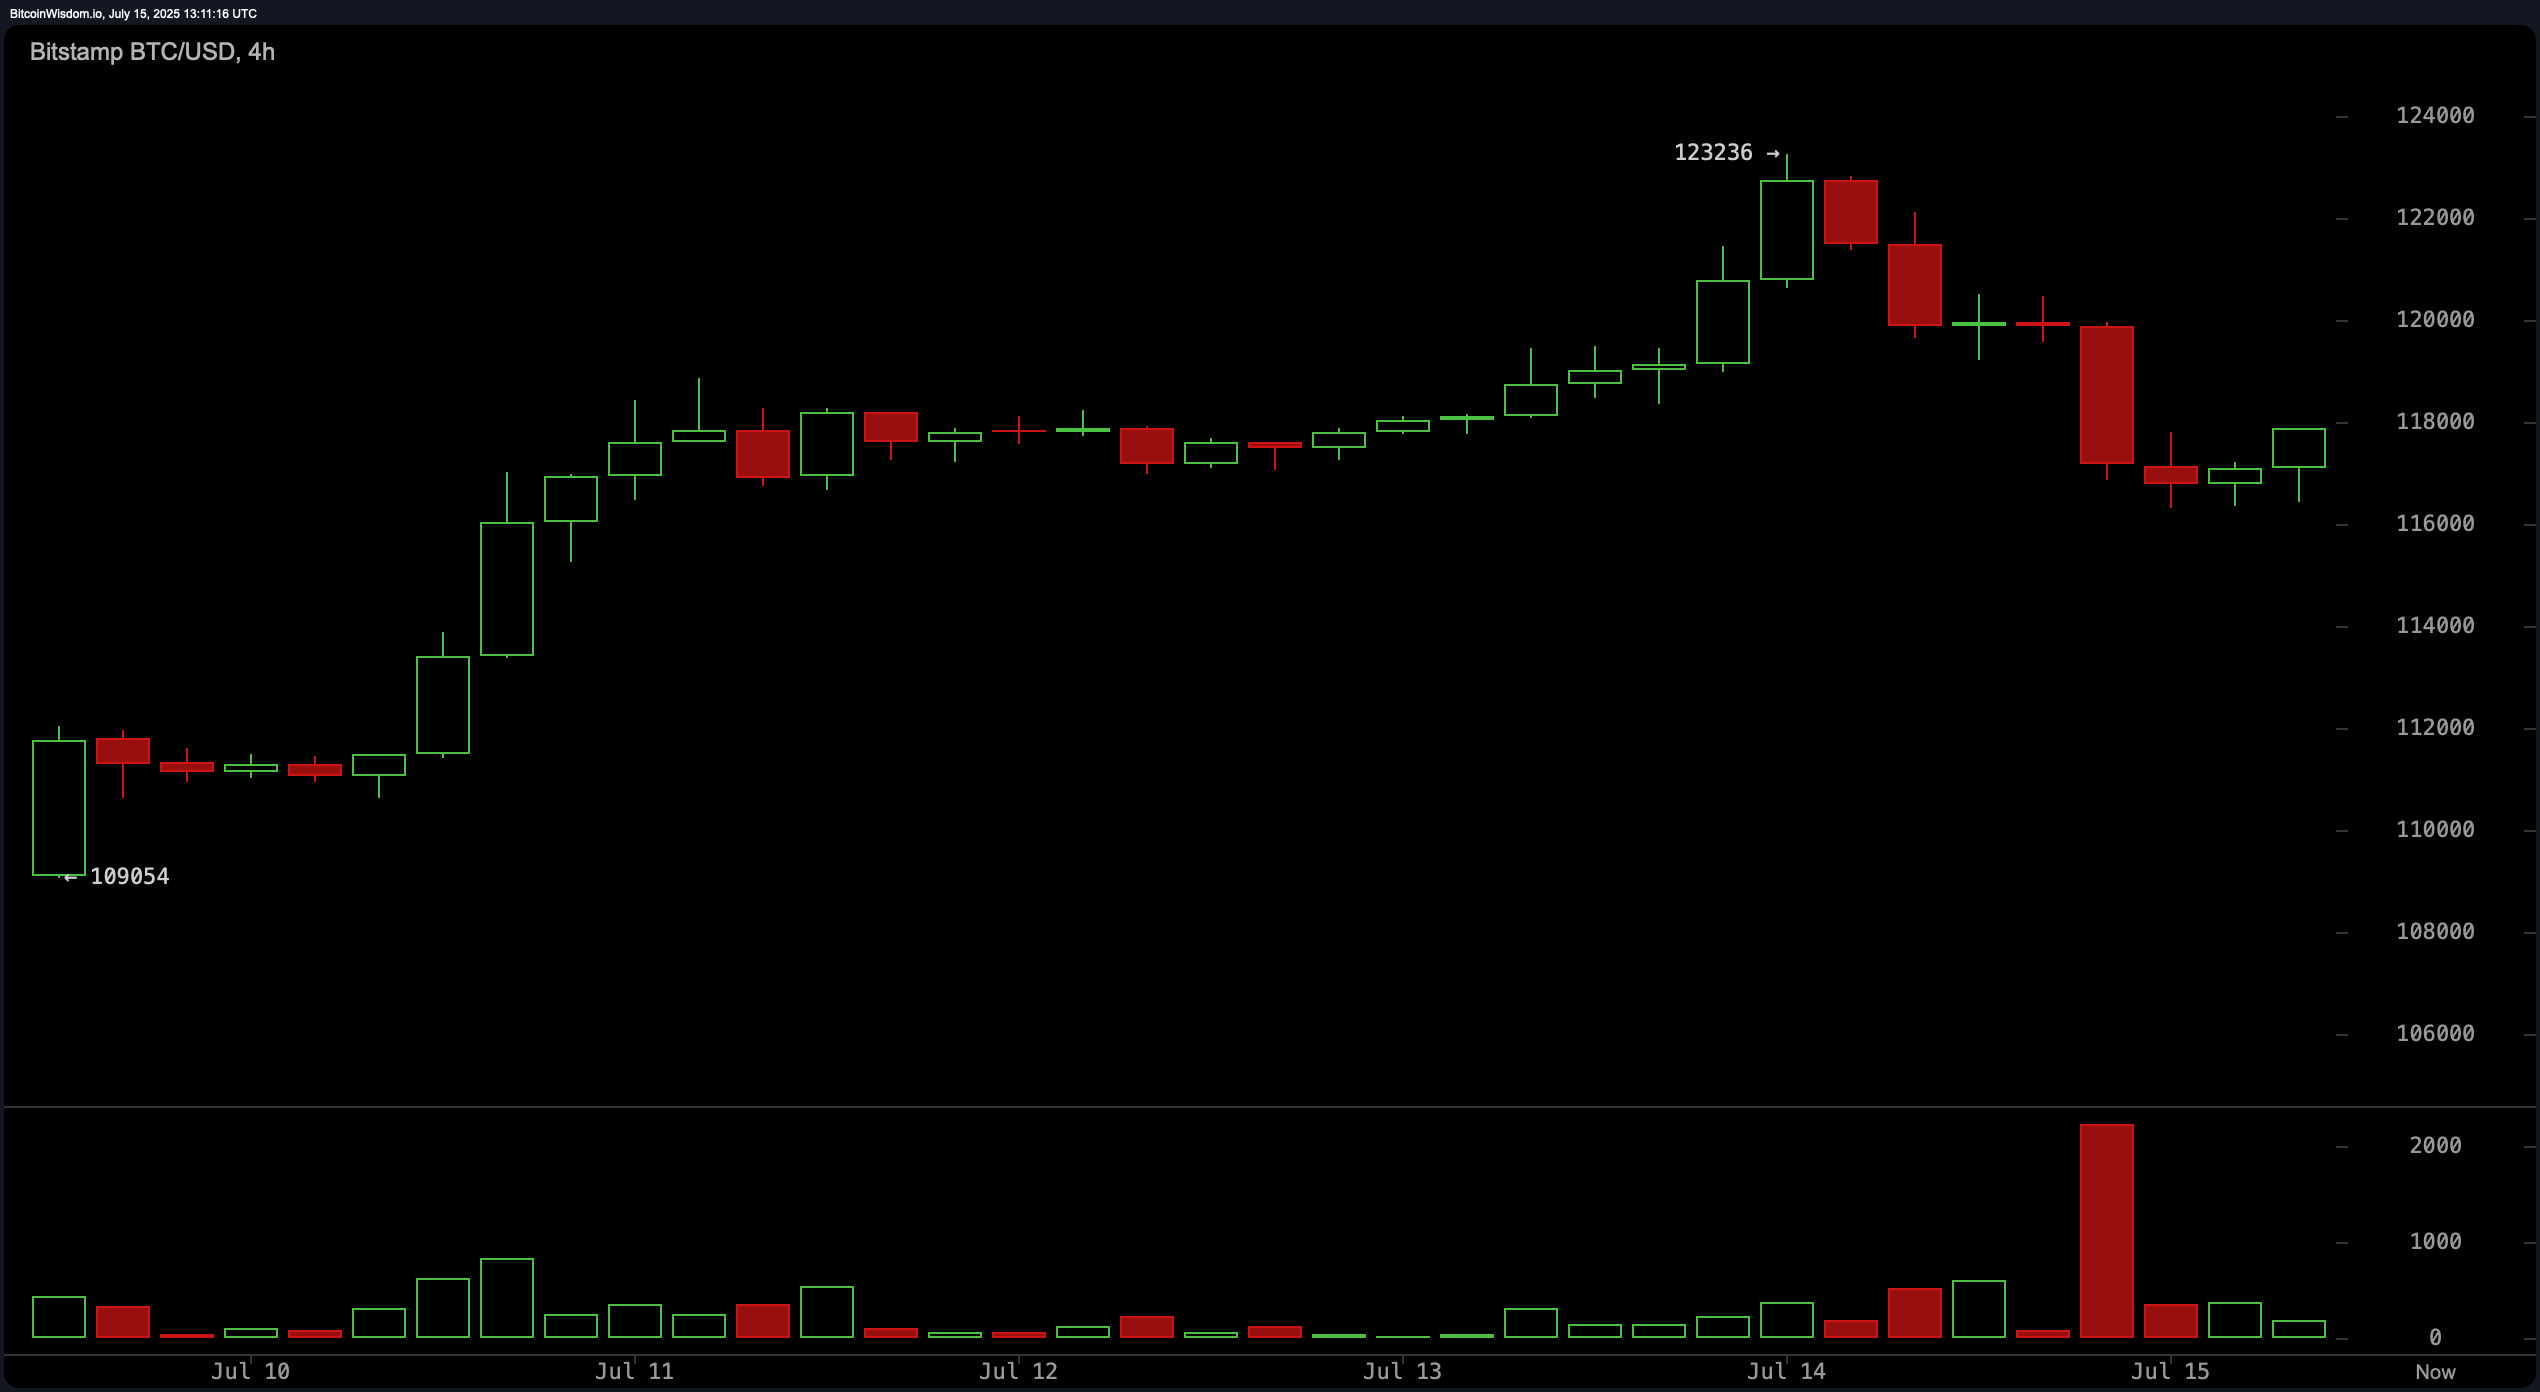
The 4-hour bitcoin chart reveals a textbook blow-off top followed by a structured breakdown and redistribution phase. The move from $123,000 down to sub-$118,000 levels was sharp and marked by strong selling pressure. While a minor rebound has emerged, the lack of volume behind the recovery raises concerns about its sustainability. The $116,000 level remains the immediate support, with the next resistance barrier near $119,500 to $120,000. Any attempt to go long should be conservative and contingent upon a bullish reversal candle confirmed by increased trading activity.
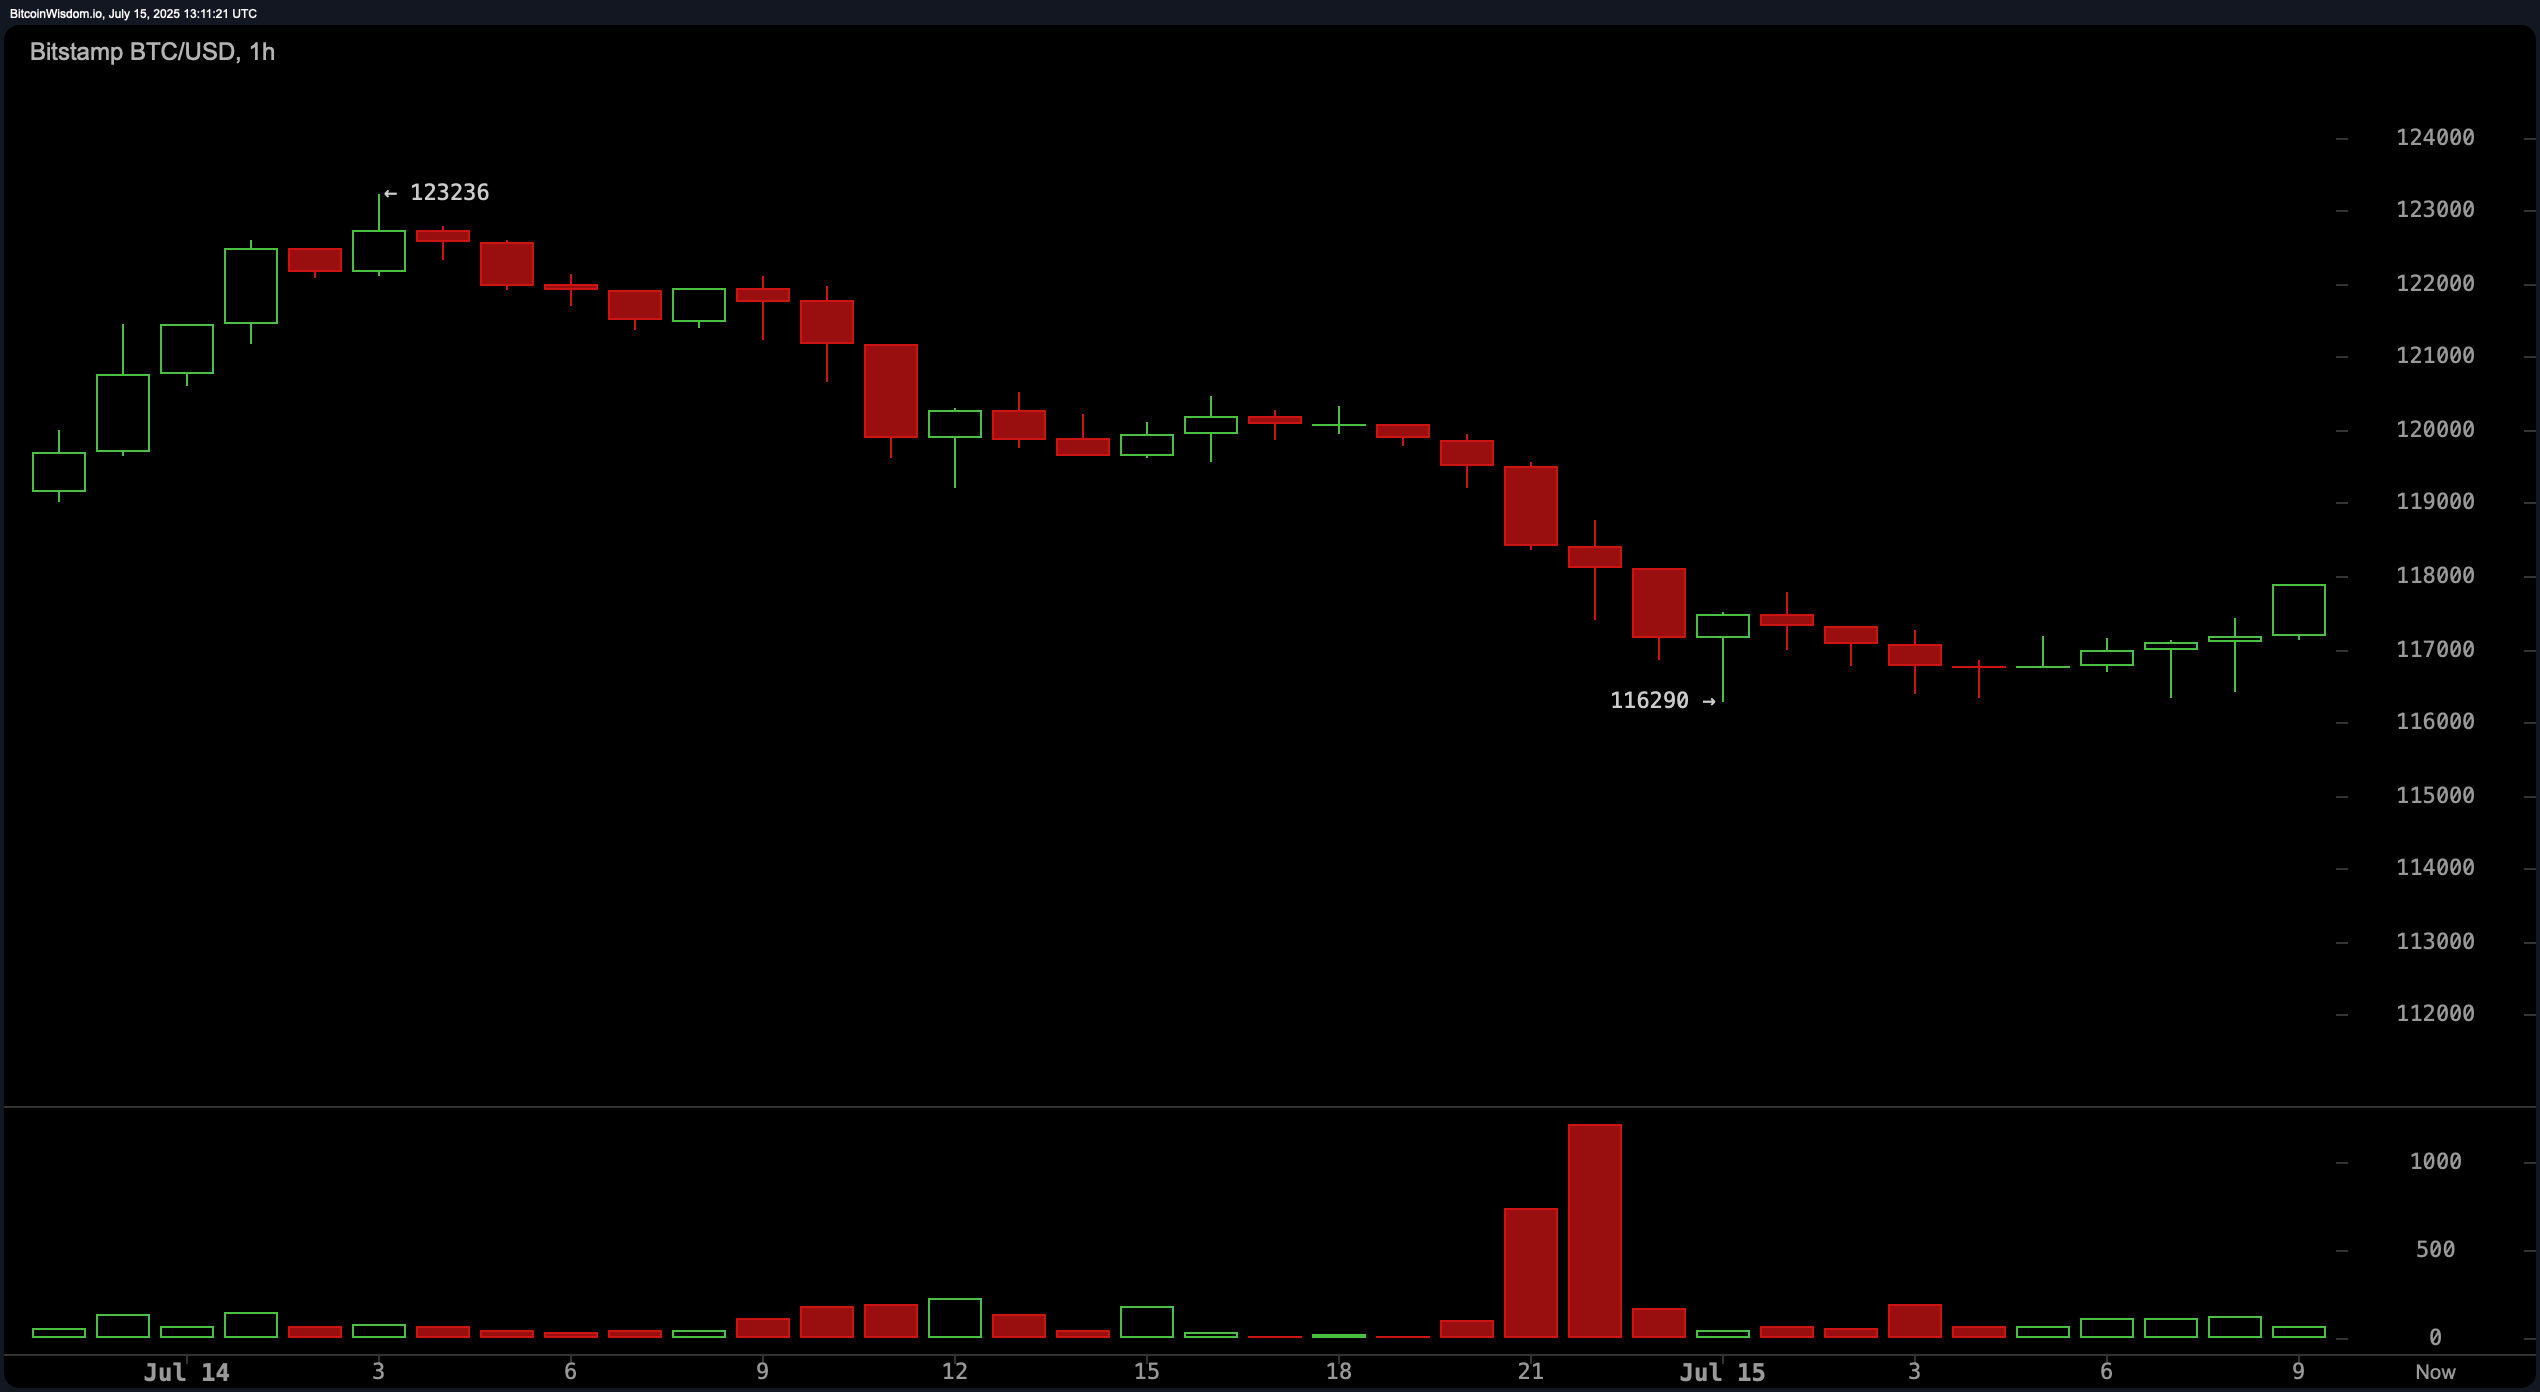
Zooming into the 1-hour bitcoin chart, BTC continues to print lower highs and lower lows, indicative of a short-term downtrend. The local bottom appears around $116,290, followed by a tepid bounce on light volume. The current rebound lacks conviction, suggesting any upside might be limited unless volume dramatically improves. Scalpers may find opportunities between $116,500 and $117,000, but should apply tight stops under $116,000, with resistance targets set around $118,800 to $119,500.
Oscillator indicators present a mixed picture. The relative strength index (RSI) at 68 is neutral, while the Stochastic at 83 also suggests neutrality. The commodity channel index (CCI) and momentum indicators signal a bearish trend, whereas the moving average convergence divergence (MACD) shows a bullish signal, reflecting conflicting momentum cues. Meanwhile, the Awesome oscillator and average directional index (ADX) remain neutral, reinforcing the lack of a clear directional bias in the short term.
Moving averages (MAs) overwhelmingly support a bullish longer-term trend. All major exponential moving averages (EMAs) and simple moving averages (SMAs) from the 10-period through the 200-period are issuing positive signals. These include the 10-period EMA at 115,381 and the 200-period EMA at 97,109, with corresponding SMAs at $114,563 and $97,243. Despite near-term weakness, the longer-term structure remains bullish, suggesting that bitcoin could resume its uptrend if it regains strength above the $120,000 level with volume confirmation.
Bull Verdict:
Despite recent bearish momentum and a significant pullback, the underlying strength reflected in all major moving averages signals that the broader uptrend remains intact. If bitcoin holds the $116,000 support and reclaims $120,000 with strong volume, a resumption of bullish momentum is likely, positioning it to retest $123,236 and potentially break higher.
Bear Verdict:
The bearish engulfing pattern on the daily chart, combined with declining volume on attempted recoveries, suggests growing downside risk. A decisive break below $115,000 on strong volume could invalidate the longer-term bullish setup, exposing bitcoin to further declines toward $112,000 and possibly $109,000.