Bitcoin was priced at $112,464 on Oct. 11, 2025, with a total market capitalization of $2.24 trillion. In the past 24 hours, bitcoin saw massive trading volume of around $199 billion and moved within a wide intraday price range between $109,683 and $122,582.
Bitcoin Chart Outlook
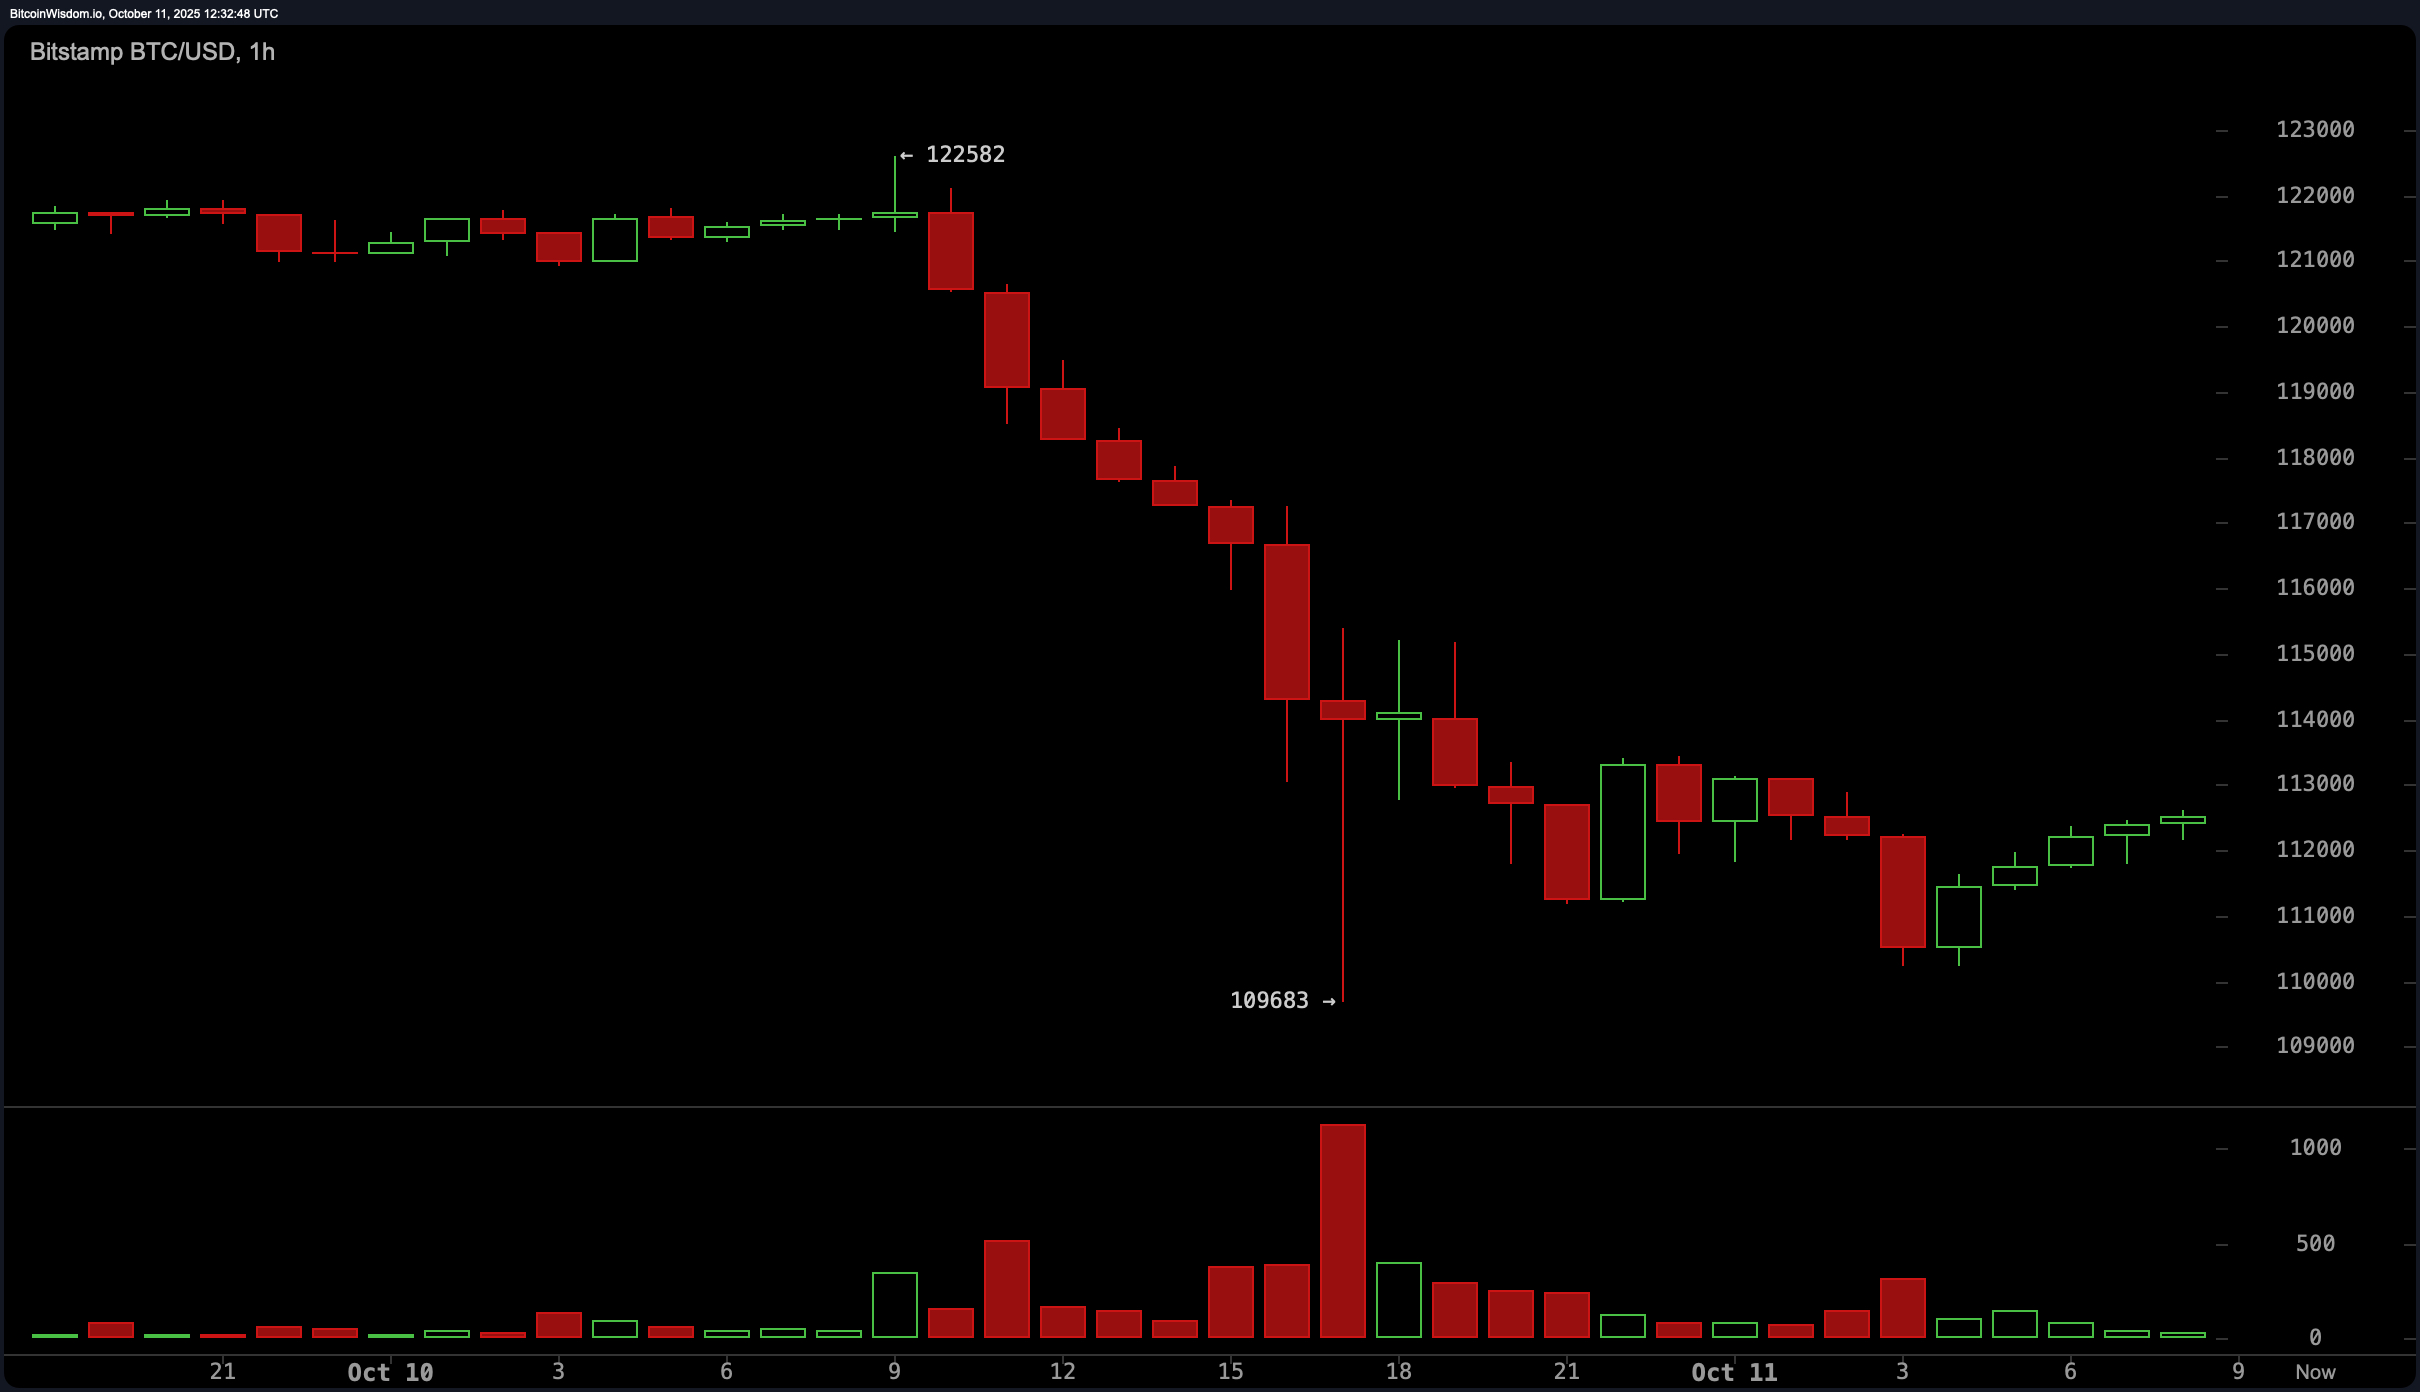
The 1-hour bitcoin chart indicates a recent steep decline from $122,582 to $109,683, followed by moderate consolidation in the $111,000 to $113,000 zone. The sharp drop was accompanied by a spike in volume, signaling a potential continued capitulation.
Since then, declining volume suggests reduced selling pressure. Key foundational support (at least for now) lies near the $110,000 level, while resistance levels are seen between $115,000 and $117,000, with a significant barrier at $120,000.
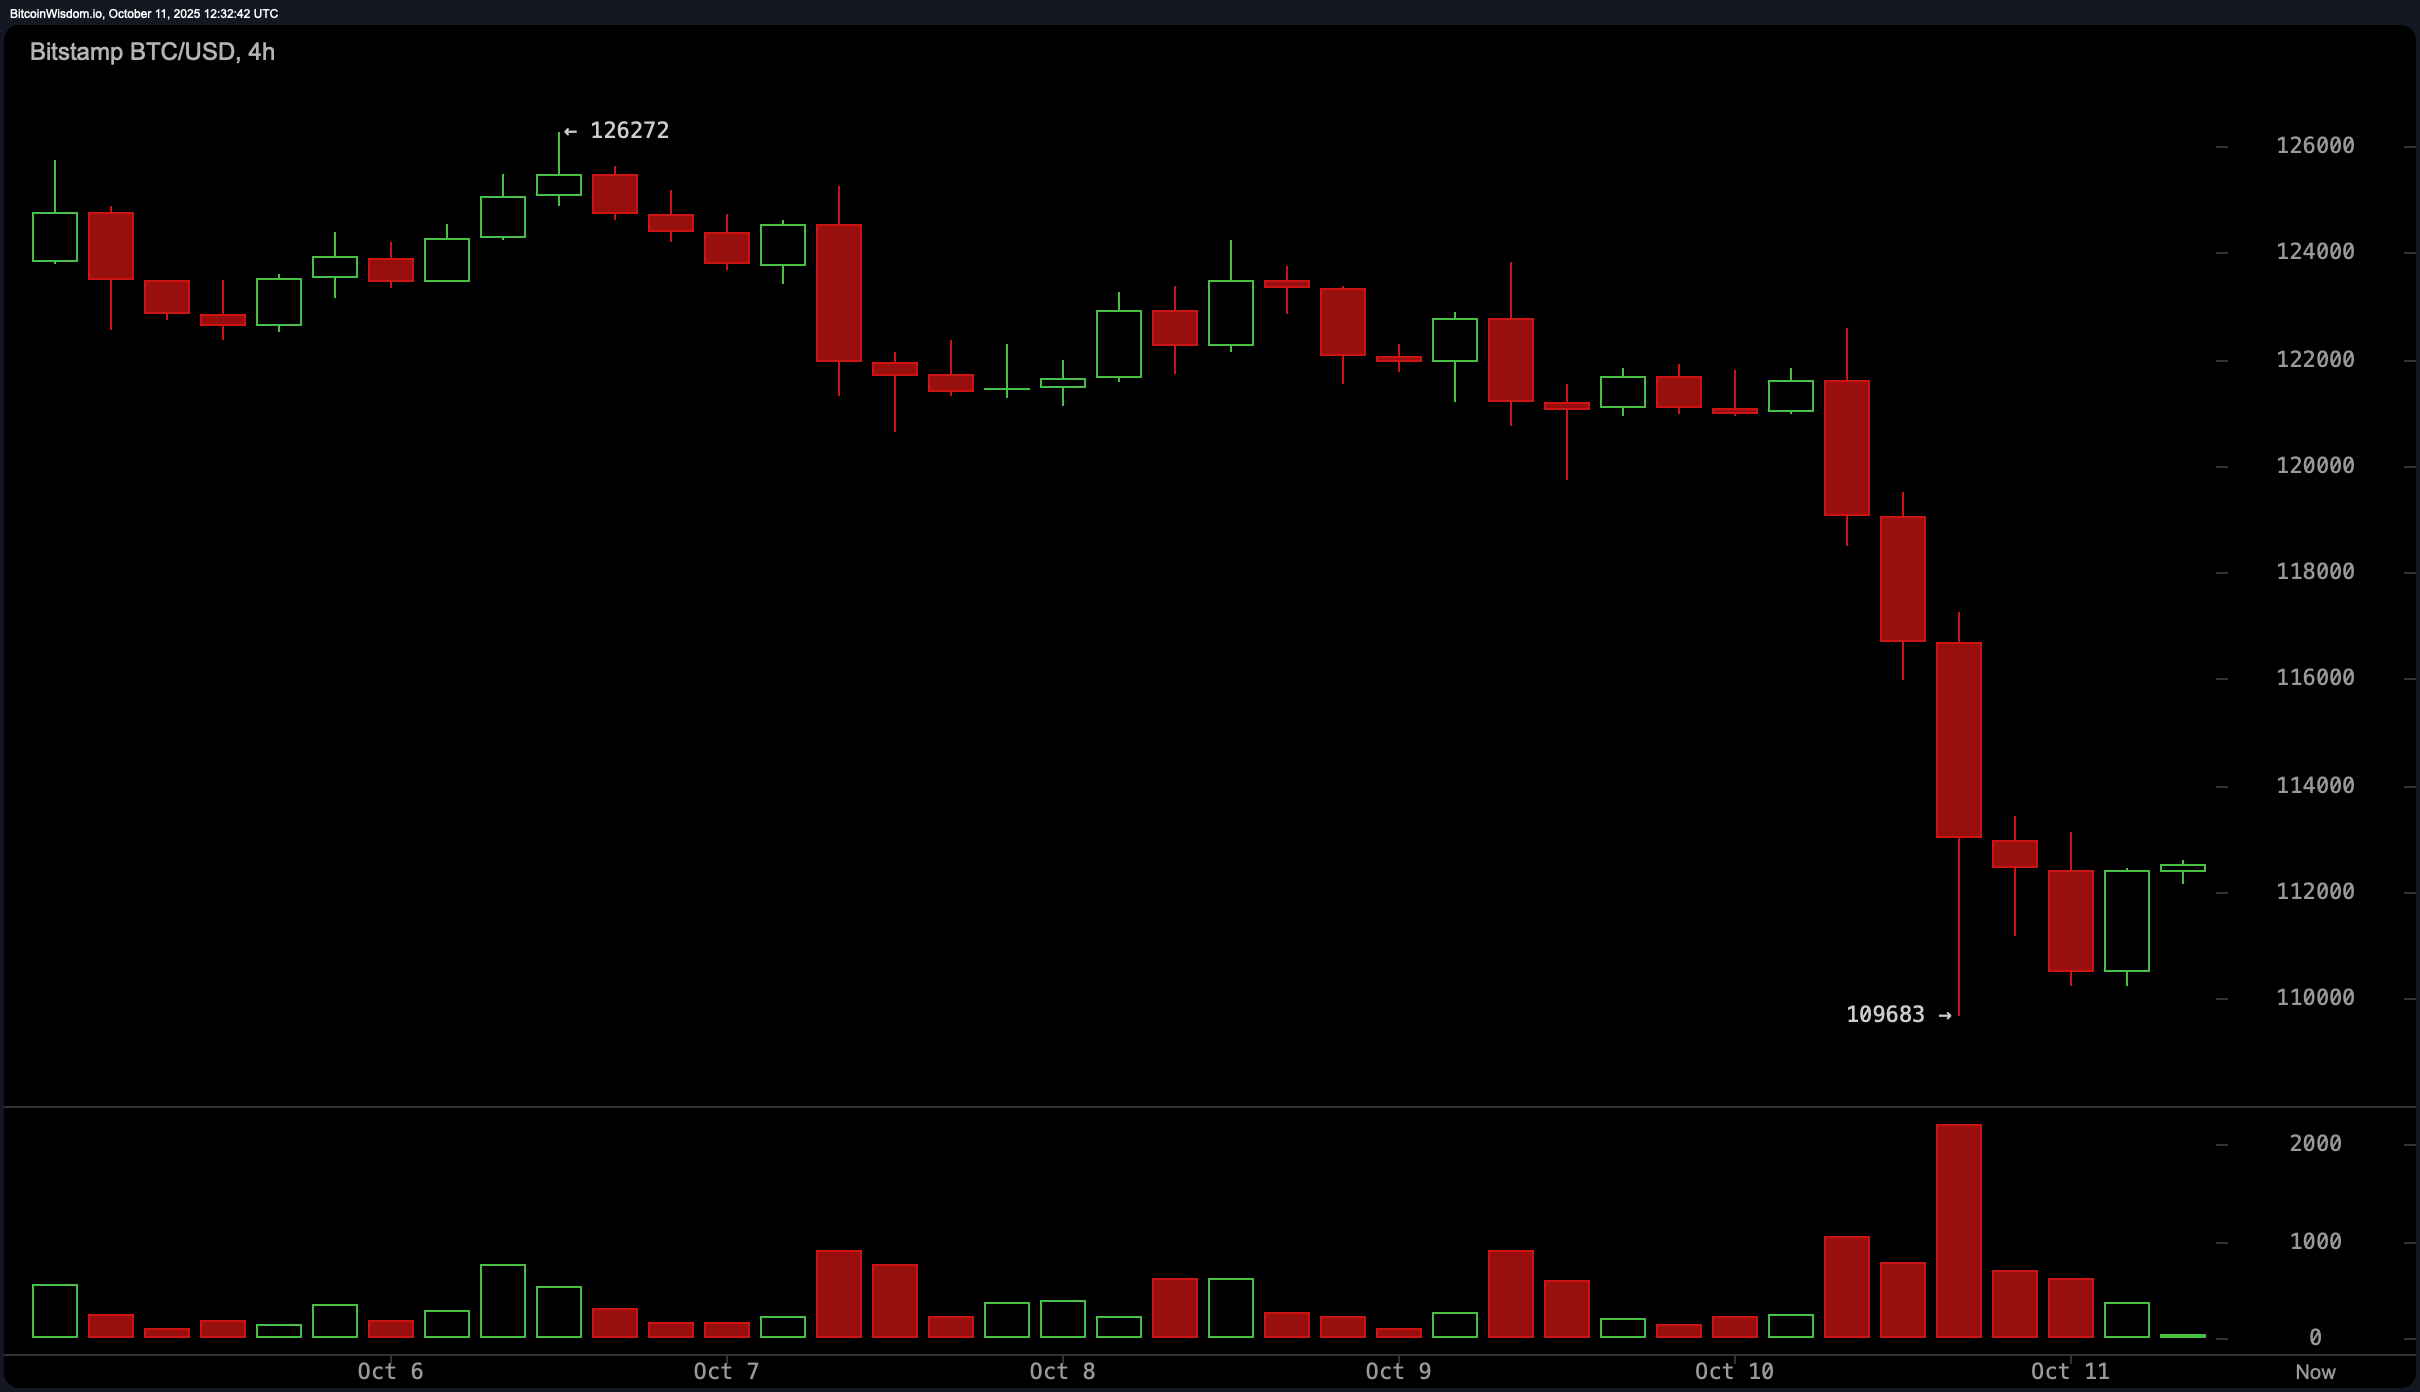
On the 4-hour chart, bitcoin has exhibited a clear swing breakdown from $126,272, defined by a series of lower highs and lower lows. The local low of $109,683 currently acts as critical support. Should this level remain intact, a recovery could extend toward $115,000 to $118,000. Accumulation appears to be underway in the $111,000 to $112,000 region, although any price rejection near $118,000 or $120,000 may cap further upside unless breached on strong momentum.
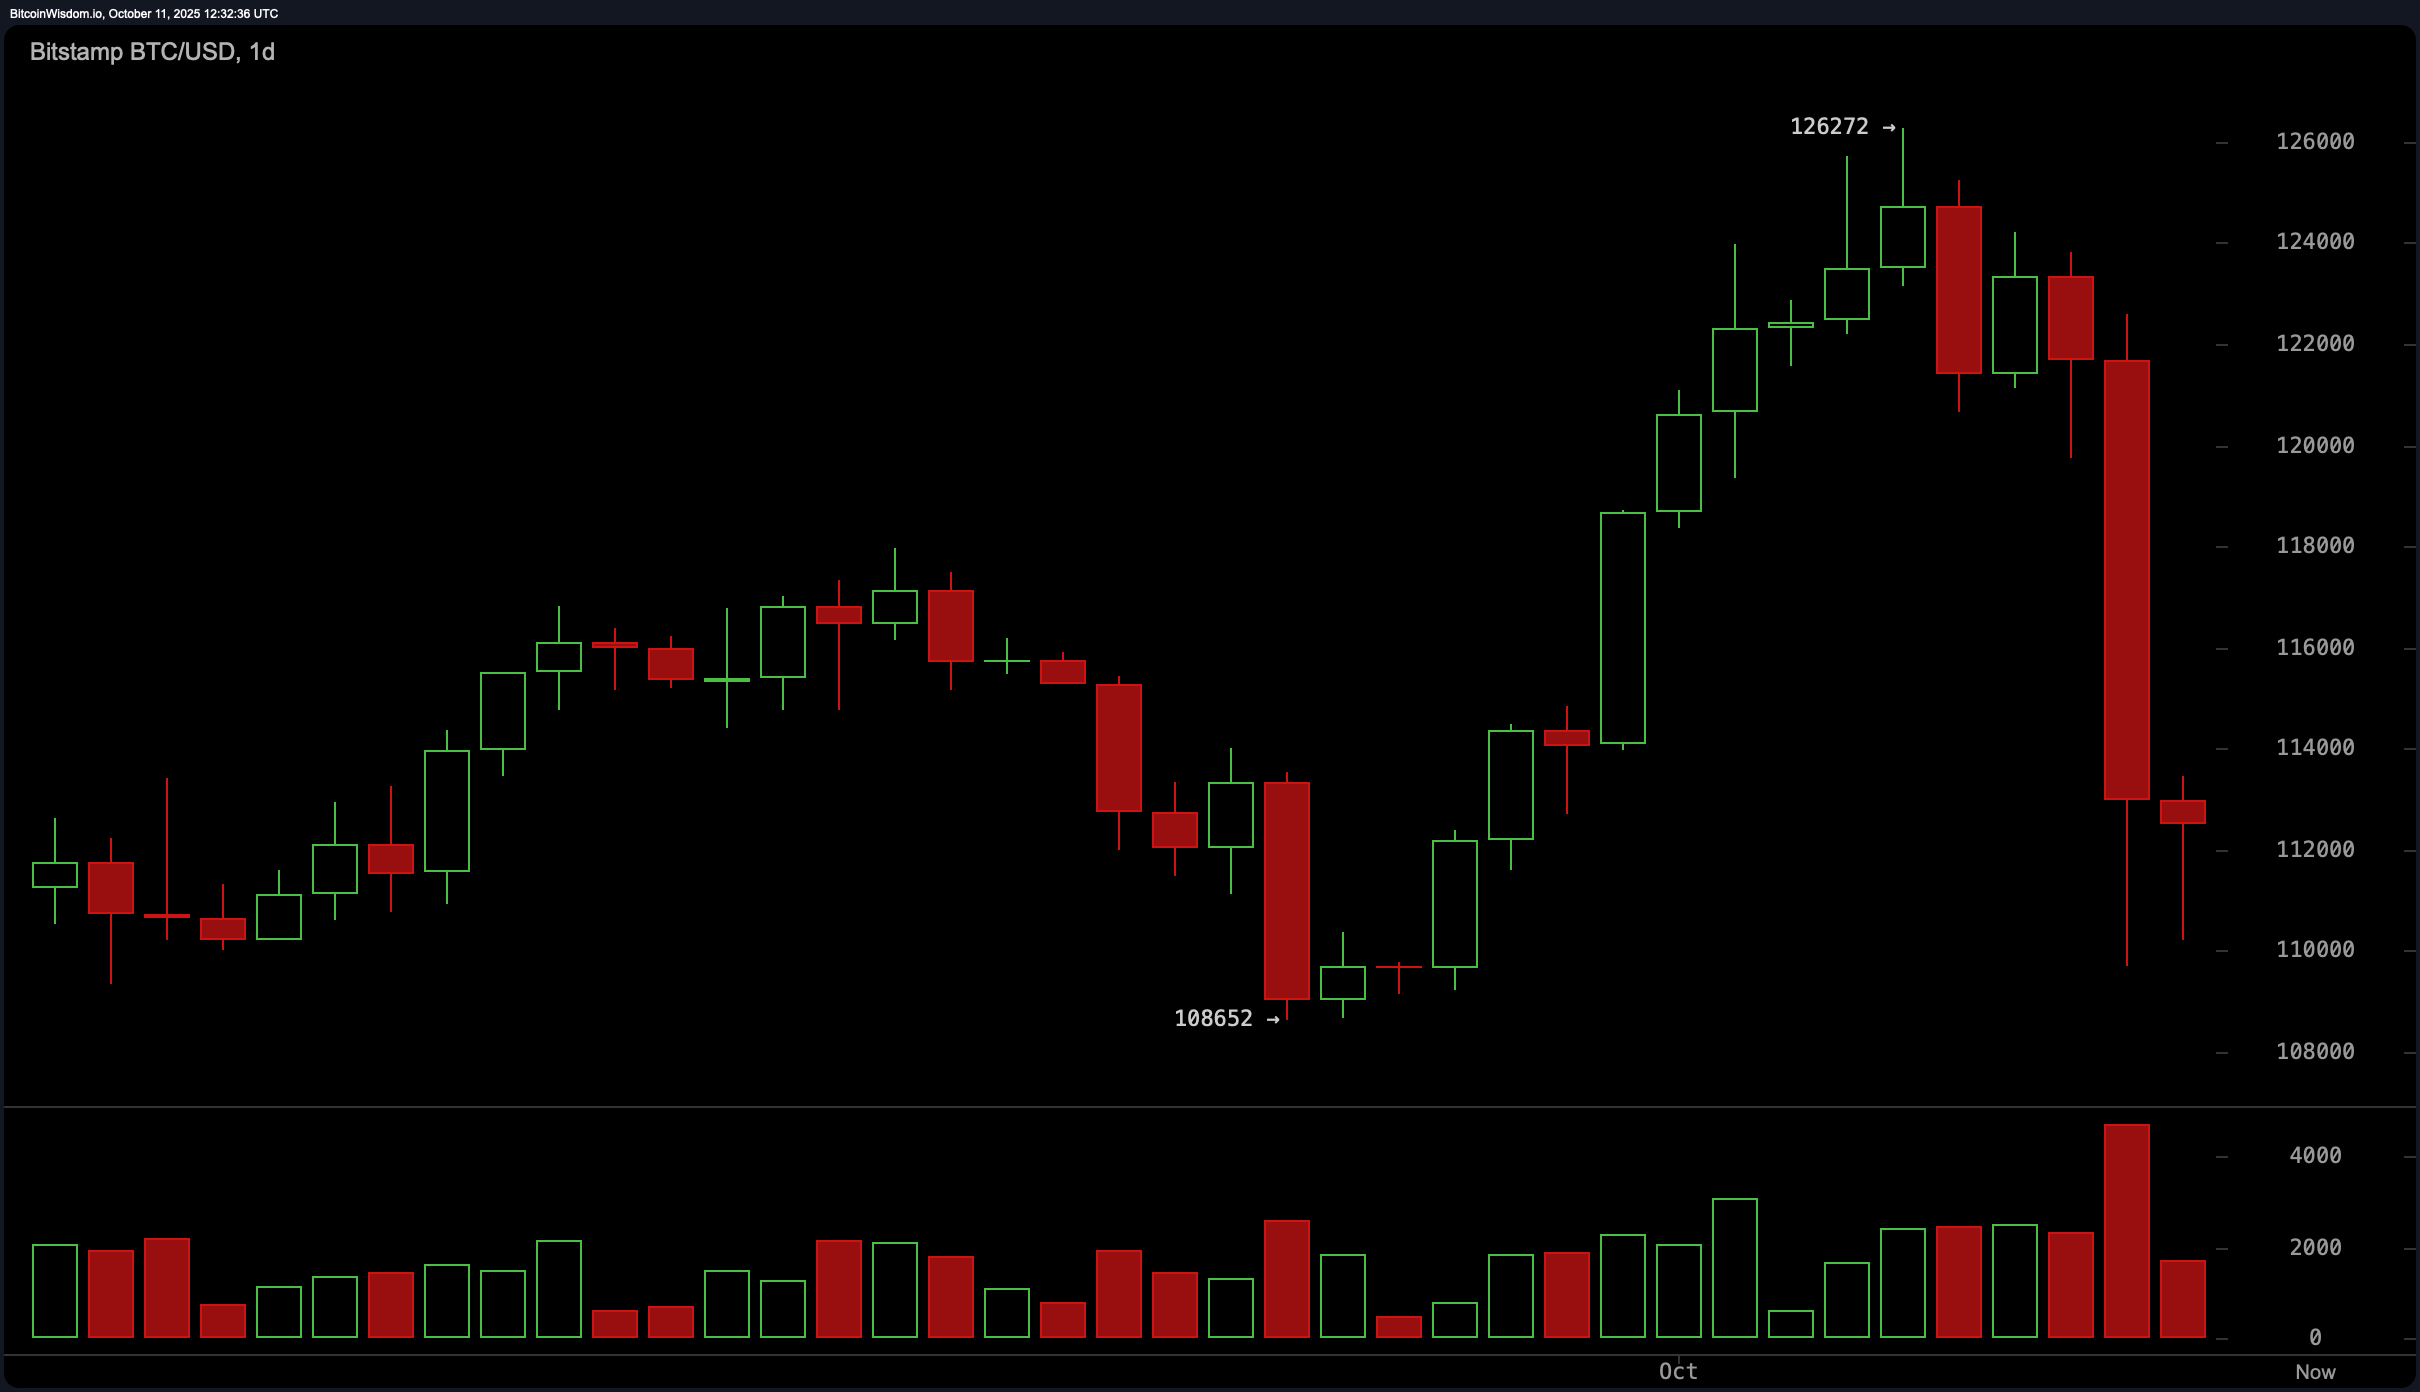
From a daily chart perspective, bitcoin still retains a structurally bullish stance in the macro view, despite recent high-volume panic selling. Price action is testing former breakout territory around $110,000 to $112,000, which aligns with key support at $108,600. If buyers maintain this zone, a return to $118,000 and $122,000 remains within reach. A strong reclaim of $113,000 on sustained volume would mark a meaningful local bottom, with a potential retest of the $126,000 region should bullish momentum strengthen.
Among oscillators, most indicators — including the relative strength index (RSI) at 41, stochastic at 39, commodity channel index (CCI) at -62, average directional index (ADX) at 29, and awesome oscillator at 3,162 — signal neutral market conditions. Notably, momentum at -6,080 and the moving average convergence divergence (MACD) level at 1,109 suggest ongoing weakness in directional momentum, reflecting bearish undertones in the short term.
Across all tracked moving averages (MAs), bitcoin is trading below nearly every key threshold except the 200-period simple and exponential moving averages, which remain supportive at $106,723 and $107,888, respectively. The 10-period exponential moving average (EMA) at $118,168 and 10-period simple moving average (SMA) at $120,570 highlight resistance directly overhead. The trend remains under pressure across shorter timeframes, with all averages from 10 to 100 periods indicating a downward trajectory. Reclaiming these levels is crucial for a structural reversal in sentiment.
Bull Verdict:
If bitcoin sustains support above $109,600 and successfully reclaims the $113,000 level on strong volume, the case for a short-term rebound strengthens. Consolidation near prior breakout territory and oversold momentum indicators support the potential for a recovery toward $118,000 and possibly $122,000, preserving the broader uptrend structure on the daily chart.
Bear Verdict:
Failure to hold above $108,600 would invalidate recent consolidation efforts and signal a continuation of the downtrend. With momentum and the moving average convergence divergence (MACD) both indicating weakness, and price trading below all key short- and mid-term moving averages, downside extension toward $104,000 cannot be ruled out.
💡 FAQ: Bitcoin Price Watch
❓Can bitcoin reclaim $113K and signal the end of the correction?
A sustained move above $113K on strong volume could mark a local bottom and trigger short-term bullish momentum.
❓What support levels are critical for bitcoin right now?
The $109,600 to $110,000 zone remains key support, with $108,600 as the final defense before deeper downside risk. Presently, at 9 a.m. EST on Oct. 11, $112,000 is firming as near-term support.
❓Where is major resistance if bitcoin starts to rebound?
Bitcoin faces layered resistance between $115K and $120K, where prior breakdown levels could cap upside unless volume surges.
❓Is bitcoin still in a long-term bullish structure despite the pullback?
Yes—while short-term pressure persists, the daily chart still shows a macro bullish bias as long as prices stay above $106K.