In the realm of digital assets, bitcoin has decided to test the patience of traders once again, hovering in a tight range around $107,800 to $108,200. With mixed signals from oscillators and a uniformly grim picture from moving averages, the chart suggests a market trying to remember where it left its mojo.
Bitcoin Chart Outlook
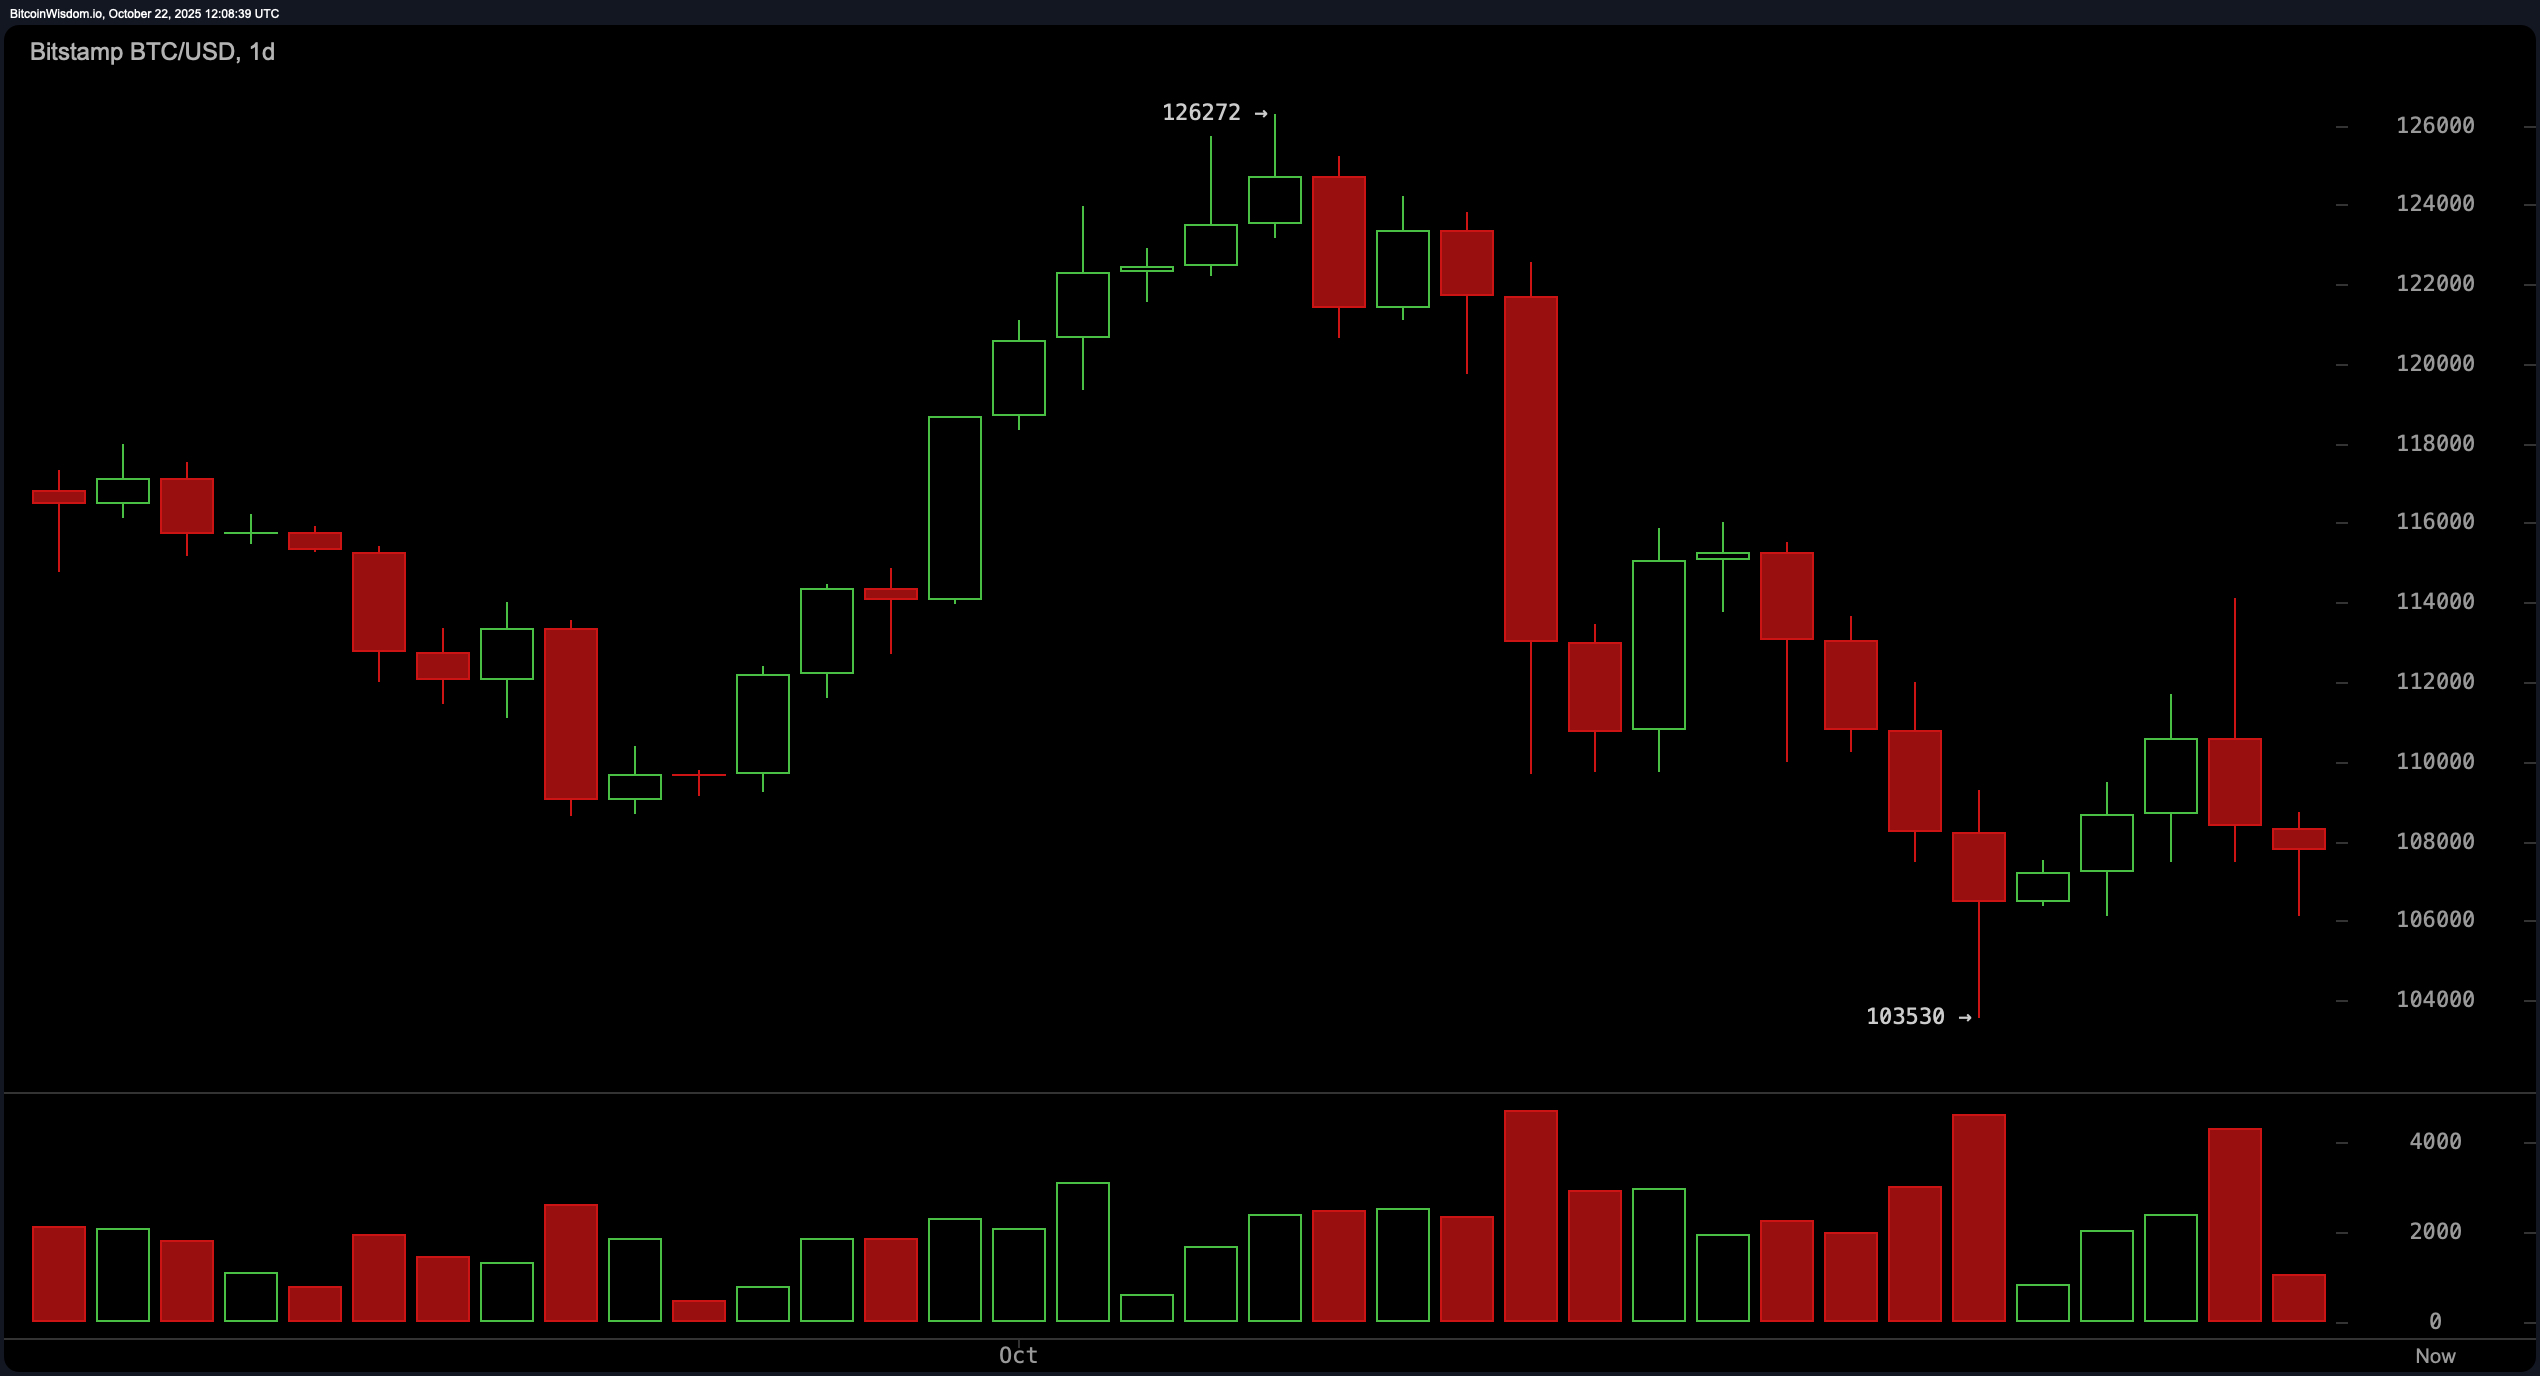
On the daily timeframe, bitcoin (BTC) is nursing the wounds of a swift rally toward $126,272 that was unceremoniously rejected. The follow-up? A dramatic nosedive marked by robust red volume bars, suggesting the bulls didn’t just lose the fight—they left their armor behind.
The appearance of a bearish engulfing pattern near the top spells textbook trouble, with support clinging around the $103,530 zone like a life raft. Momentum indicators are leaning into gravity, with the moving average convergence divergence (MACD) showing a negative level of −2,187 and momentum at −7,389—both clearly skewed to the downside.
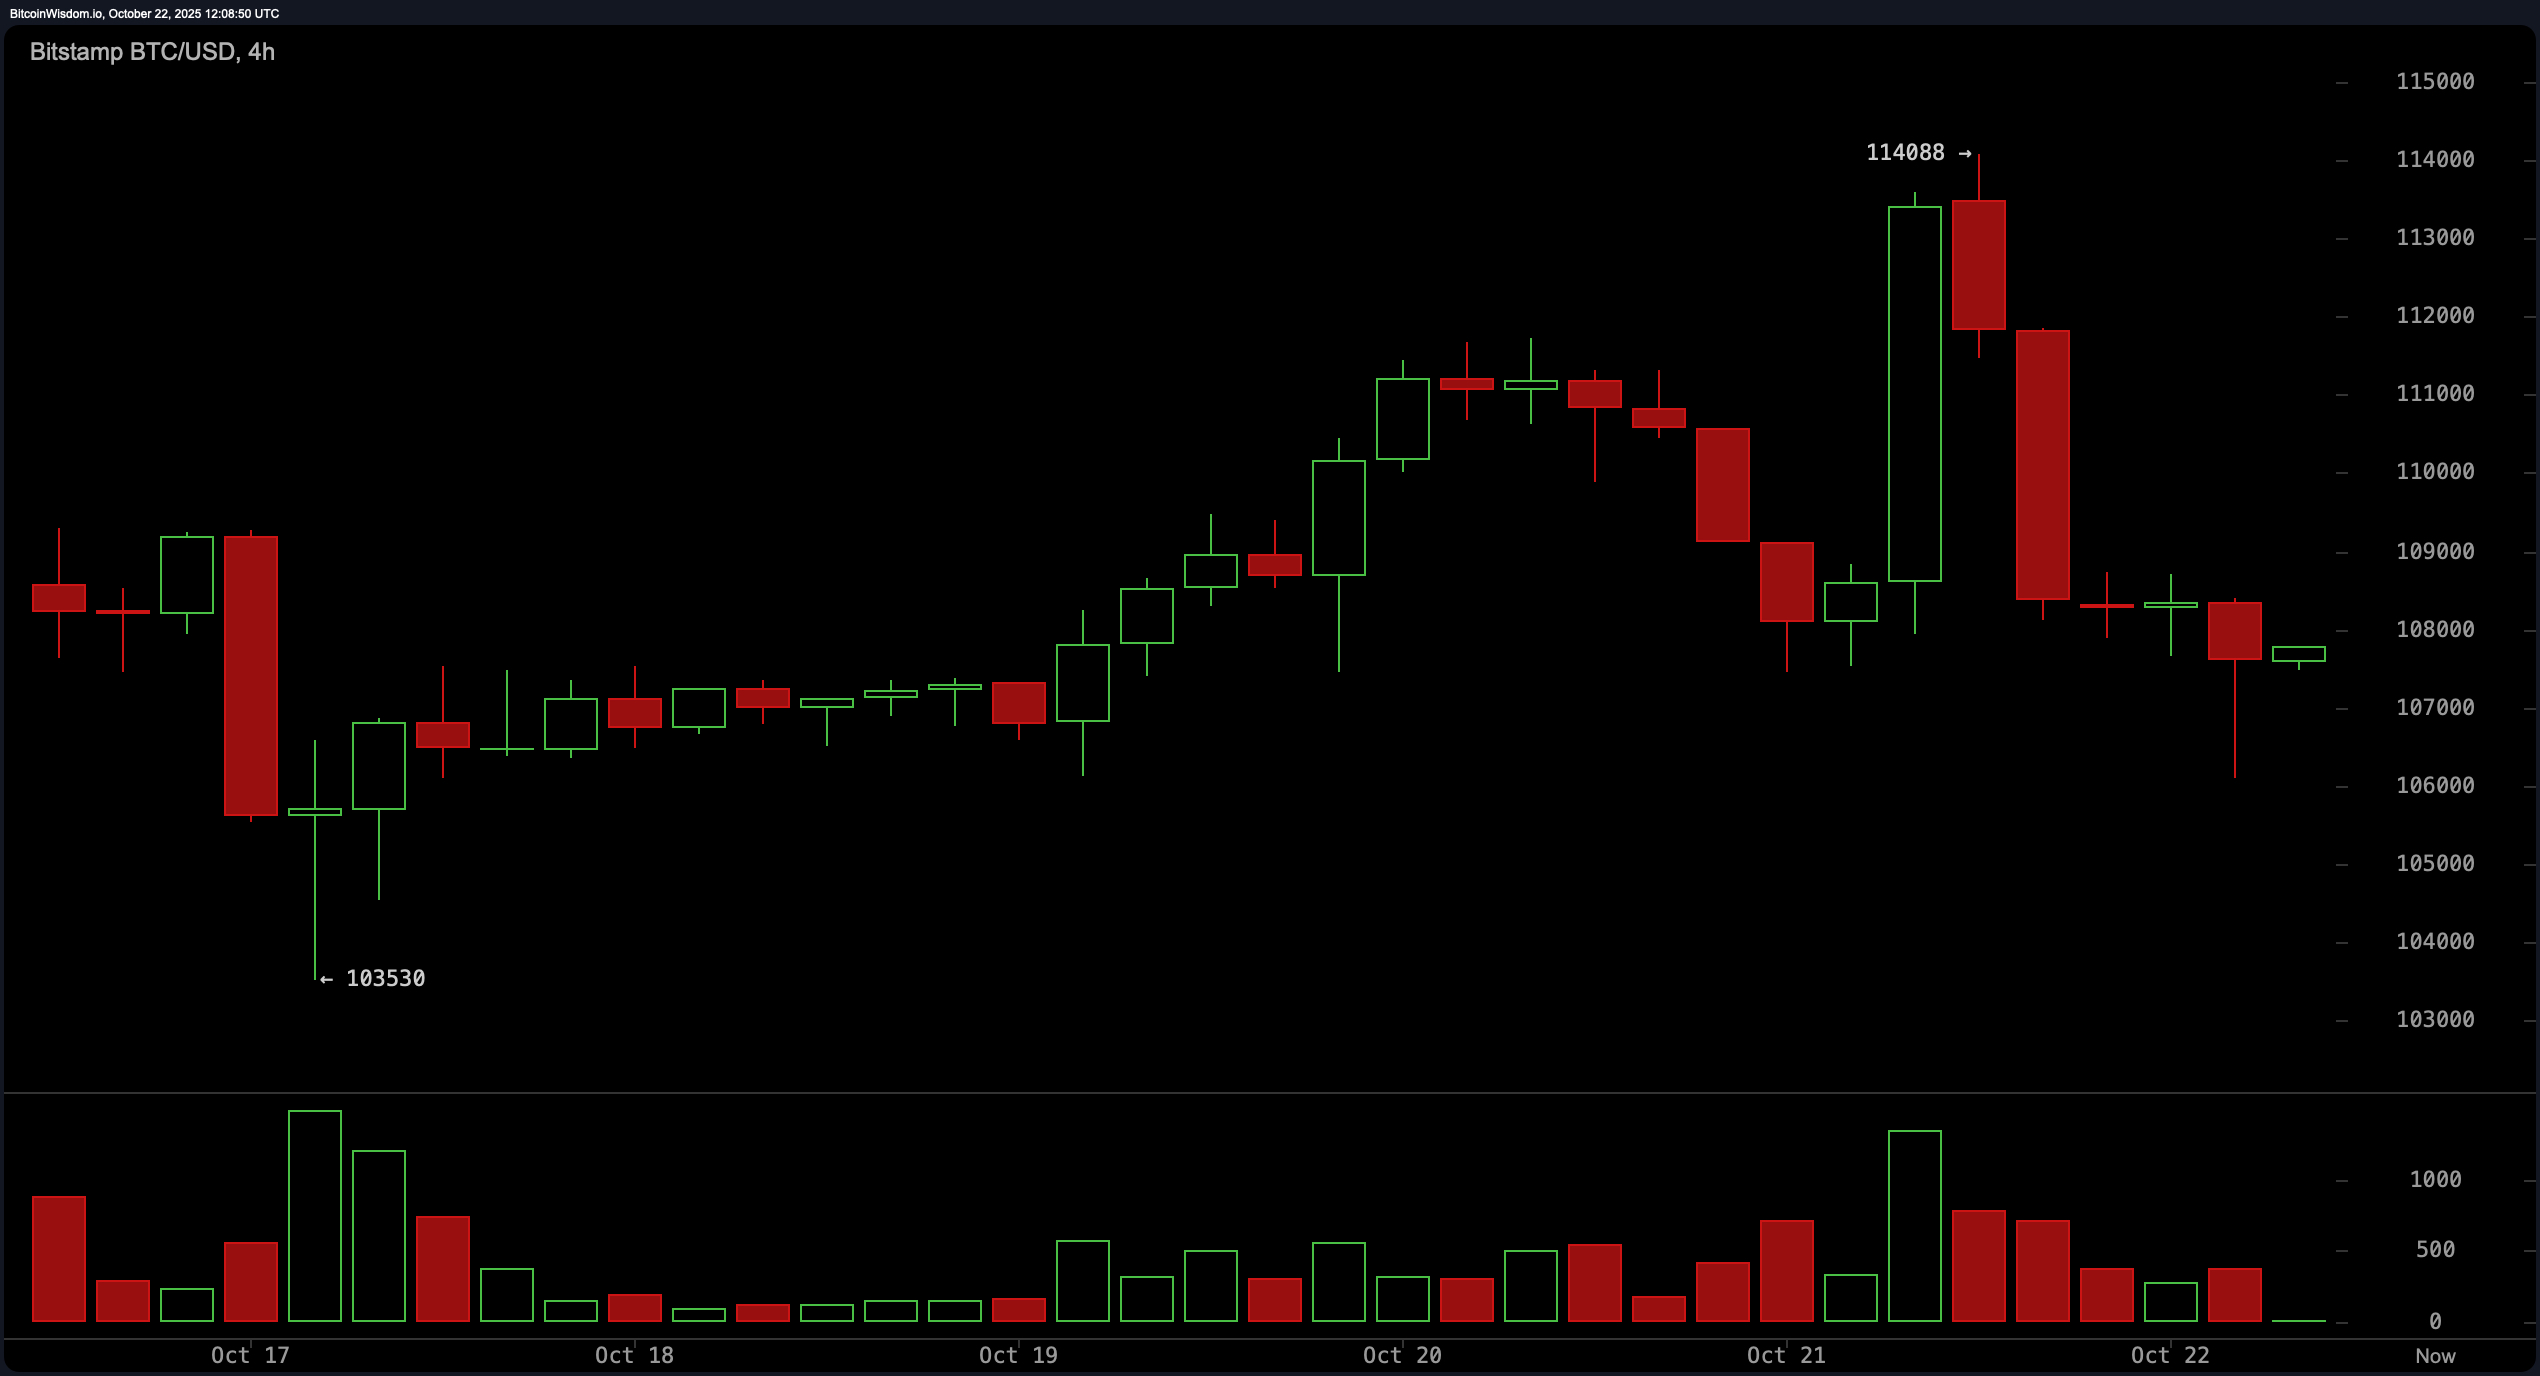
The four-hour chart adds salt to the wound. After an enthusiastic sprint to $114,088, bitcoin found itself winded and slipping into decline. The volume spike during the ascent was quickly eclipsed by even heavier red bars—classic distribution behavior. Traders hoping for strength found only weak green follow-throughs, indicating that buying interest lacks commitment. The relative strength index (RSI) sits at 40, the commodity channel index (CCI) lingers at −87, and the Stochastic oscillator is lounging at 25—all neutral but directionless, like a compass in a magnetic storm.
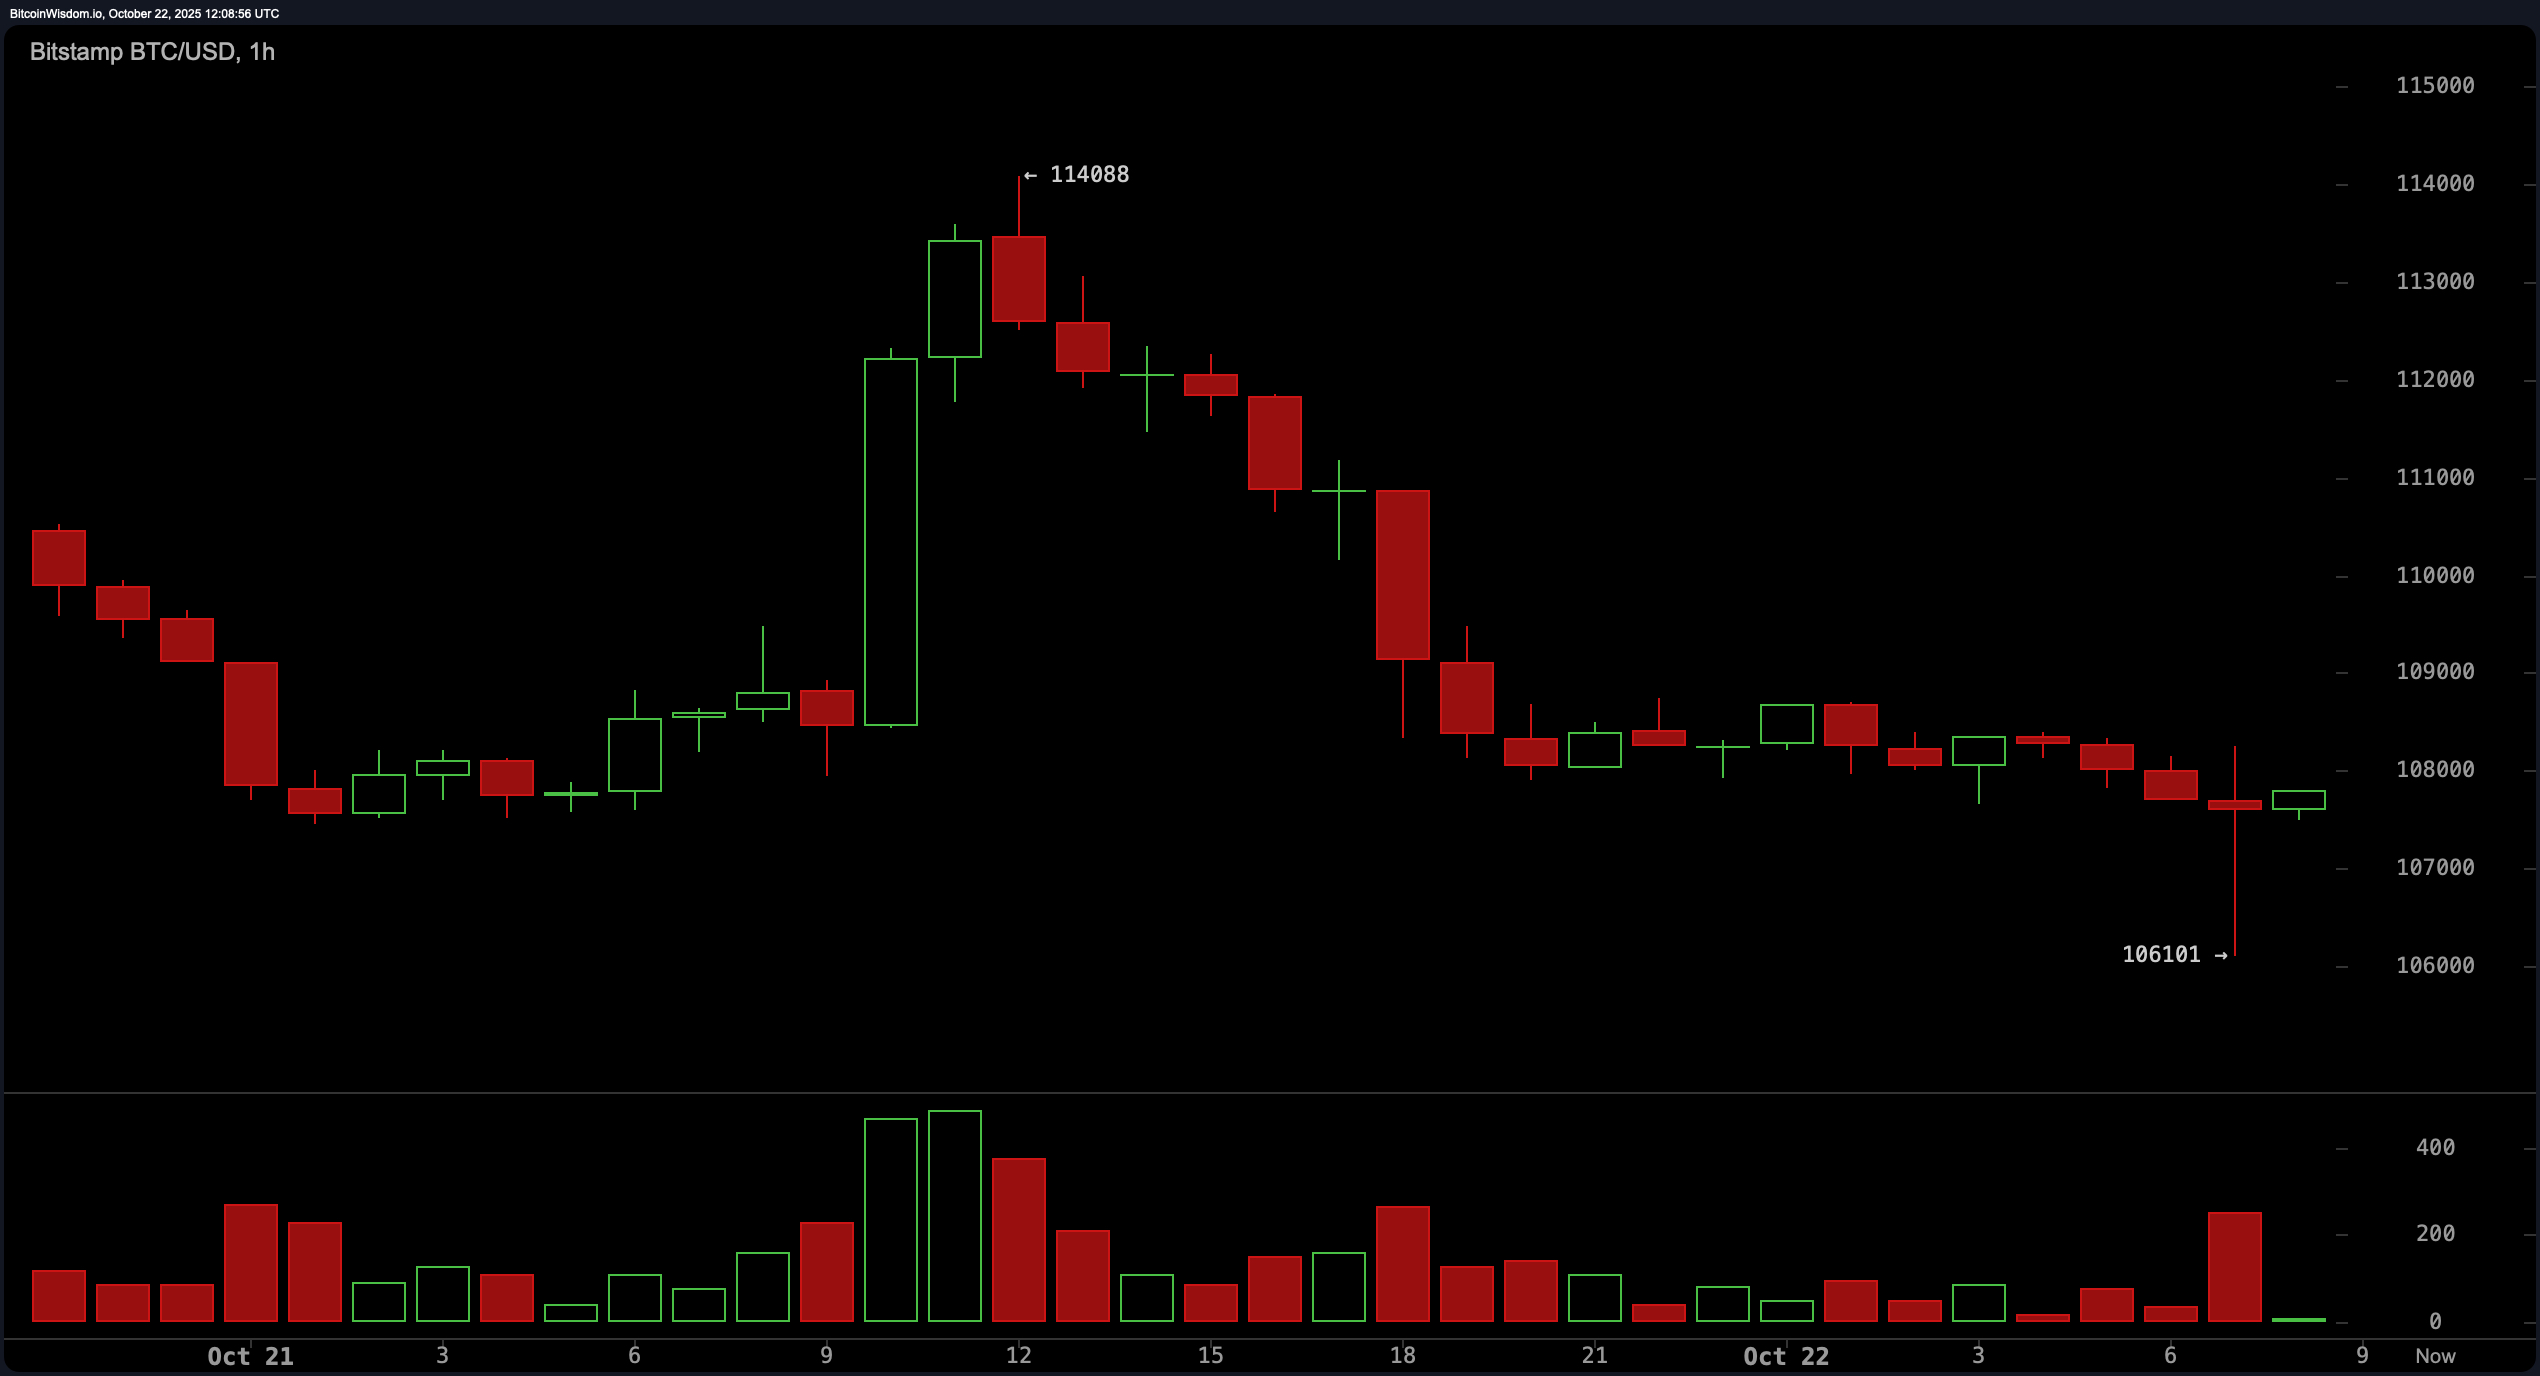
Zooming in to the one-hour chart, we see bitcoin tiptoeing around $107,000 to $108,000+ in a sideways shuffle, forming lower highs and lows. An attempted breakout at $114,088 was met with a bearish candlestick tantrum—long upper wick followed by aggressive red candles—suggesting a classic stop hunt. The Awesome oscillator is in the red at −5,871, echoing the current lack of momentum. Support is thin but still intact near $106,000, which could act as a springboard if buyers manage to show up with volume and conviction—two things currently missing from this scene.
And then there are the moving averages (MAs)—every single one of them pointing south like synchronized swimmers in a downward spiral. The exponential moving averages (EMAs) from 10 to 200 periods, including the 50-period EMA at 113,641 and the 200-period EMA at 108,098, are all signaling further downside. The simple moving averages (SMAs) are no friendlier, with the 100-period SMA sitting at 114,976, far above current price action. When even the 10-period SMA at 109,641 is waving a red flag, you know sentiment is leaning more toward capitulation than confidence.
In summary, bitcoin is locked in a short-term bearish phase with strong evidence of distribution at higher levels. The indicators are not whispering—they’re practically yelling: caution. Until price can reclaim territory above $110,000 with volume as its wingman, the path of least resistance remains downward. As always, let the charts do the talking—and right now, they’re throwing shade.
Bull Verdict:
If bitcoin can muster enough strength to reclaim the $110,000 mark with solid volume and a confirmed shift in structure, the bulls might just wrestle back control. Until then, any optimism is riding shotgun to confirmation—and hopium alone won’t cut it.
Bear Verdict:
With every major moving average tilted south and momentum indicators humming a bearish tune, the bears are firmly in the driver’s seat. Unless a sharp reversal with conviction arrives soon, expect further tests of the $106,000 and possibly $103,500 zones, where market nerves will truly be put to the test.
FAQ 🧭
- What is bitcoin’s current price? Bitcoin is trading at $107,610 as of October 22, 2025.
- Is bitcoin showing bullish or bearish signals?Technical indicators currently point to a short-term bearish trend.
- Where is bitcoin’s key support zone?Major support lies between $103,500 and $106,000.
- What level must bitcoin reclaim to regain momentum?A sustained move above $110,000 with strong volume is needed to shift sentiment.