Bitcoin is currently priced at $114,500, with a total market capitalization of $2.28 trillion and a 24-hour trading volume clocking in at $49.29 billion. The intraday price range stretched between $113,599 and $115,755, giving traders just enough rope to swing but not quite enough to lasso a breakout.
Bitcoin Chart Outlook
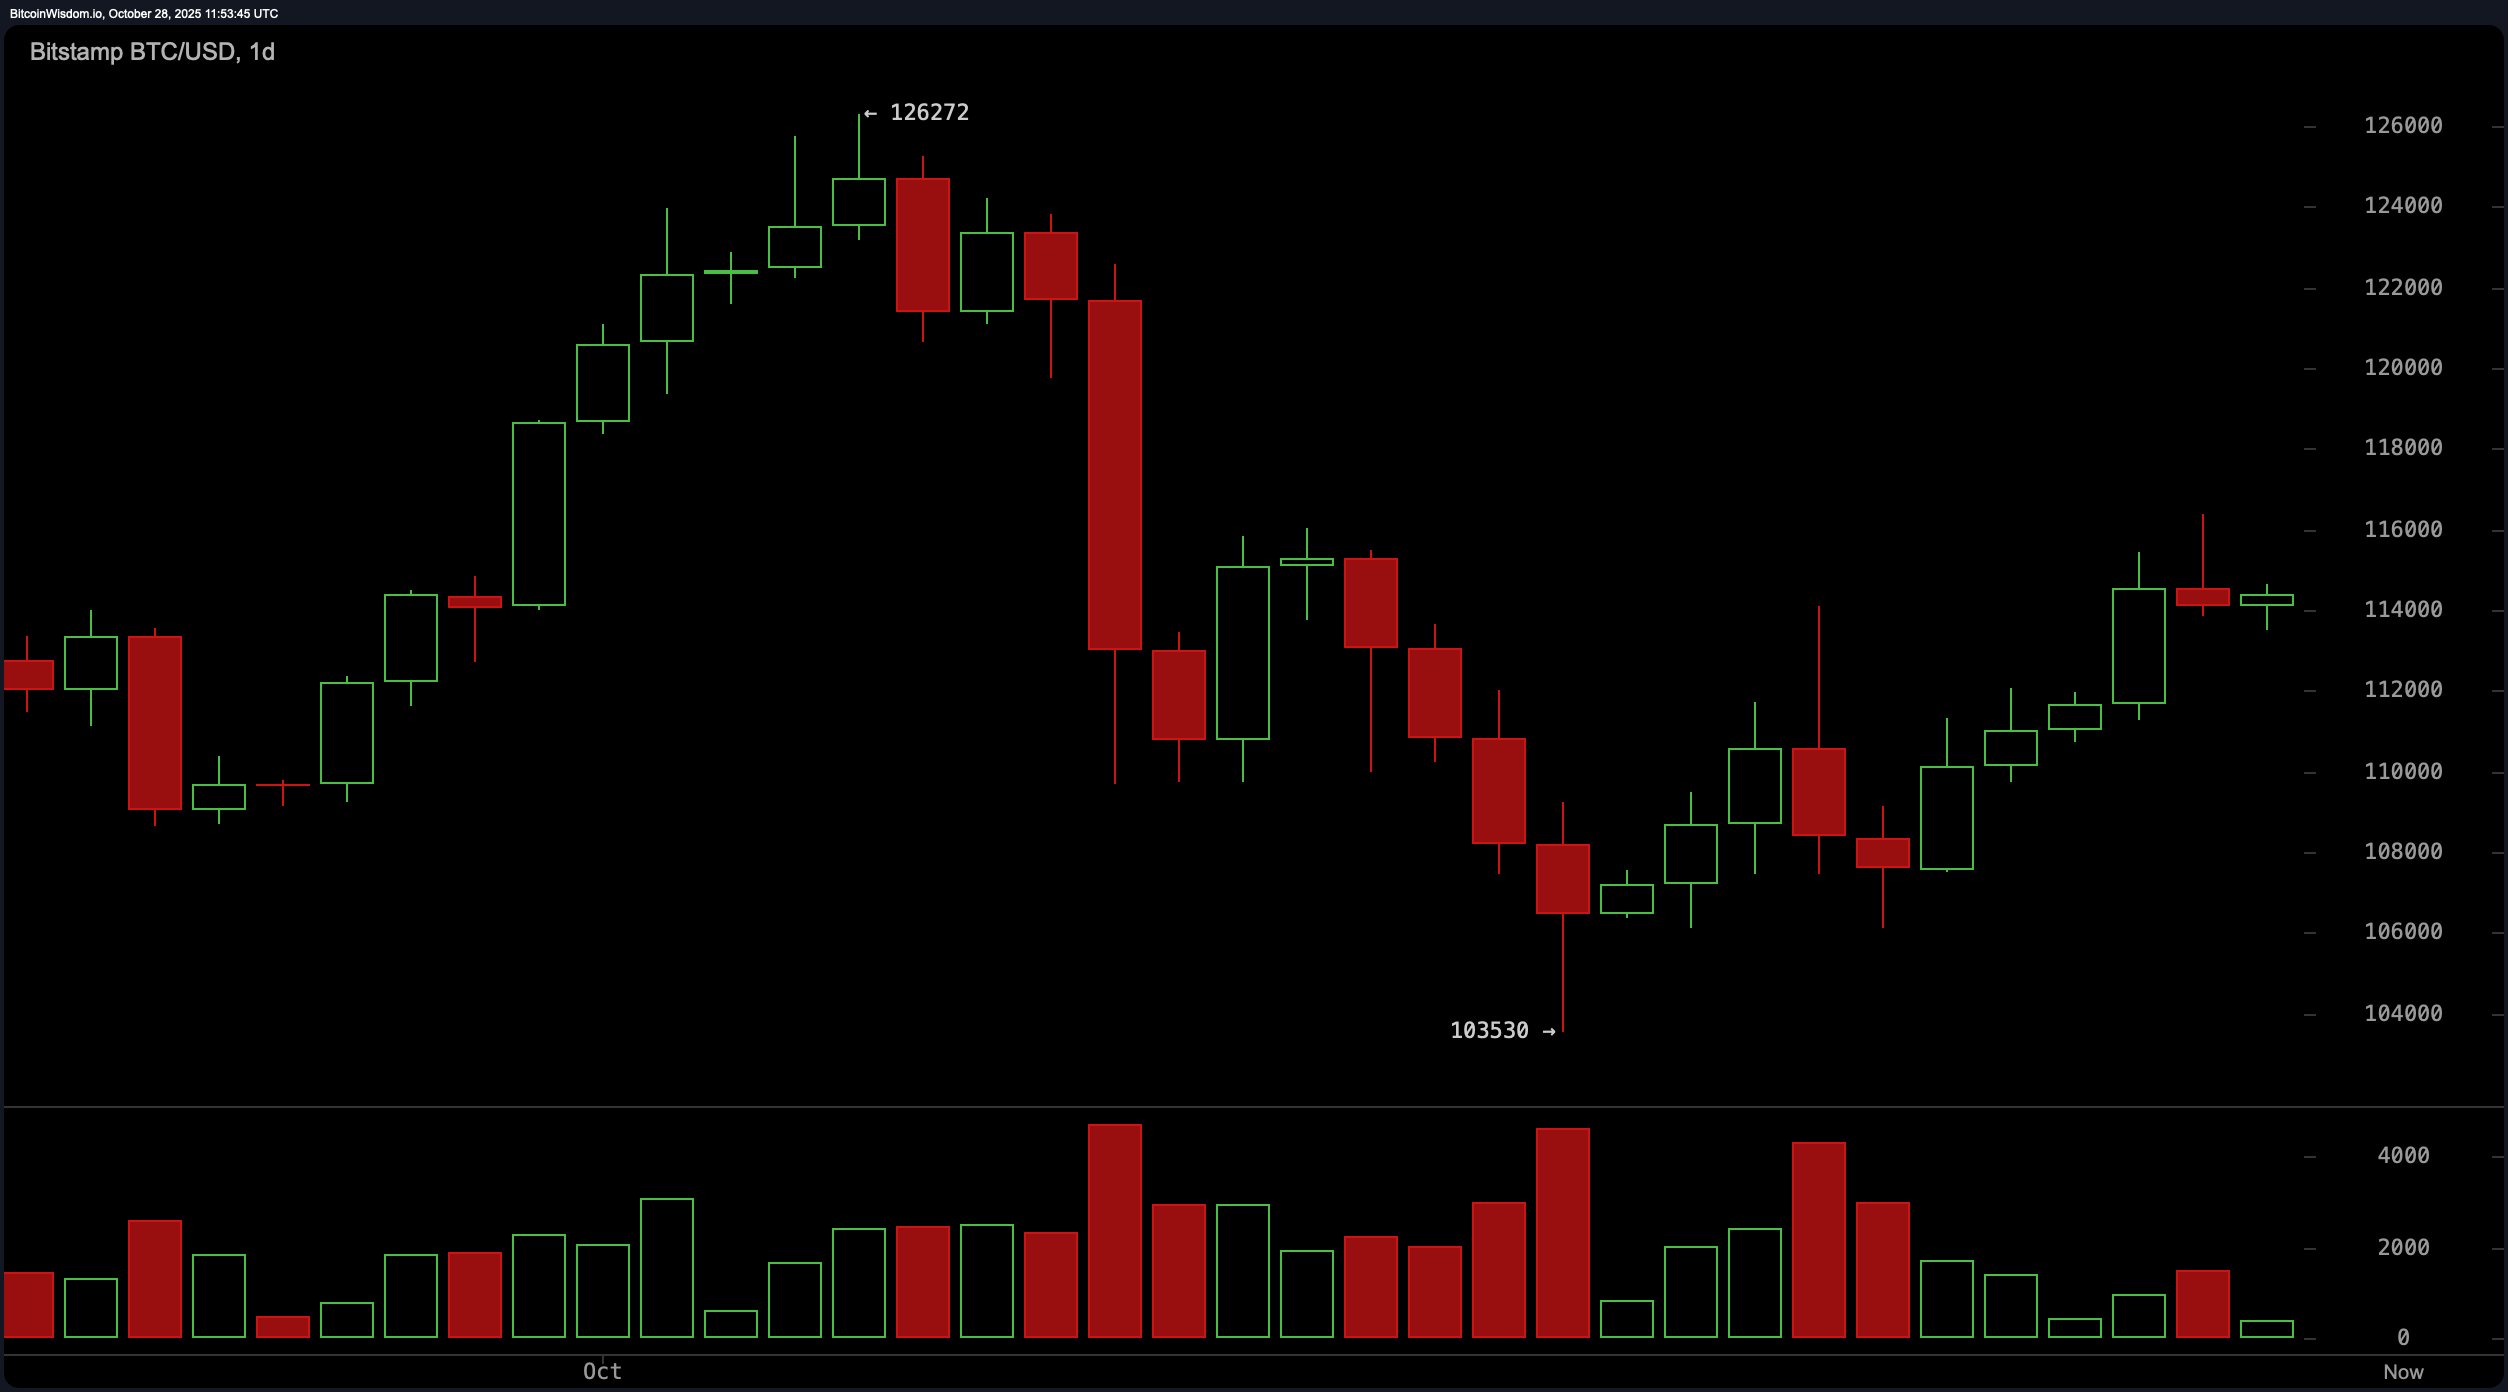
Starting with the 1-day chart, bitcoin is fresh off a mid-October nosedive that found its footing at approximately $103,530. Since then, the chart has quietly flirted with higher lows and steady closes, signaling a recovery narrative—albeit one written in pencil rather than pen.
A bullish confirmation is still hanging in the balance, with $116,000 acting like a velvet rope at the entrance to the next rally. Without a decisive push above that mark, the threat of a reversal looms, potentially dragging the price back toward the $110,000–$108,000 range.
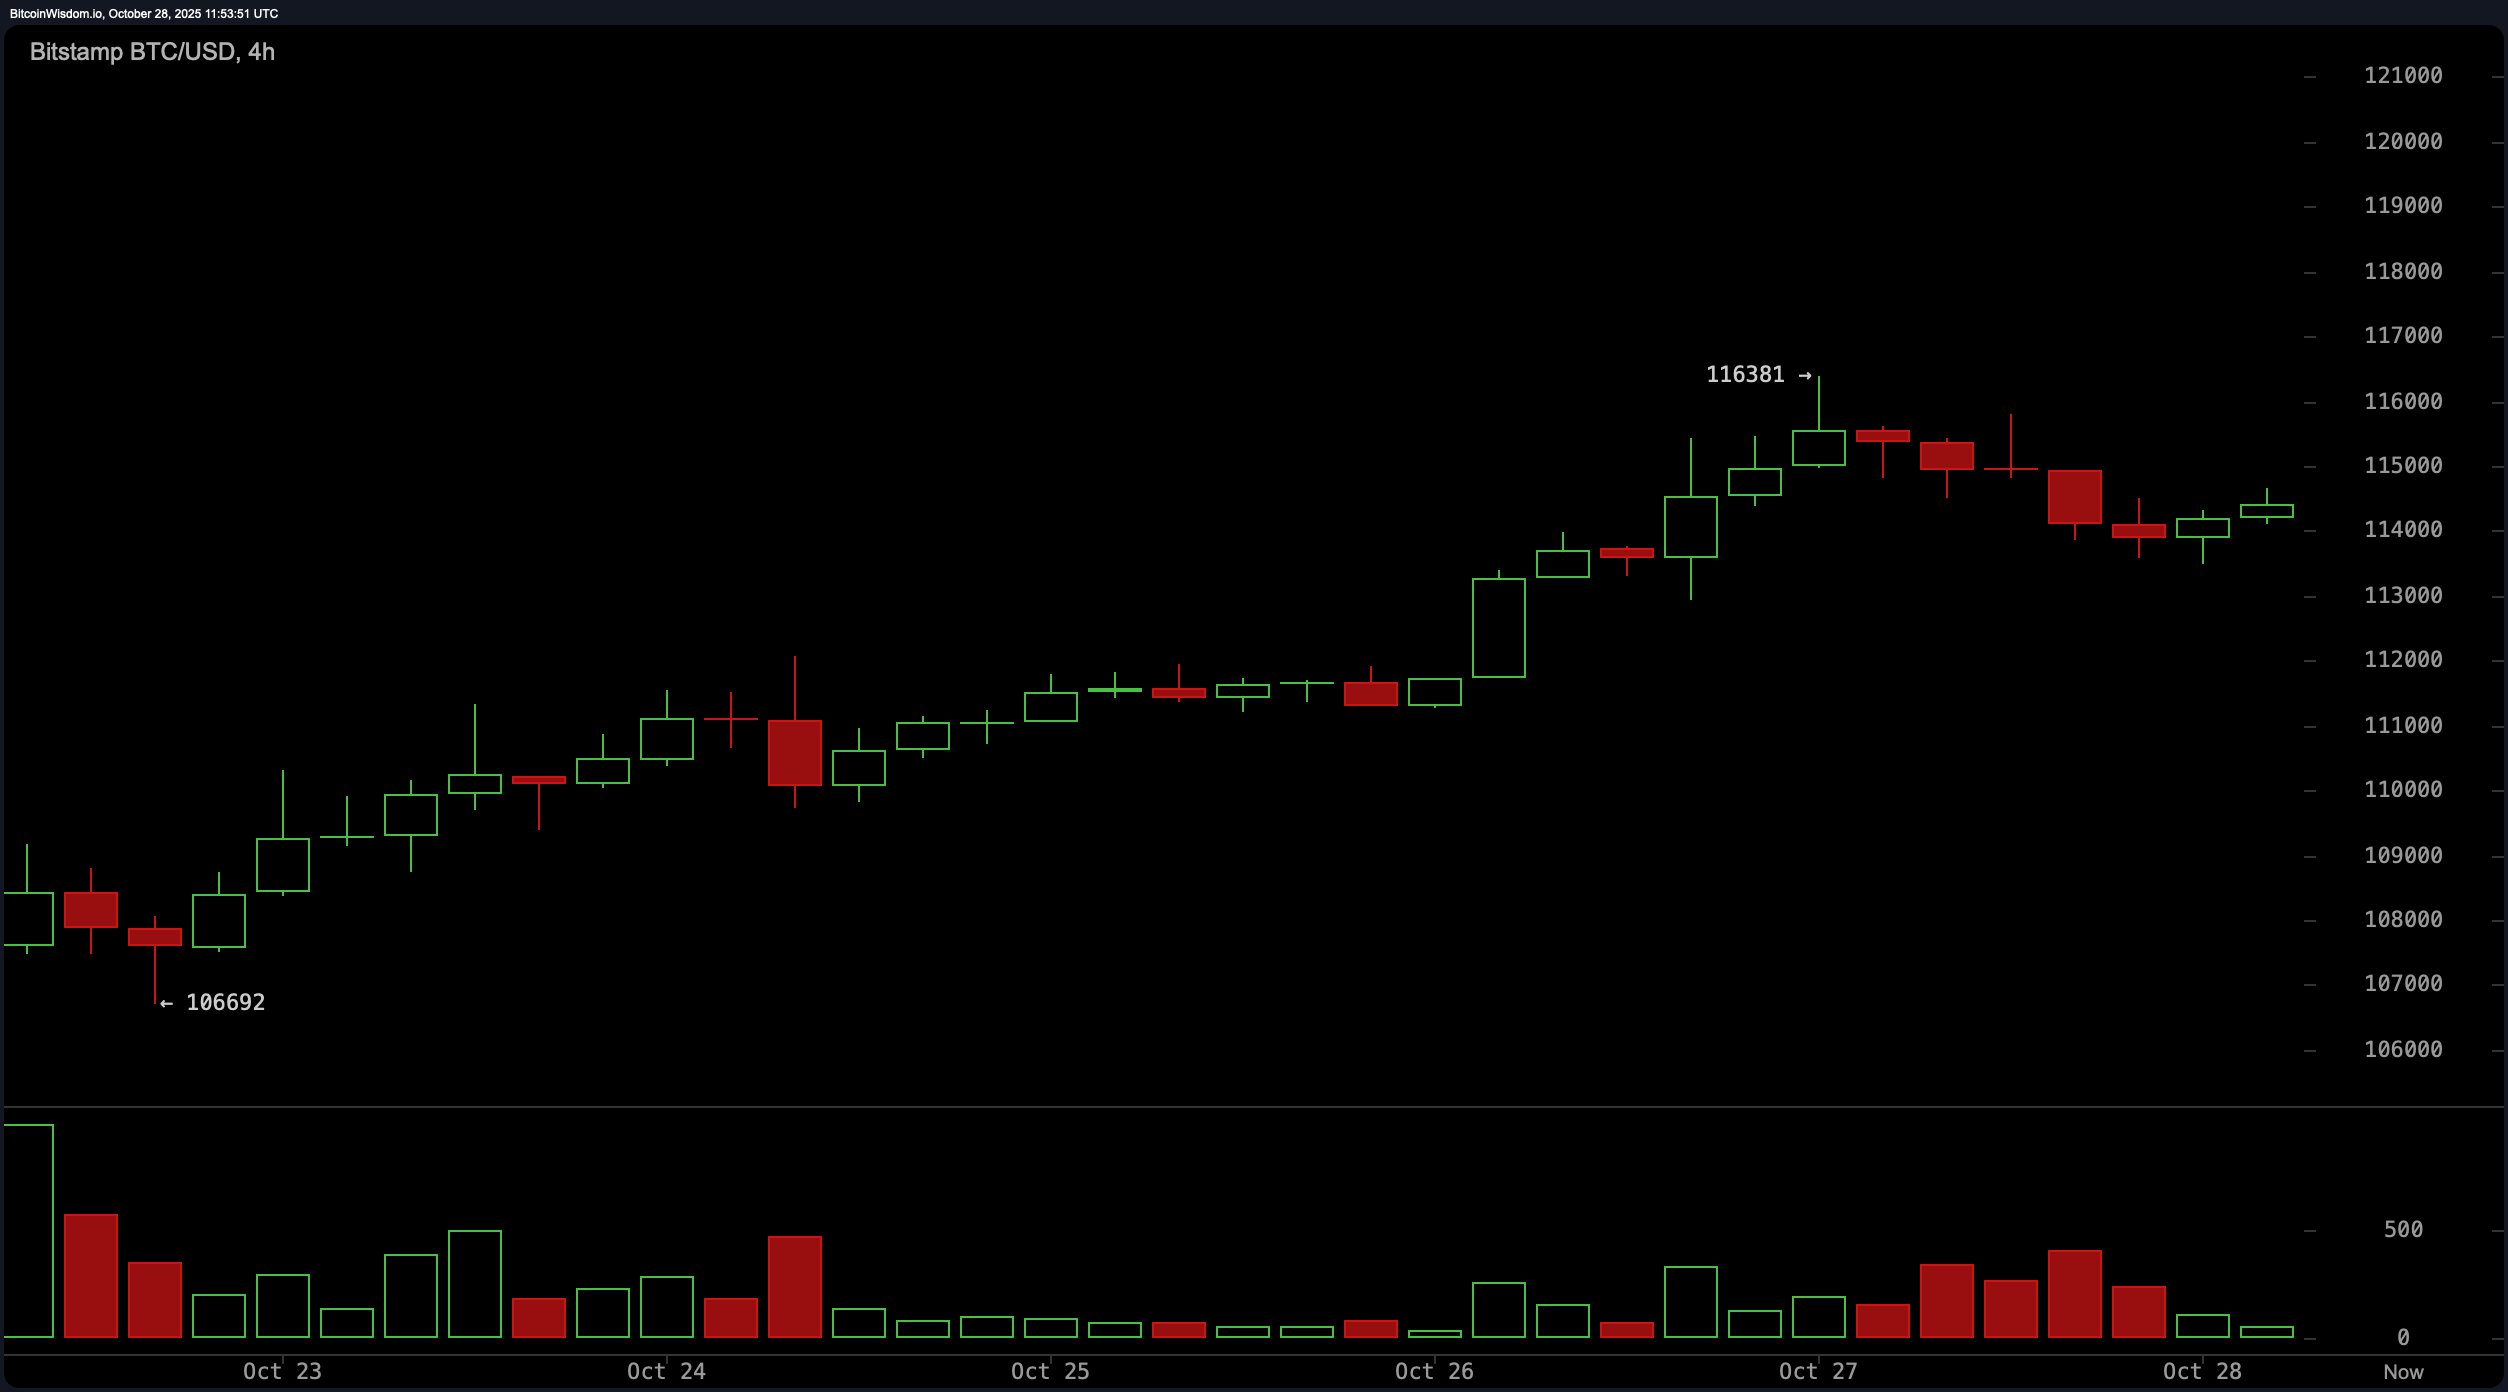
The 4-hour chart paints a more optimistic—but cautious—tale. A clear stair-step rally took shape after October 23, peaking near $116,381 before easing into consolidation. The price has hovered above $114,000 with small-bodied candles reflecting indecision—think of it as bitcoin checking its rearview mirror before merging into fast-moving bullish traffic. A retest of the $113,500 zone on high volume could indicate weakness, while a renewed surge past $116,400 might just put the turbo back into the trend engine.
Now zooming into the 1-hour chart, things look more like a tug-of-war. After peaking at $116,381, bitcoin pulled back to a low of $113,487 before staging a mild rebound. The short-term trend is showing classic lower highs and lower lows, hinting at a cooling period. Despite a valiant attempt to build bullish momentum above $113,500, the effort is lacking volume support. Until that changes, the lower time frame remains neutral at best, with potential upside only if $115,000 is breached convincingly.

Oscillators on the day are a study in ambivalence. The relative strength index (RSI), stochastic, commodity channel index (CCI), average directional index (ADX), and awesome oscillator all indicate neutral sentiment—like a poker table full of players holding nothing stronger than a pair of sevens. The momentum oscillator, however, registered a value of 7,194, hinting at short-term weakness, while the moving average convergence divergence (MACD) stands at −627, suggesting some underlying bullish divergence that’s trying to peek through.
Moving averages, however, are throwing out mixed signals with the flair of a Wall Street soap opera. All exponential moving averages (EMAs) from 10 to 200 days are bullish, with prices above each threshold. Simple moving averages (SMAs), however, are more skeptical, with both the 30-day and 100-day showing bearish action. It’s a tale of two trend lines—one hinting at underlying strength, the other cautioning against premature celebration.
In sum, bitcoin’s technical landscape on October 28 resembles a cautious climb, where bulls are grinding uphill but haven’t yet broken into a sprint. The next directional cue hinges on volume and a clean break above $116,000. Until then, the market remains in a holding pattern—ready, but not quite willing, to commit to its next move.
Bull Verdict:
If bitcoin bulls manage to reclaim $116,000 with conviction and volume, the macro trend could finally shift from cautious optimism to full-throttle momentum. With exponential moving averages across the board showing strength and the 4-hour chart still holding higher ground, a breakout could target the $120,000 level in short order—provided buyers stop flirting and start committing.
Bear Verdict:
Should bitcoin fail to defend the $113,500 support, especially on increased volume, bears could seize short-term control. Momentum is already faltering, and with simple moving averages flashing warning lights, a pullback toward $112,000 or even $110,000 is well within reach. The longer it lingers below $116,000, the more likely that this recovery stalls into yet another disappointment.
FAQ ⏱️
- Where is bitcoin trading right now? Bitcoin is hovering around $114,500 as of October 28, 2025.
- What price levels matter most today?Key levels include $116,000 for a breakout and $113,500 as critical support.
- Is the current trend bullish or bearish?The trend is cautiously bullish, but volume and confirmation are missing.
- What’s the short-term outlook for bitcoin?Sideways with upside potential—if $116,000 breaks cleanly.