Bitcoin is attempting a recovery after the recent shakeout, trading around the $105K mark. The bounce came after a steep demand downtrend, but it now faces strong overhead resistance and weakening on-chain participation. Buyers are stepping in, but the structure suggests the move might only be a relief rally unless follow-through volume steps up.
Technical Analysis
By Shayan
The Daily Chart
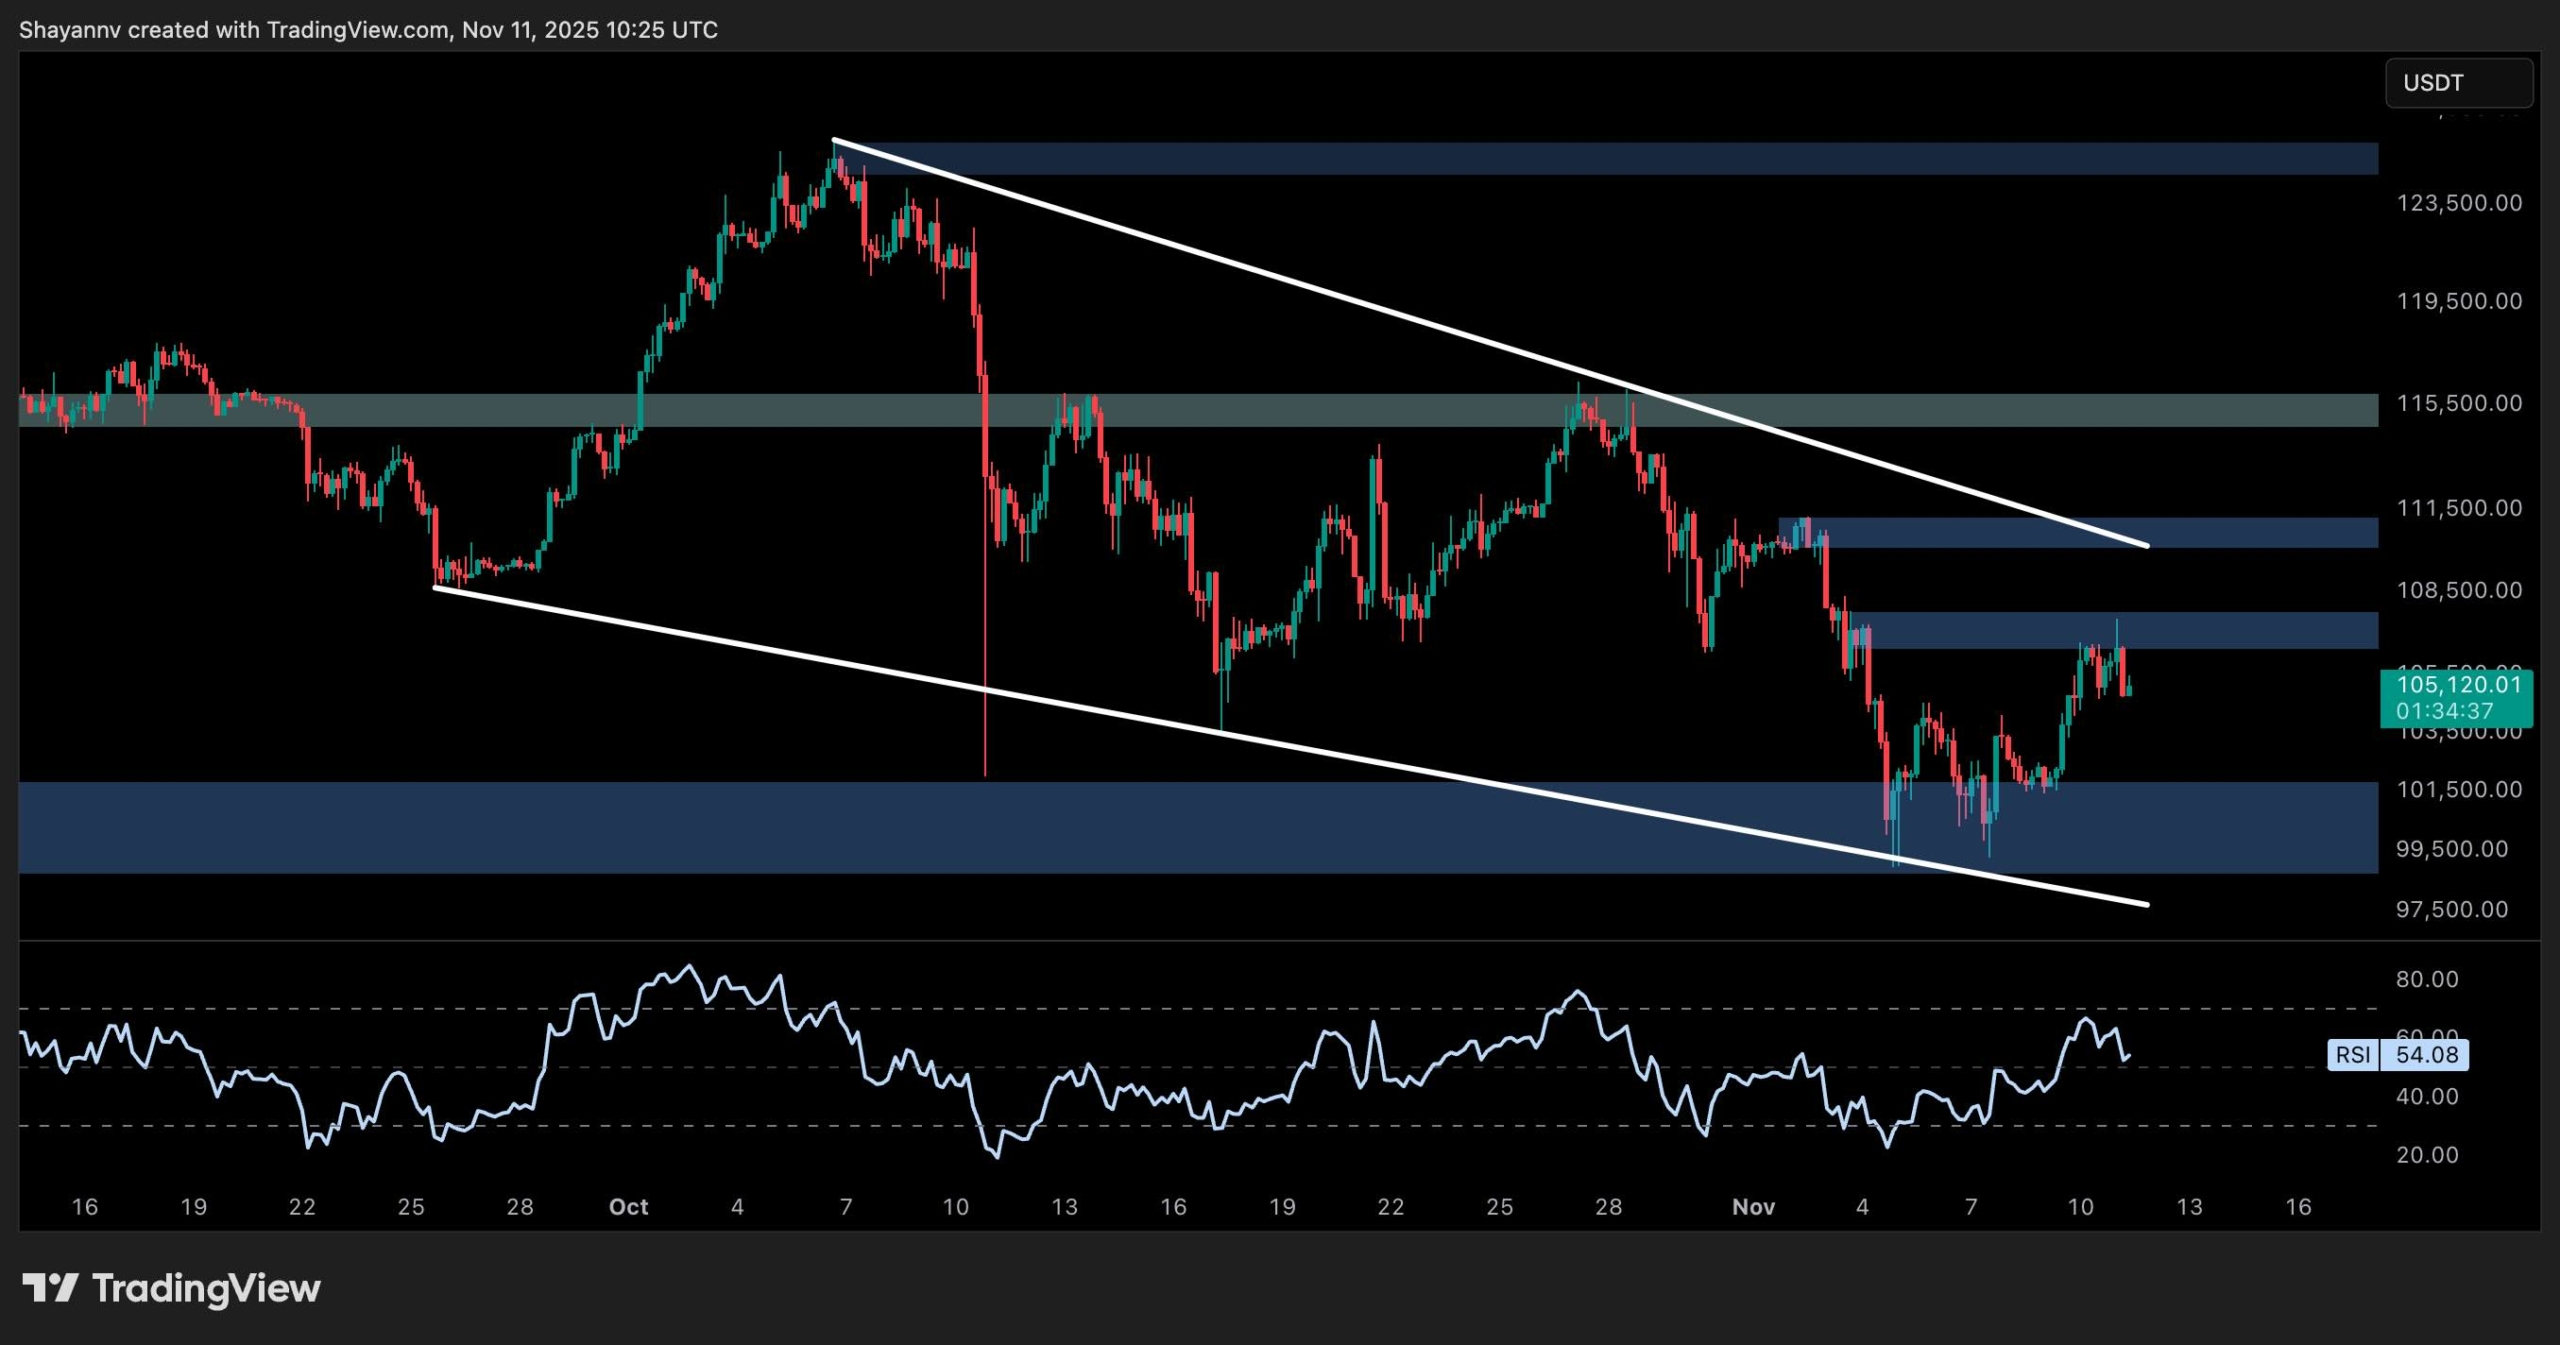
The daily chart shows price reacting from a major demand zone near $100K. After a strong rejection from the $114K region, BTC printed a lower low and is now retesting a previous breakdown level, turned into a significant supply zone around $106K–$110K. Both the 100-day (yellow) and 200-day (blue) moving averages have also flipped above the current price, turning into dynamic resistance.
Moreover, the RSI remains below 50, indicating weak momentum for now. If buyers can reclaim the $110K order block and hold above it, the next resistance lies around $114K. Meanwhile, failure to reclaim could push the price back into the $100K zone or even lower.
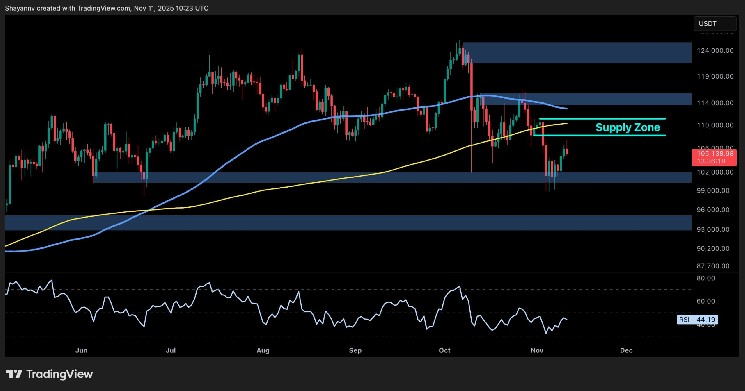
The 4-Hour Chart
The 4-Hour structure is unfolding within a falling wedge, which BTC is attempting to break from. The price has climbed back into a short-term resistance zone near $106K after a clean reaction from the $100K demand zone.
The RSI has also cooled off slightly after reaching near-overbought levels, showing signs of consolidation. A clean breakout above the wedge and a strong close above $110K would signal potential continuation. But if this zone rejects price again, another visit to the $100K level would be expected.
On-Chain Analysis
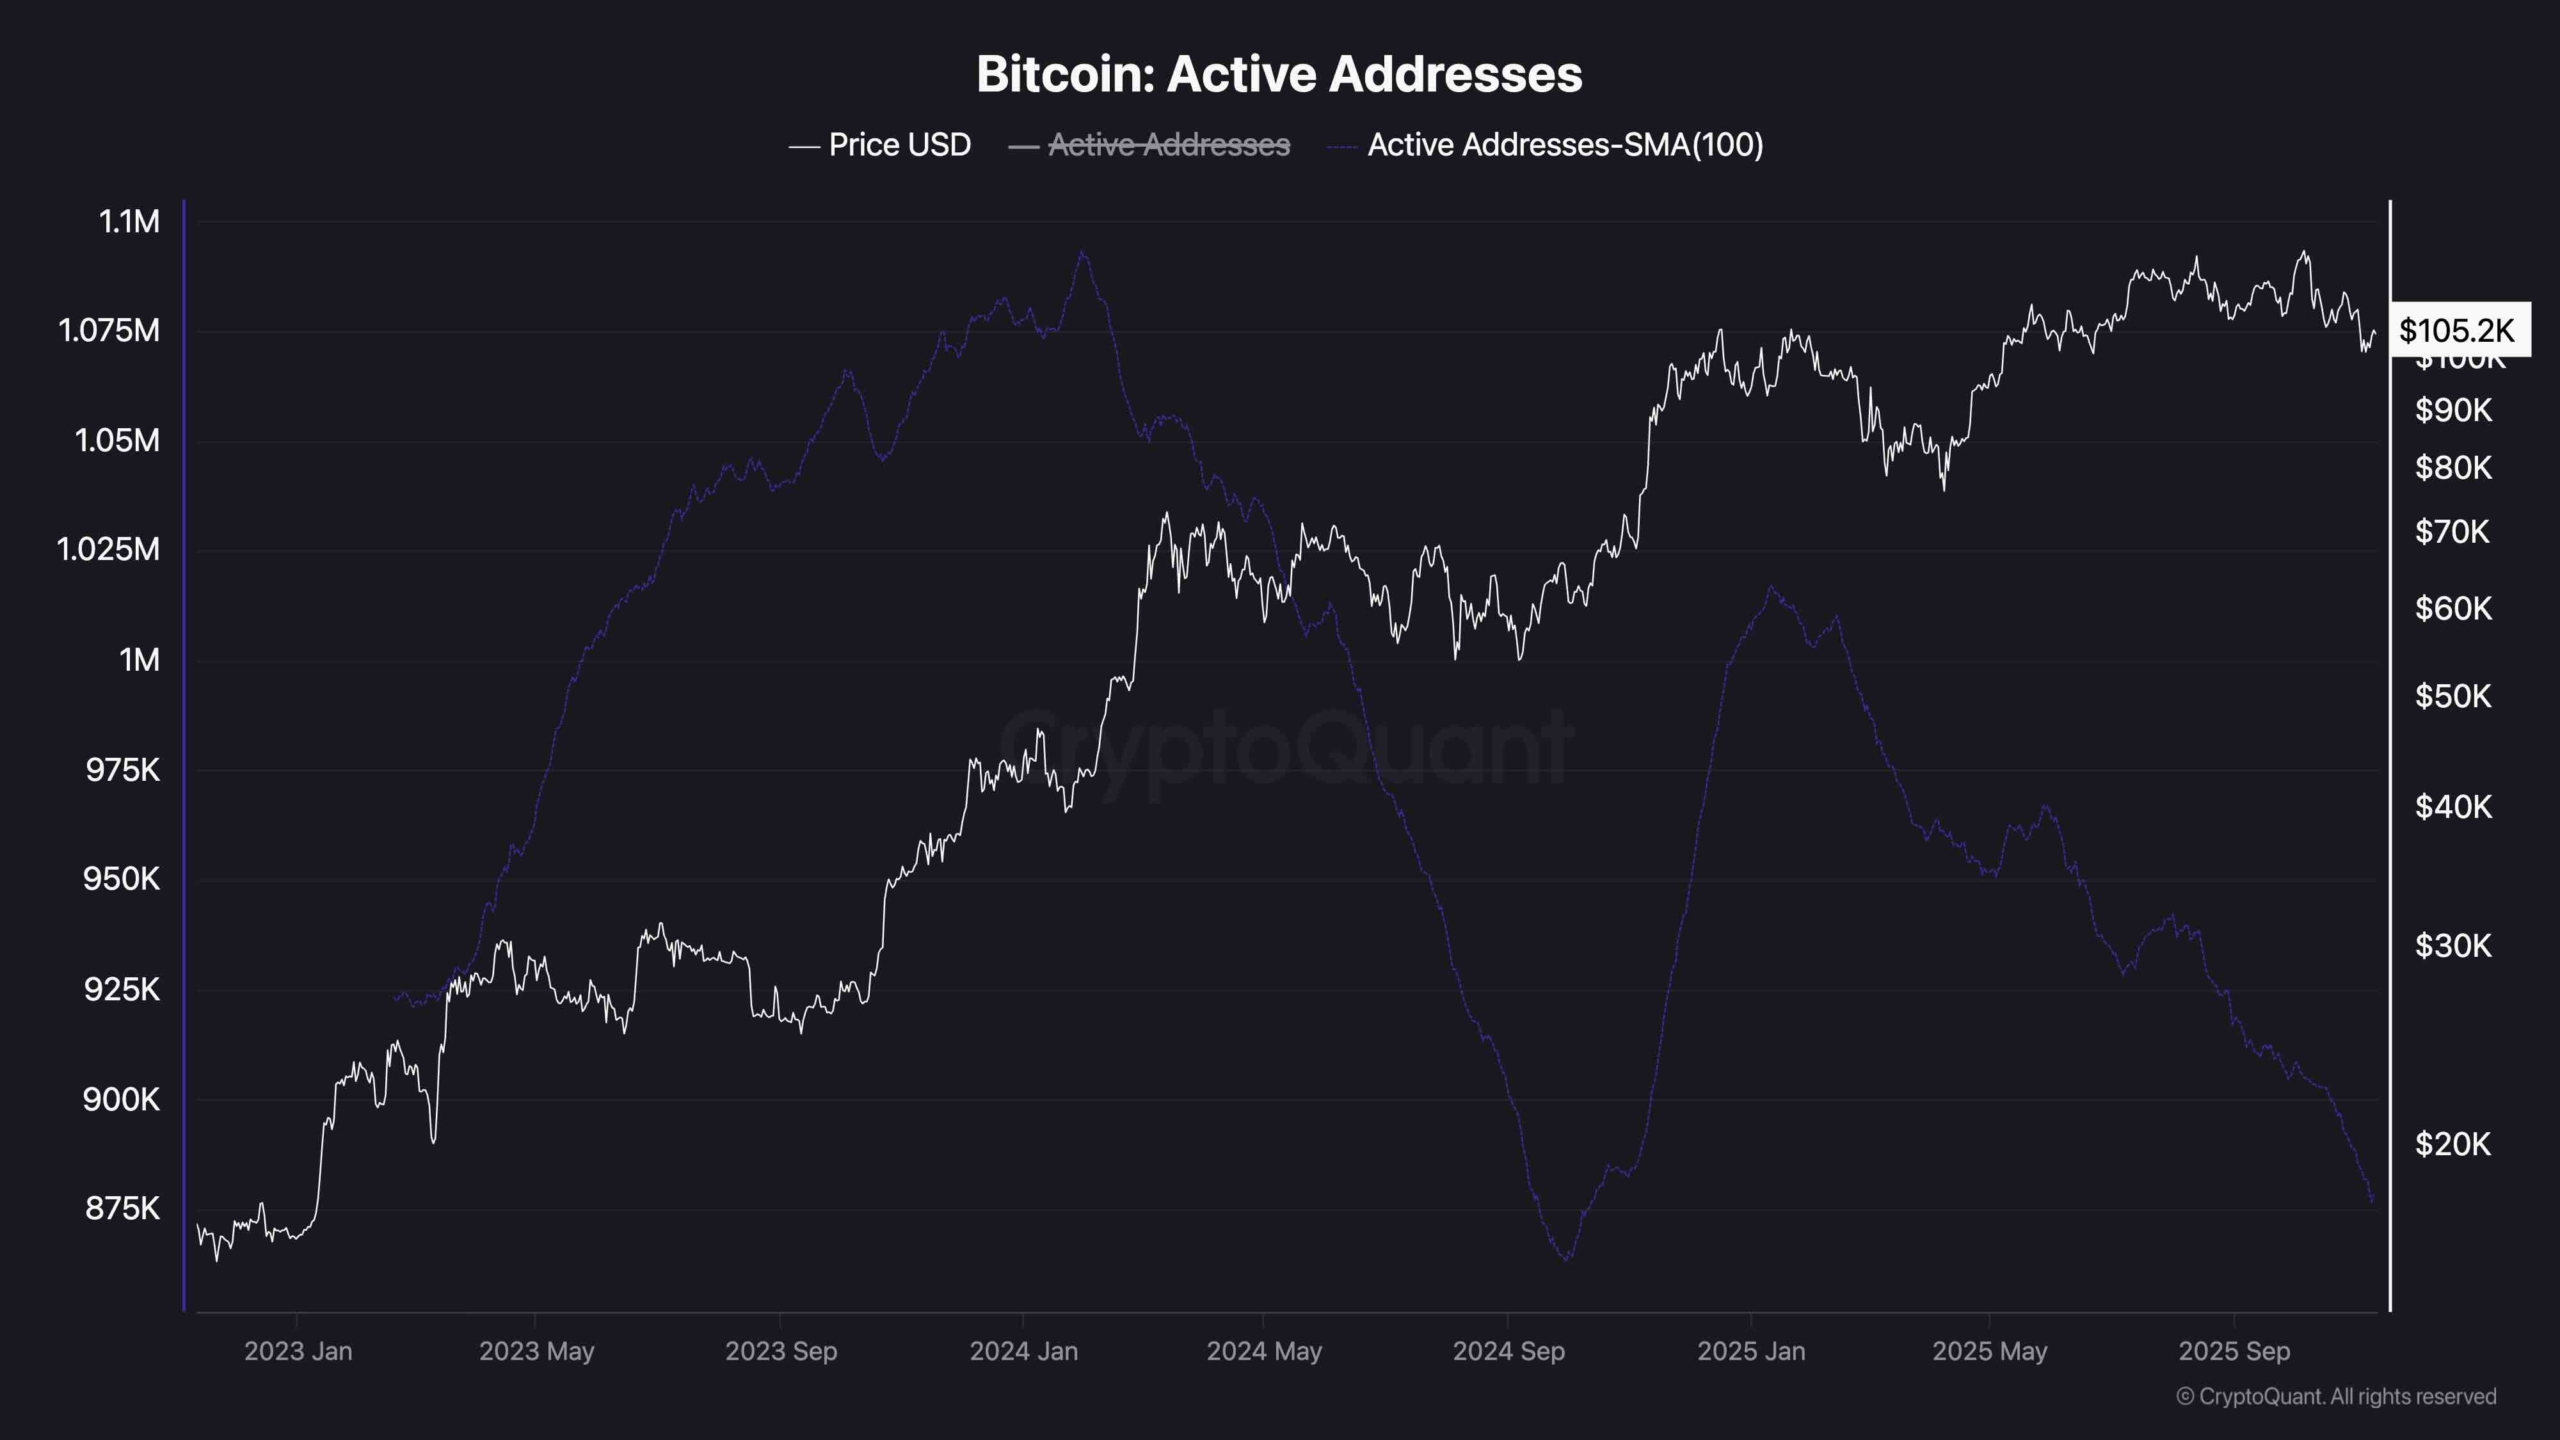
Active Addresses
On-chain data continues to show a concerning drop in active addresses. Despite BTC holding above $100K, the number of unique daily participants on the network has been falling steadily since early 2025. This divergence between price and network activity suggests that the current rally is not broadly supported by increased usage or transaction volume.
This kind of drop in active addresses is often a sign of weakening retail or organic demand. If this trend continues, it raises questions about the sustainability of the current price levels, especially if no new participants are entering the market.