Bitcoin has entered a sideways corrective phase, with investors taking profits and rotating capital into the altcoin market. As BTC cools off, the stage may be set for a potential altcoin rally in the coming days.
Technical Analysis
By ShayanMarkets
The Daily Chart
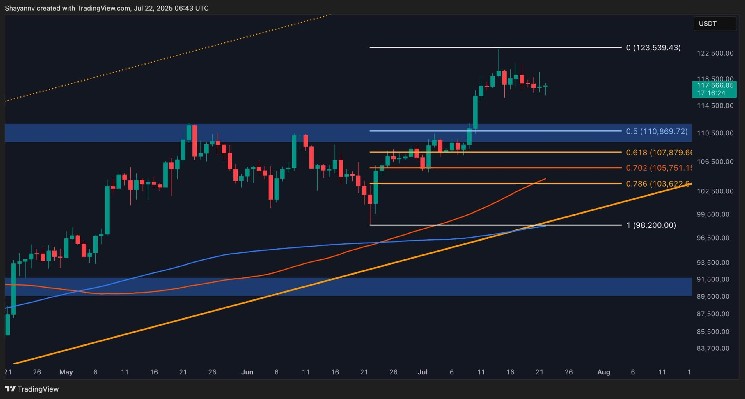
After facing strong resistance at the $123K level, Bitcoin has entered a corrective phase, likely driven by profit-taking and distribution among investors. Historically, when BTC cools down at its all-time high prices, capital often rotates into altcoins, sparking rallies across the broader market.
Currently, a pullback toward the key 0.5–0.618 Fibonacci retracement zone, located between $107K and $111K, appears likely before the next major bullish impulse. Until then, a period of consolidation is expected, potentially accompanied by notable strength in altcoins.
The 4-Hour Chart
On the lower timeframe, Bitcoin’s consolidation is forming a descending wedge pattern, a structure that typically signals bullish continuation. The price is now approaching a crucial support zone between $113K and $116K, aligning with the 0.5–0.618 Fibonacci retracement levels.
If this zone successfully holds and triggers a breakout above the wedge, a move back toward the $123K resistance becomes likely. However, if support fails, a deeper correction toward the $111K level may unfold.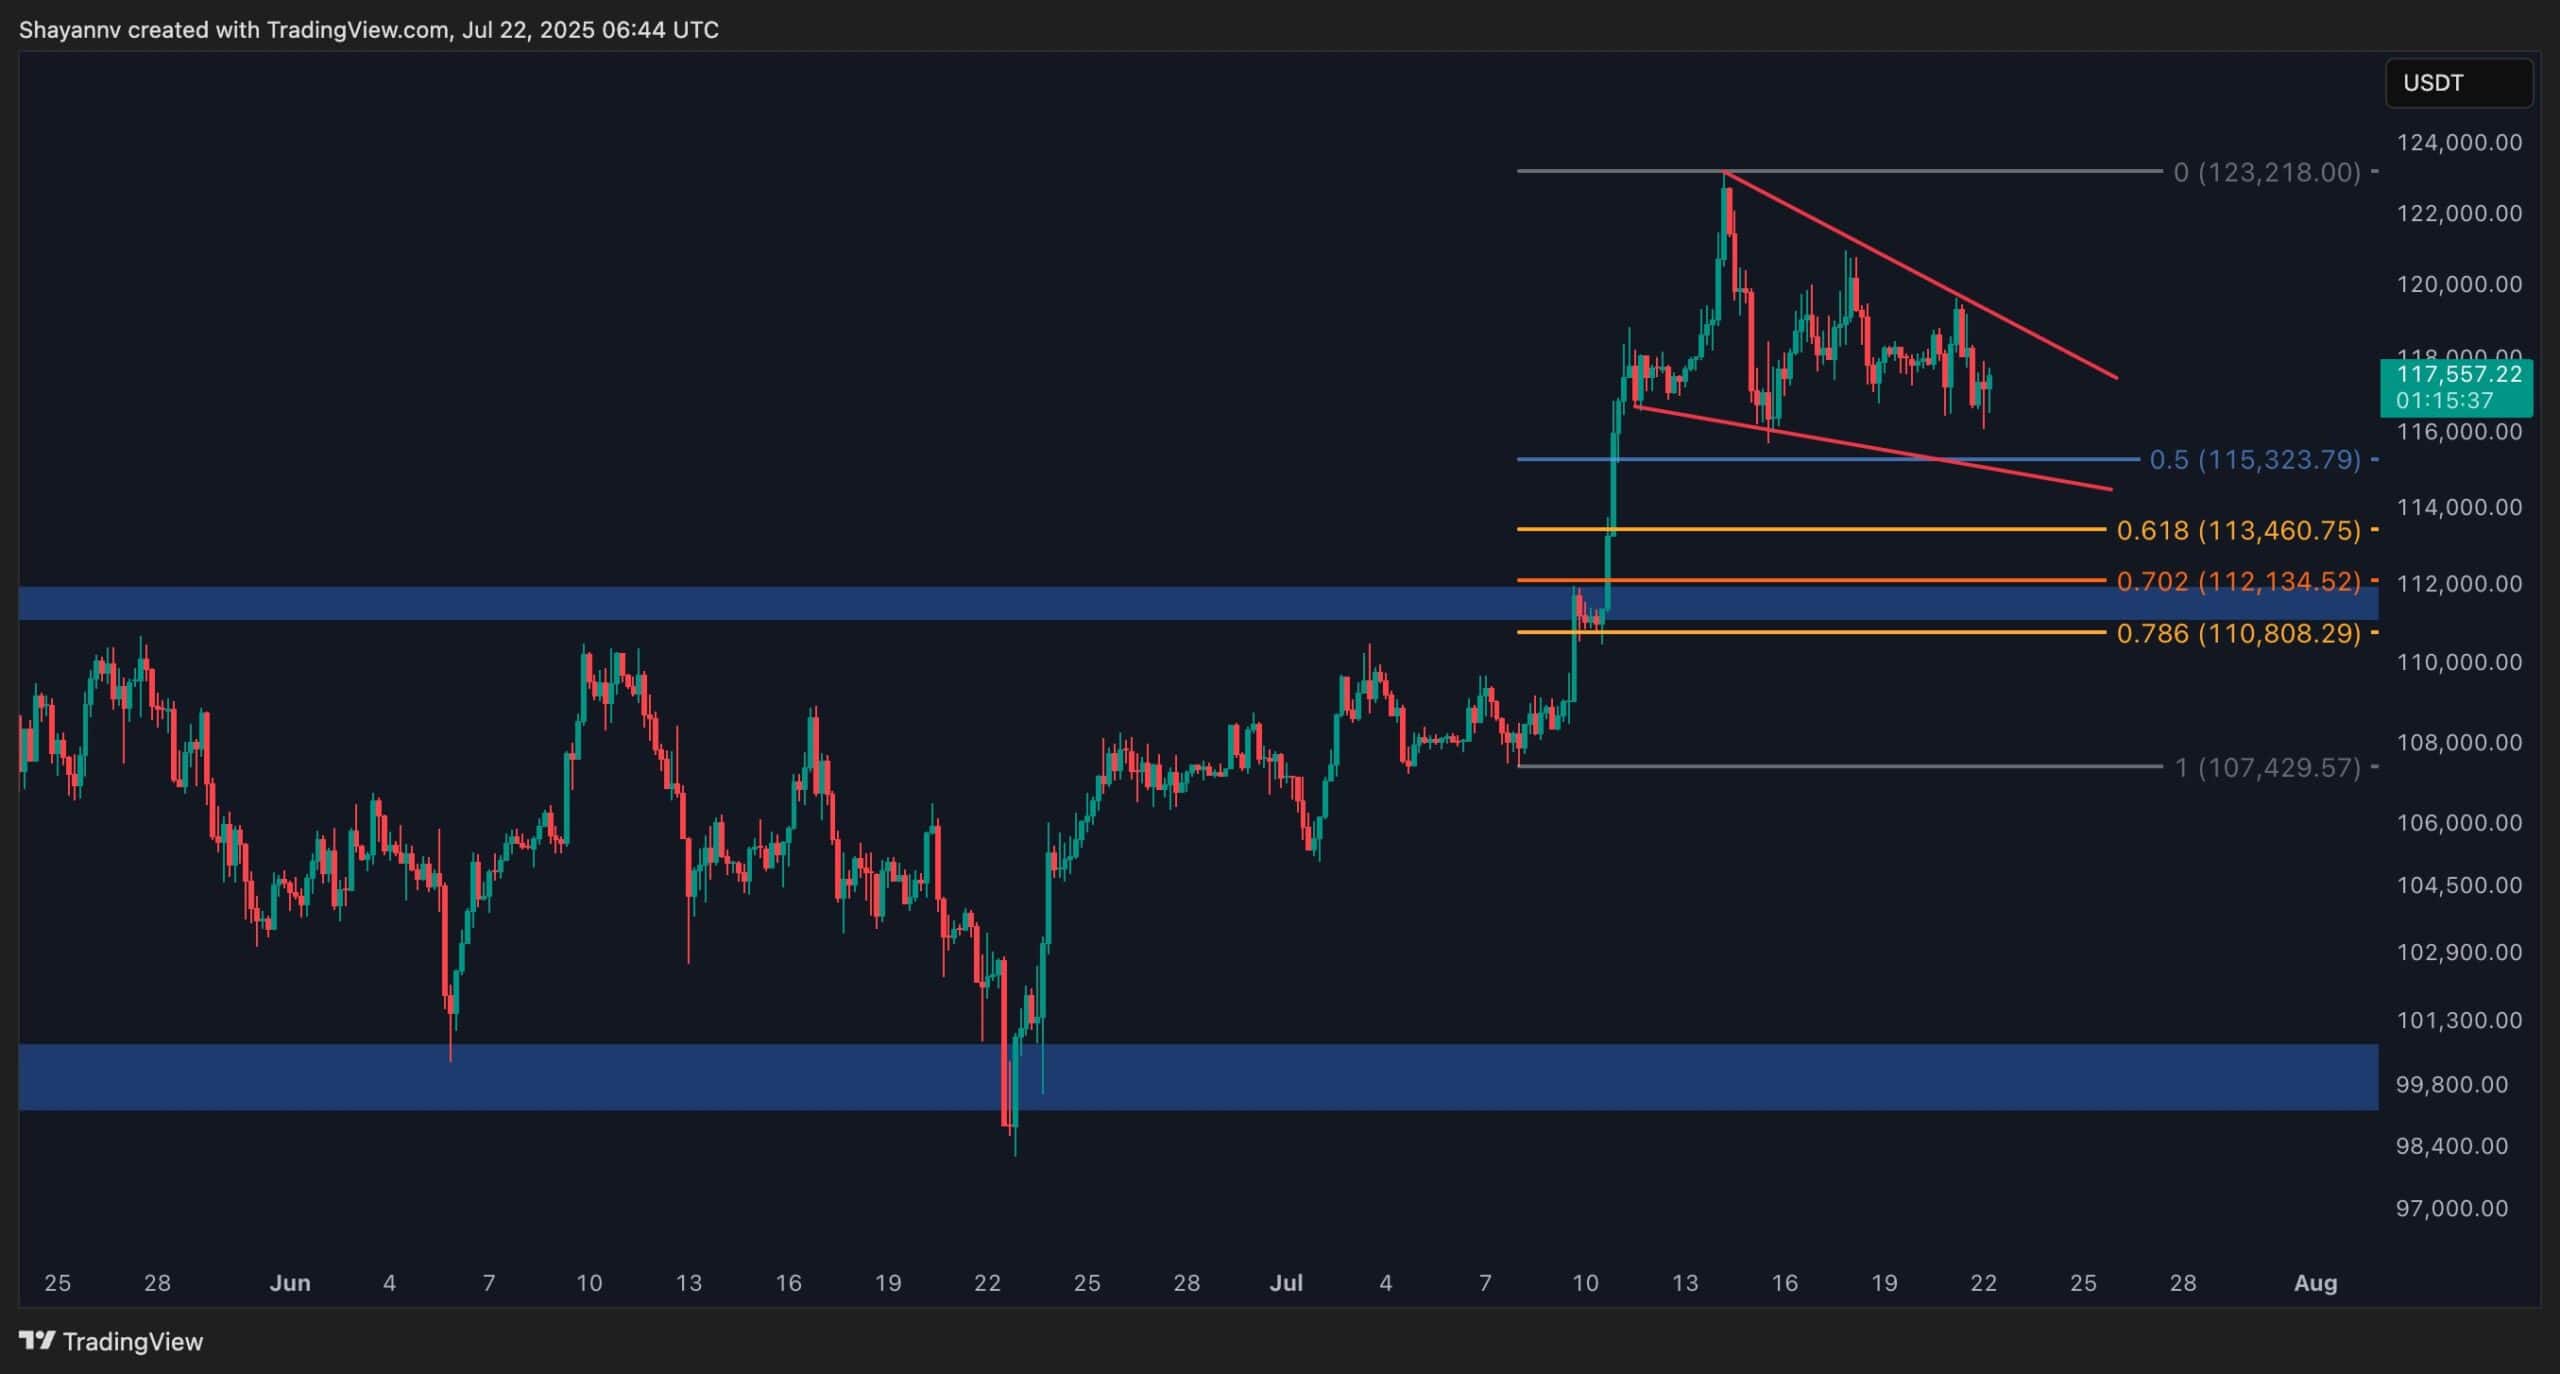
On-chain Analysis
By ShayanMarkets
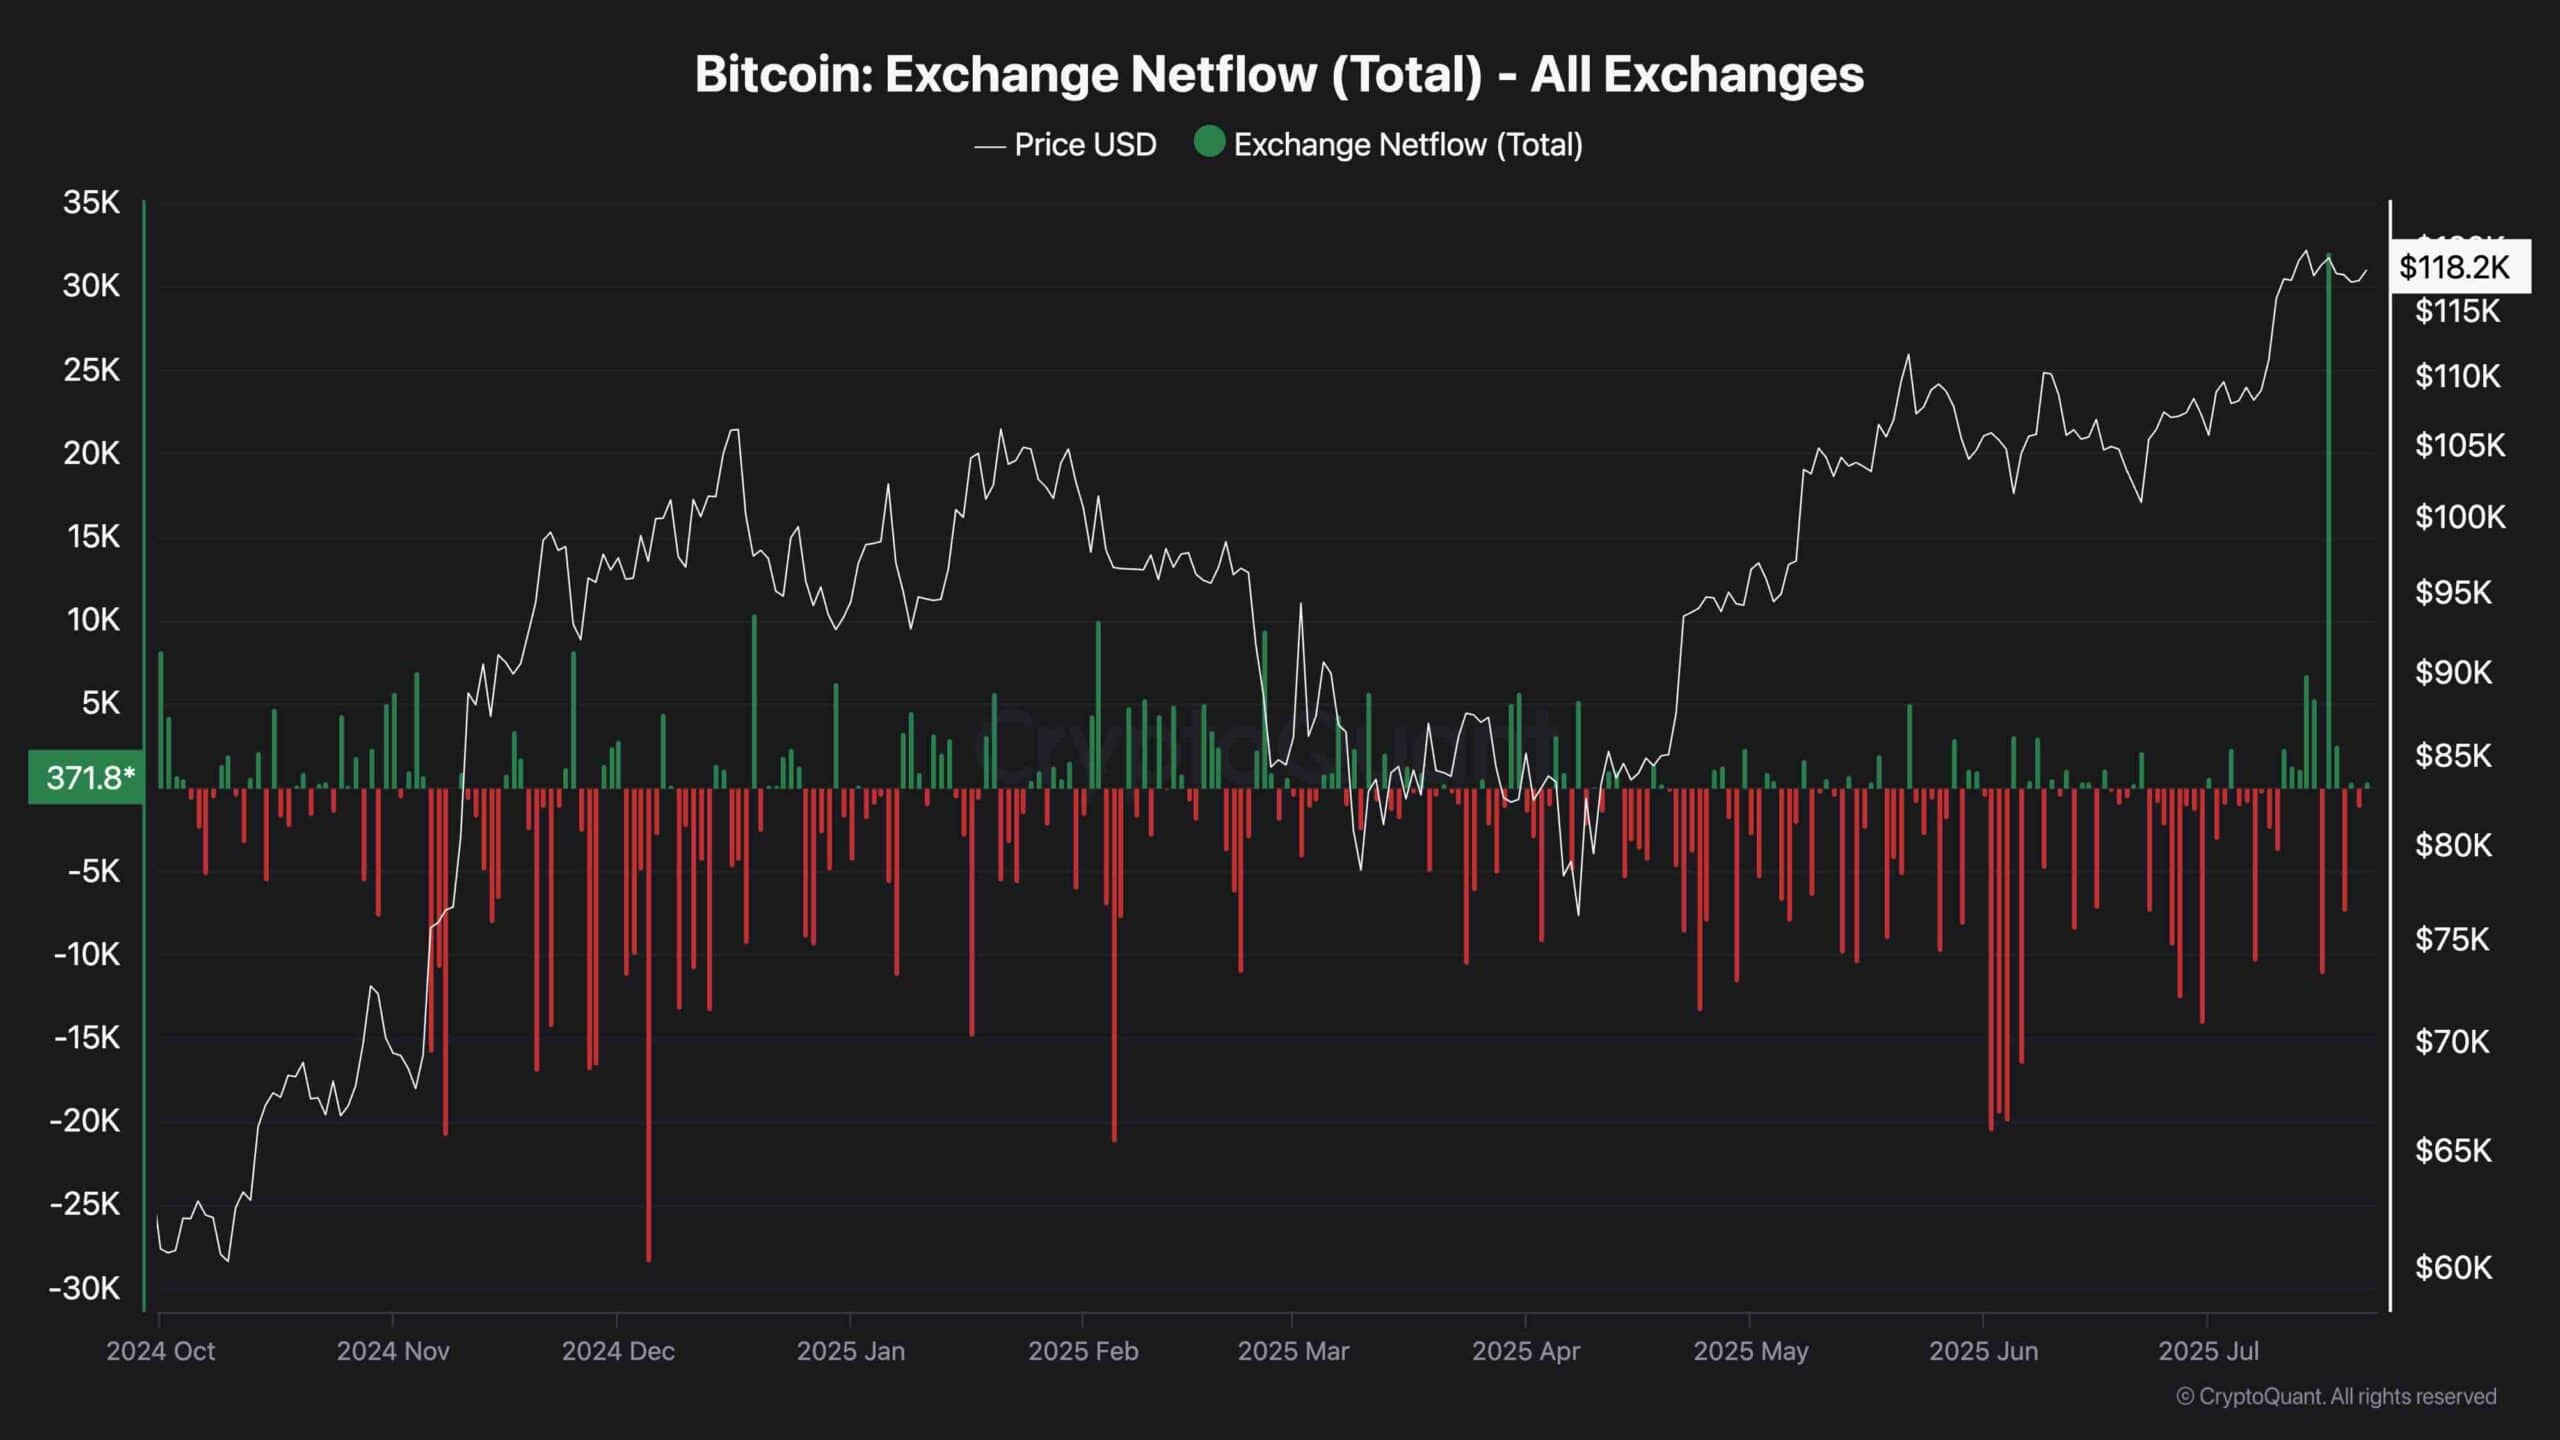
Bitcoin has seen its largest net inflow to exchanges since July 2024, marking a key shift in on-chain dynamics. Such inflows suggest increased distribution and profit-taking, as more BTC becomes available for trading.
Historically, similar exchange inflow spikes have often preceded deeper corrections. This week’s data hints that major players, potentially funds or institutions, are offloading BTC near all-time highs, managing their risk exposure.
However, this capital rotation could also fuel an altcoin rally, with demand flowing into alternative assets. As exchange supply rises, market volatility may increase, especially during demand surges. Traders should keep a close eye on this metric, as it could foreshadow the next major move.