Bitcoin is trading near $91,000, but the market setup has started to show one of the clearest risk signals of the month. Price has been rising inside a narrow structure after a sharp fall, while on-chain data and derivatives positioning now show pressure building under the surface.
When these conditions appear together, the market often moves faster than expected. Traders are watching closely because several indicators now line up in the same direction.
A Large Bear Flag Pattern Is Setting Up the Risk Window
The Bitcoin price dropped sharply between November 11 and November 21, creating the long downward leg that forms the “pole.” Since then, the price has been climbing slowly inside a tight channel. This creates the “flag.”
A pole-and-flag is a continuation pattern. A strong fall builds the pole. A slow, tight rebound forms the flag. Breaking the lower trendline often repeats the size of the earlier drop.
Want more token insights like this? Sign up for Editor Harsh Notariya’s Daily Crypto Newsletter here
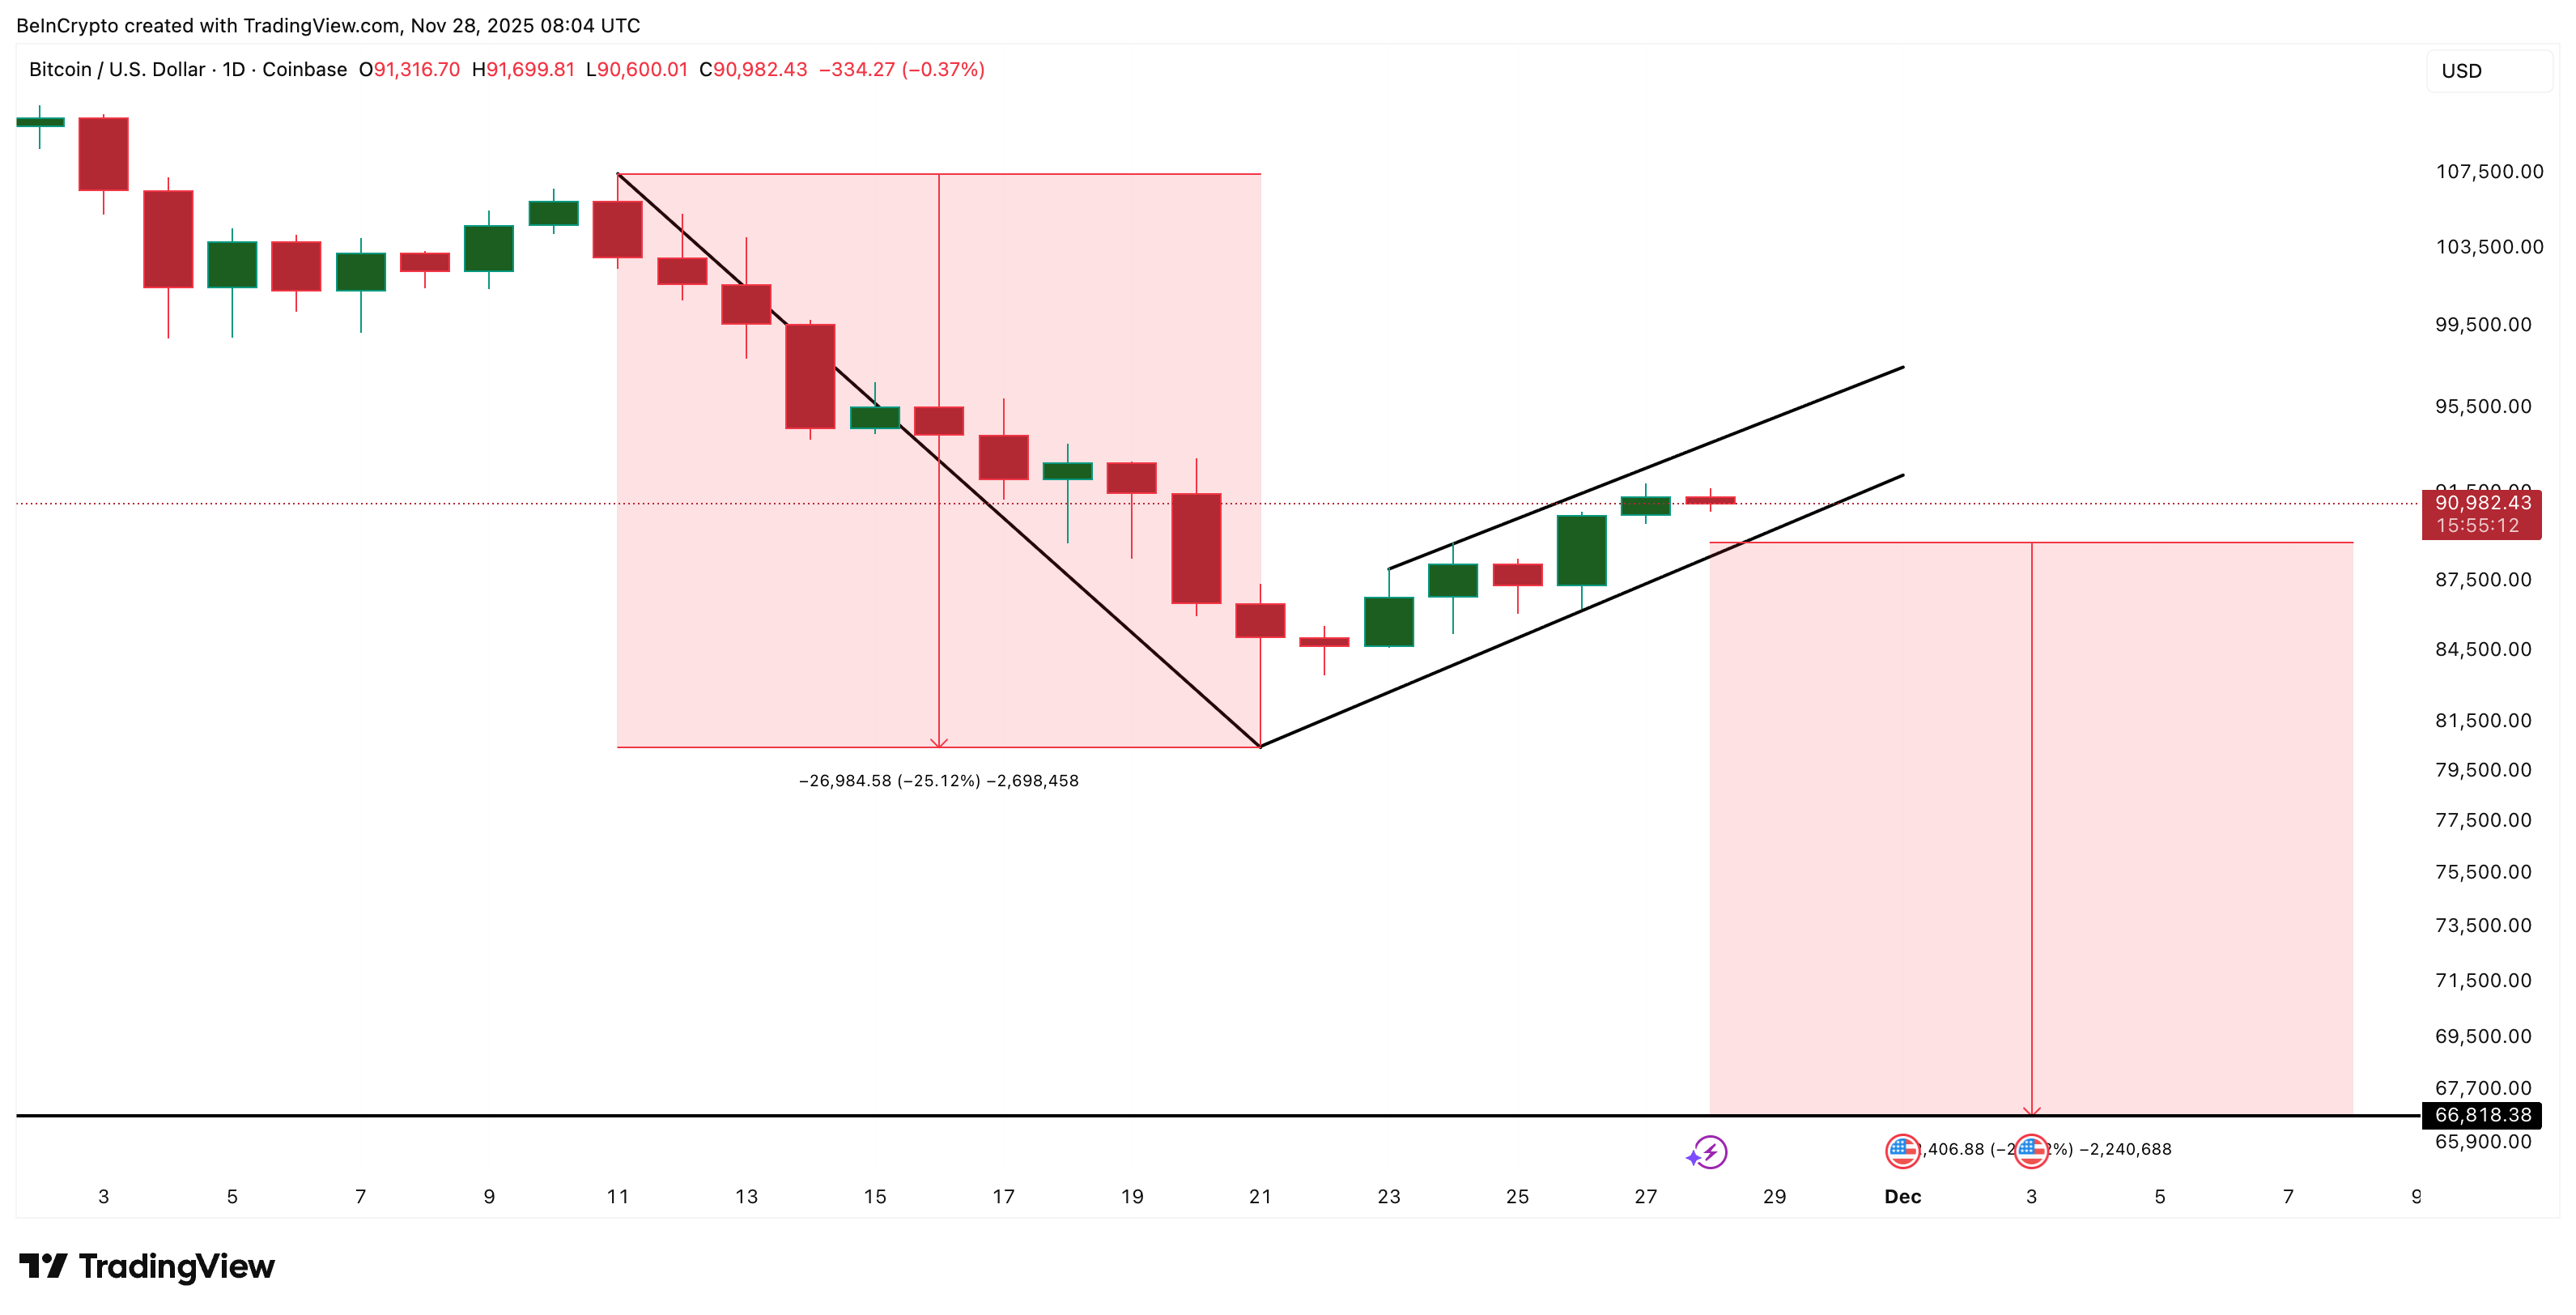
The earlier fall measured 25%, and flags commonly mirror that move. This gives a clean risk window where a deeper slide becomes possible if support fails. The structure does not confirm a breakdown on its own, but it gives a clear technical warning.
Both Spot And Derivatives Risks Are Building
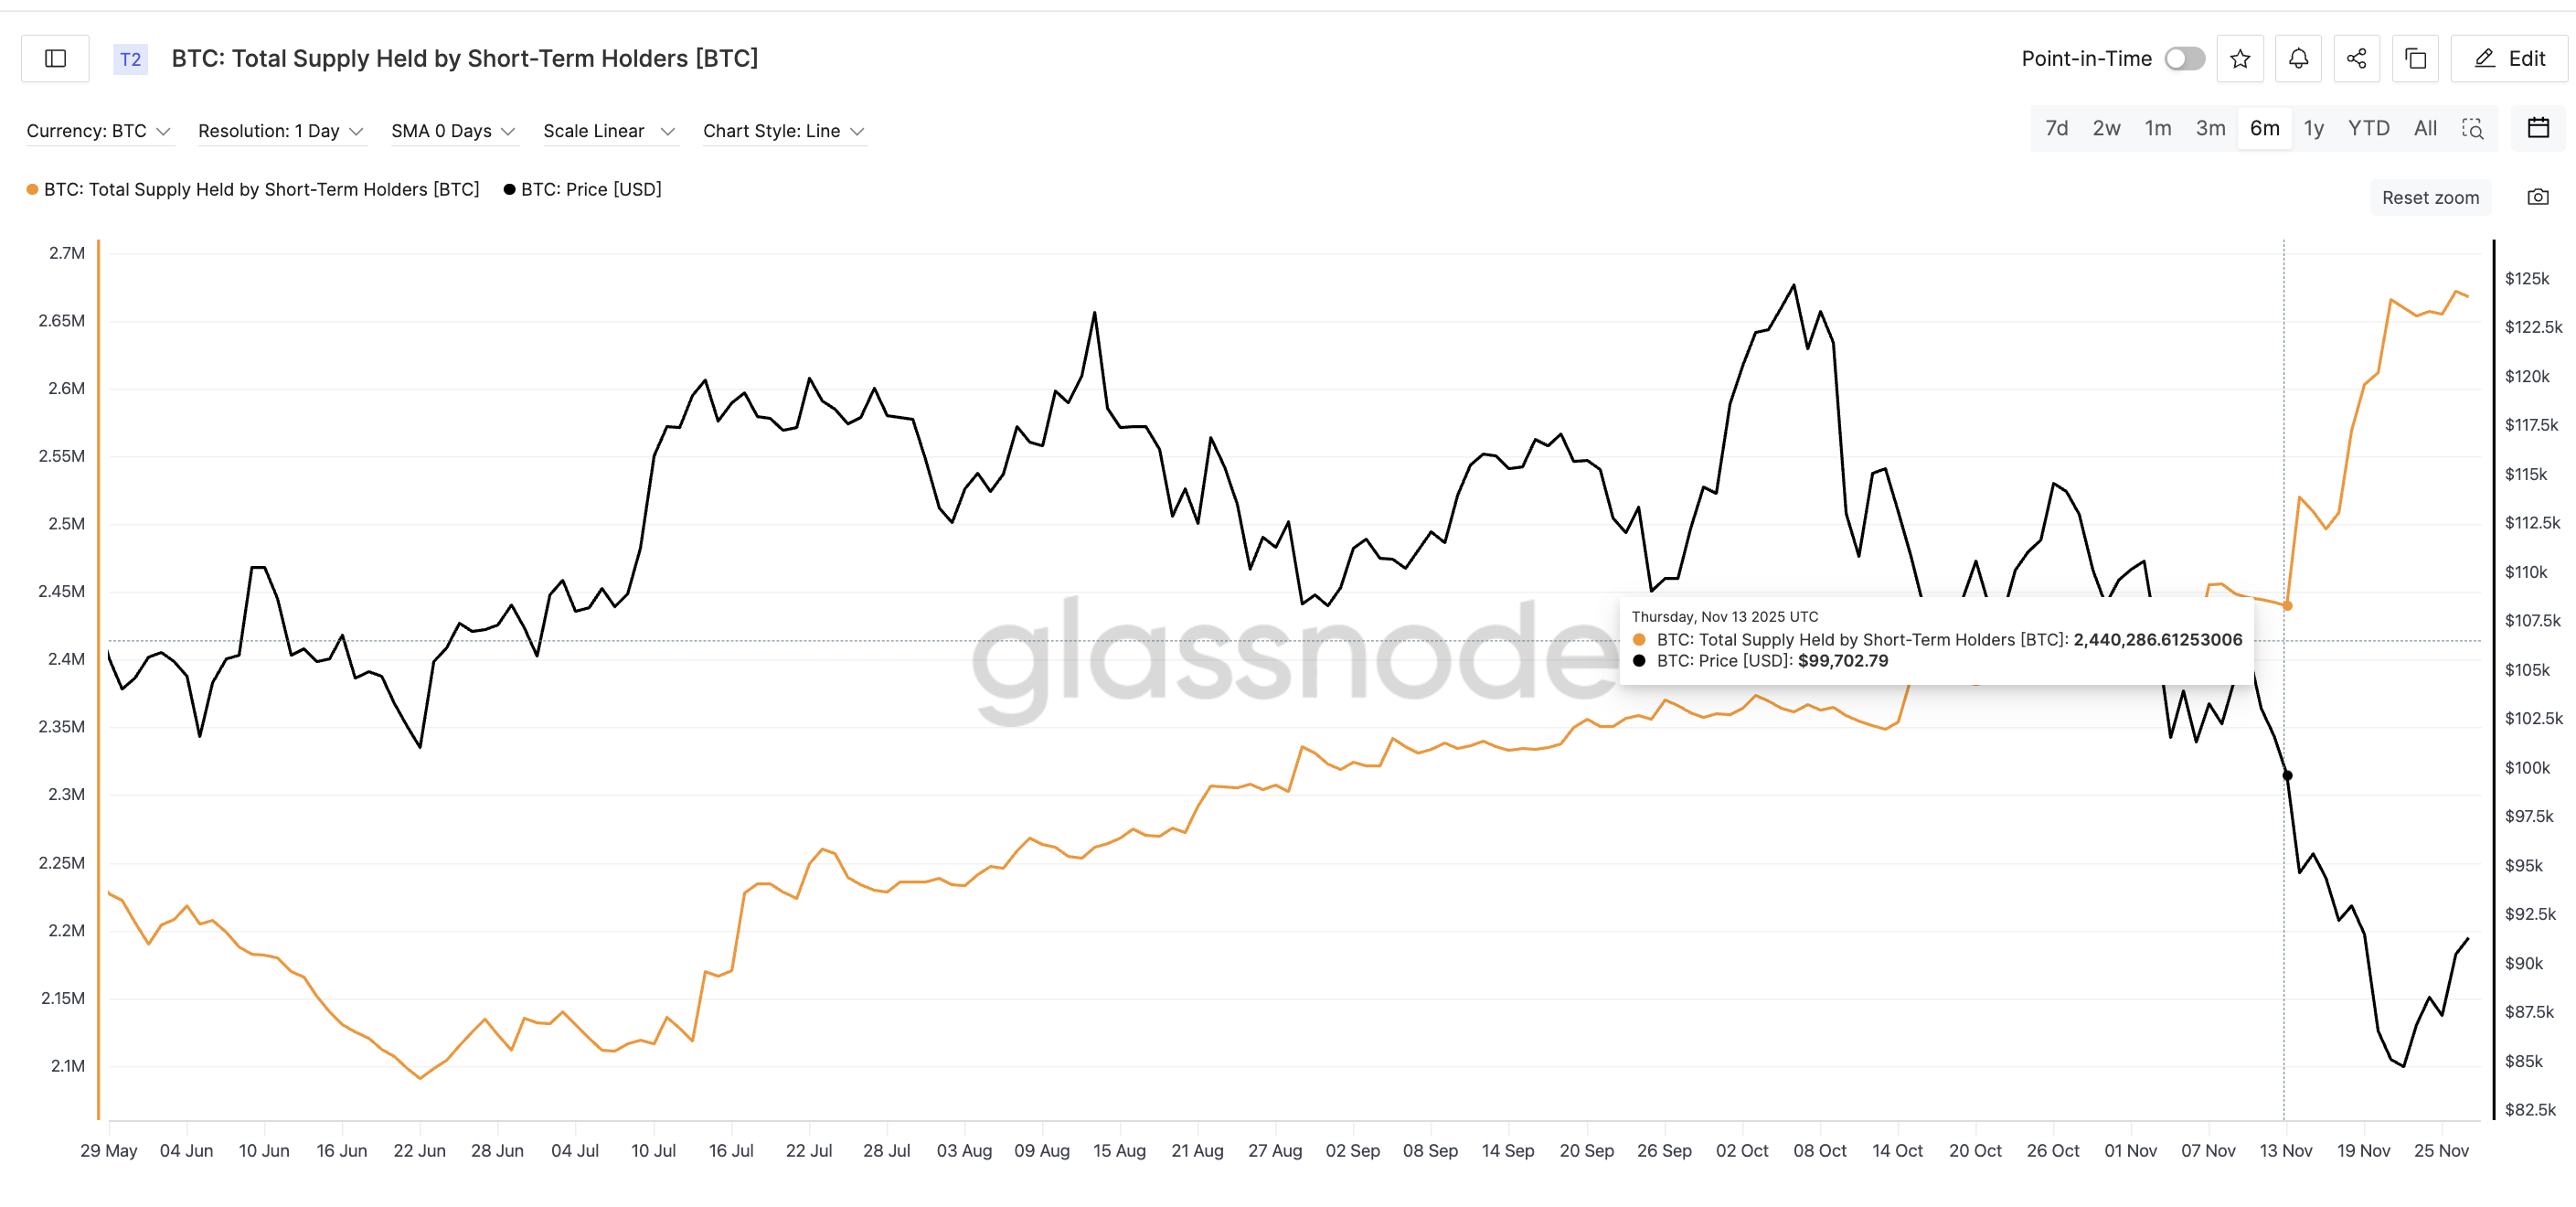
The on-chain picture adds to the downside risk flagged by the pattern.
Total BTC held by short-term holders has climbed from about 2.44 million BTC on November 13 to roughly 2.67 million BTC now (a near 10% increase), a six-month high. These are low-conviction coins, usually bought in the last few months and sold quickly when volatility spikes. A rising short-term holder supply during a weak bounce often means more “fast money” that can rush for the exit together.
Derivatives positioning points the same way.
The Binance BTC/USDT liquidation map shows around $2.24 billion in long liquidation leverage stacked below price versus only about $536 million in shorts above it. In other words, roughly 81% of the current liquidation risk sits under long positions, with longs carrying about four times more potential liquidations than shorts.
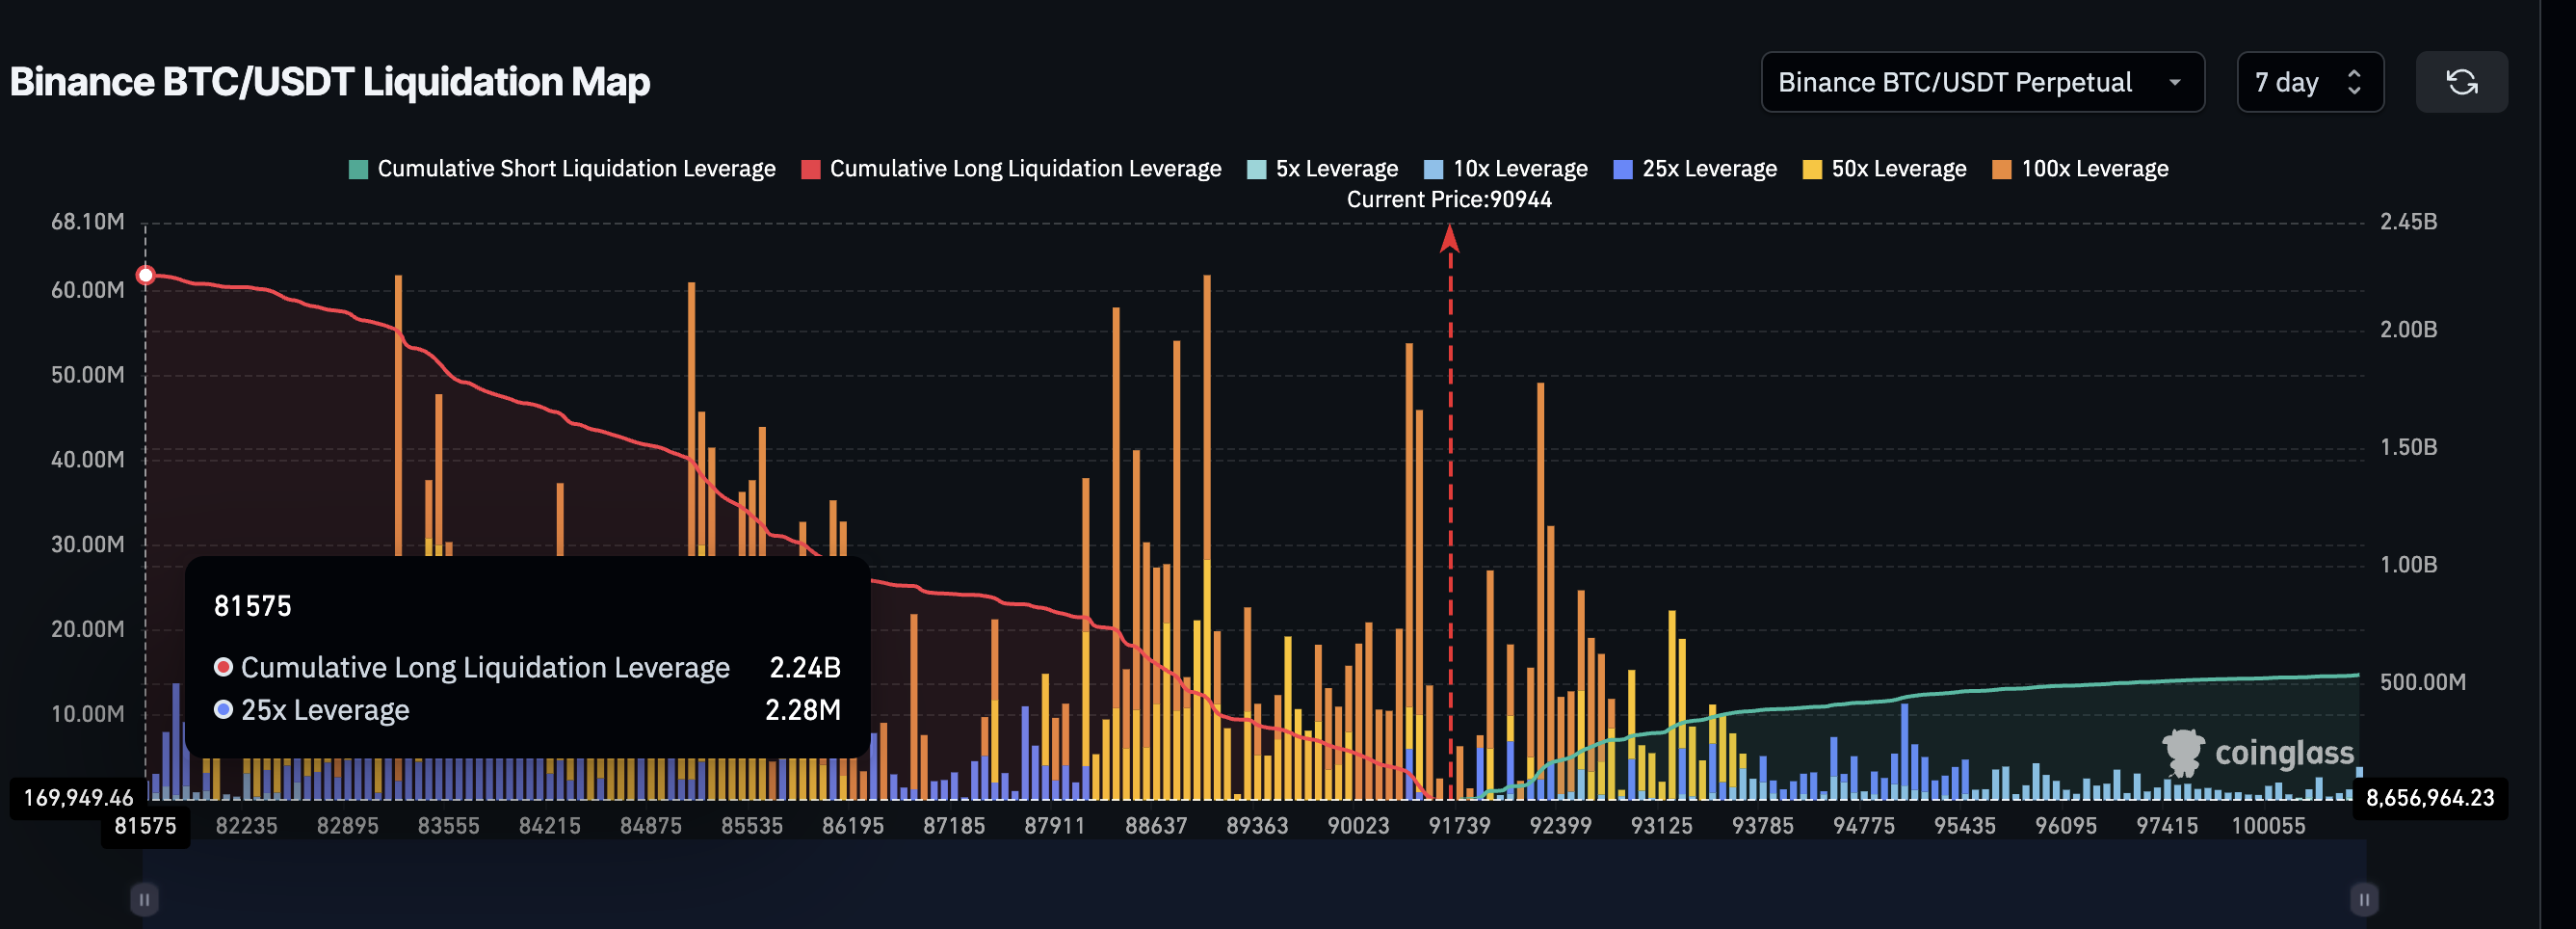
A clean move below the current flag support (highlighted later) would not just push spot price lower; it could also trigger a chain of forced long exits, amplifying any downside move the pattern starts.
Key Bitcoin Price Levels Decide Whether the Breakdown Happens
The first key level is $89,100. A clean drop below it breaks the flag and opens the squeeze zone. If this happens, the next support sits near $80,500. If pressure continues, the full flag extension points toward $66,600, a 25% move.
A move above $95,900 cancels the entire risk. This level sits above the flag’s midpoint and signals that buyers have regained strength. In that case, Bitcoin can attempt a move toward $107,400.
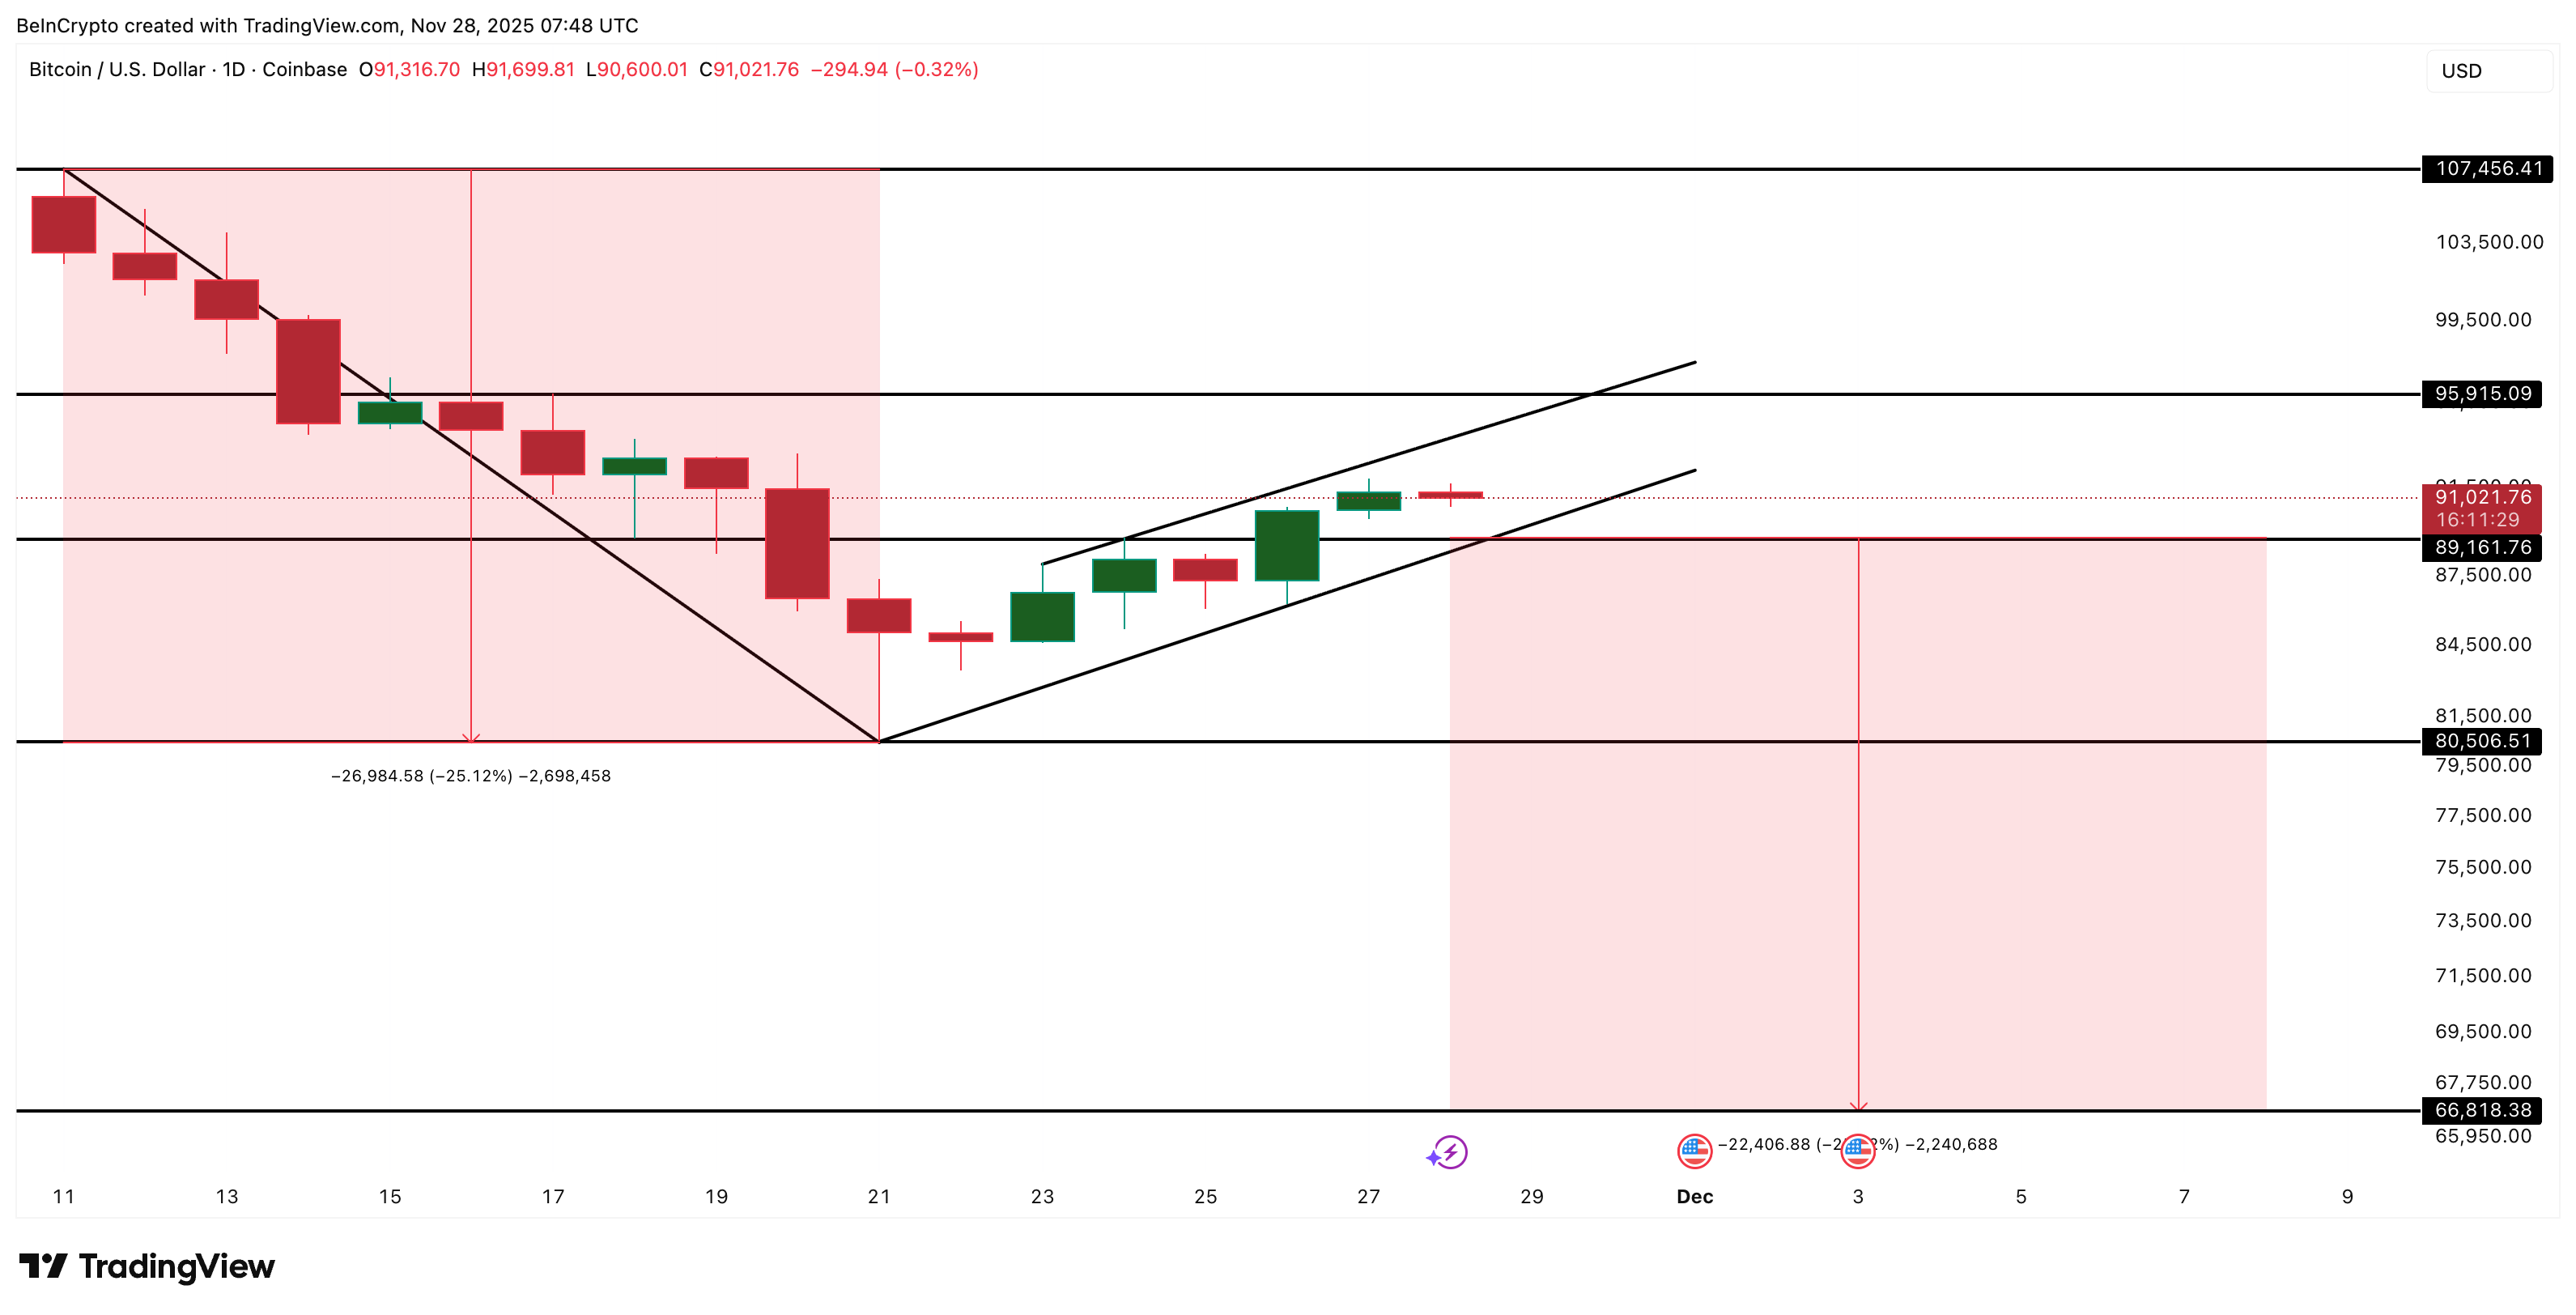
The Bitcoin price now sits between these two lines. A clean break under $89,100 confirms the risk. A break above $95,900 removes it.
The post Bitcoin’s Critical Price Risk ‘Flag’ged — Here’s Why a 25% Dip Could Be Possible appeared first on BeInCrypto.