Bitcoin’s latest market antics are giving traders whiplash — and maybe a touch of hope. After tumbling from the lofty perch above six-figures to $80,537, it’s clawed its way back toward $92,000, staging a short-term rebound that looks a little too good to be ignored. But don’t be fooled: while the lower timeframes flirt with a recovery bounce, bitcoin’s daily chart still clutches the bearish trend.
Bitcoin Chart Outlook
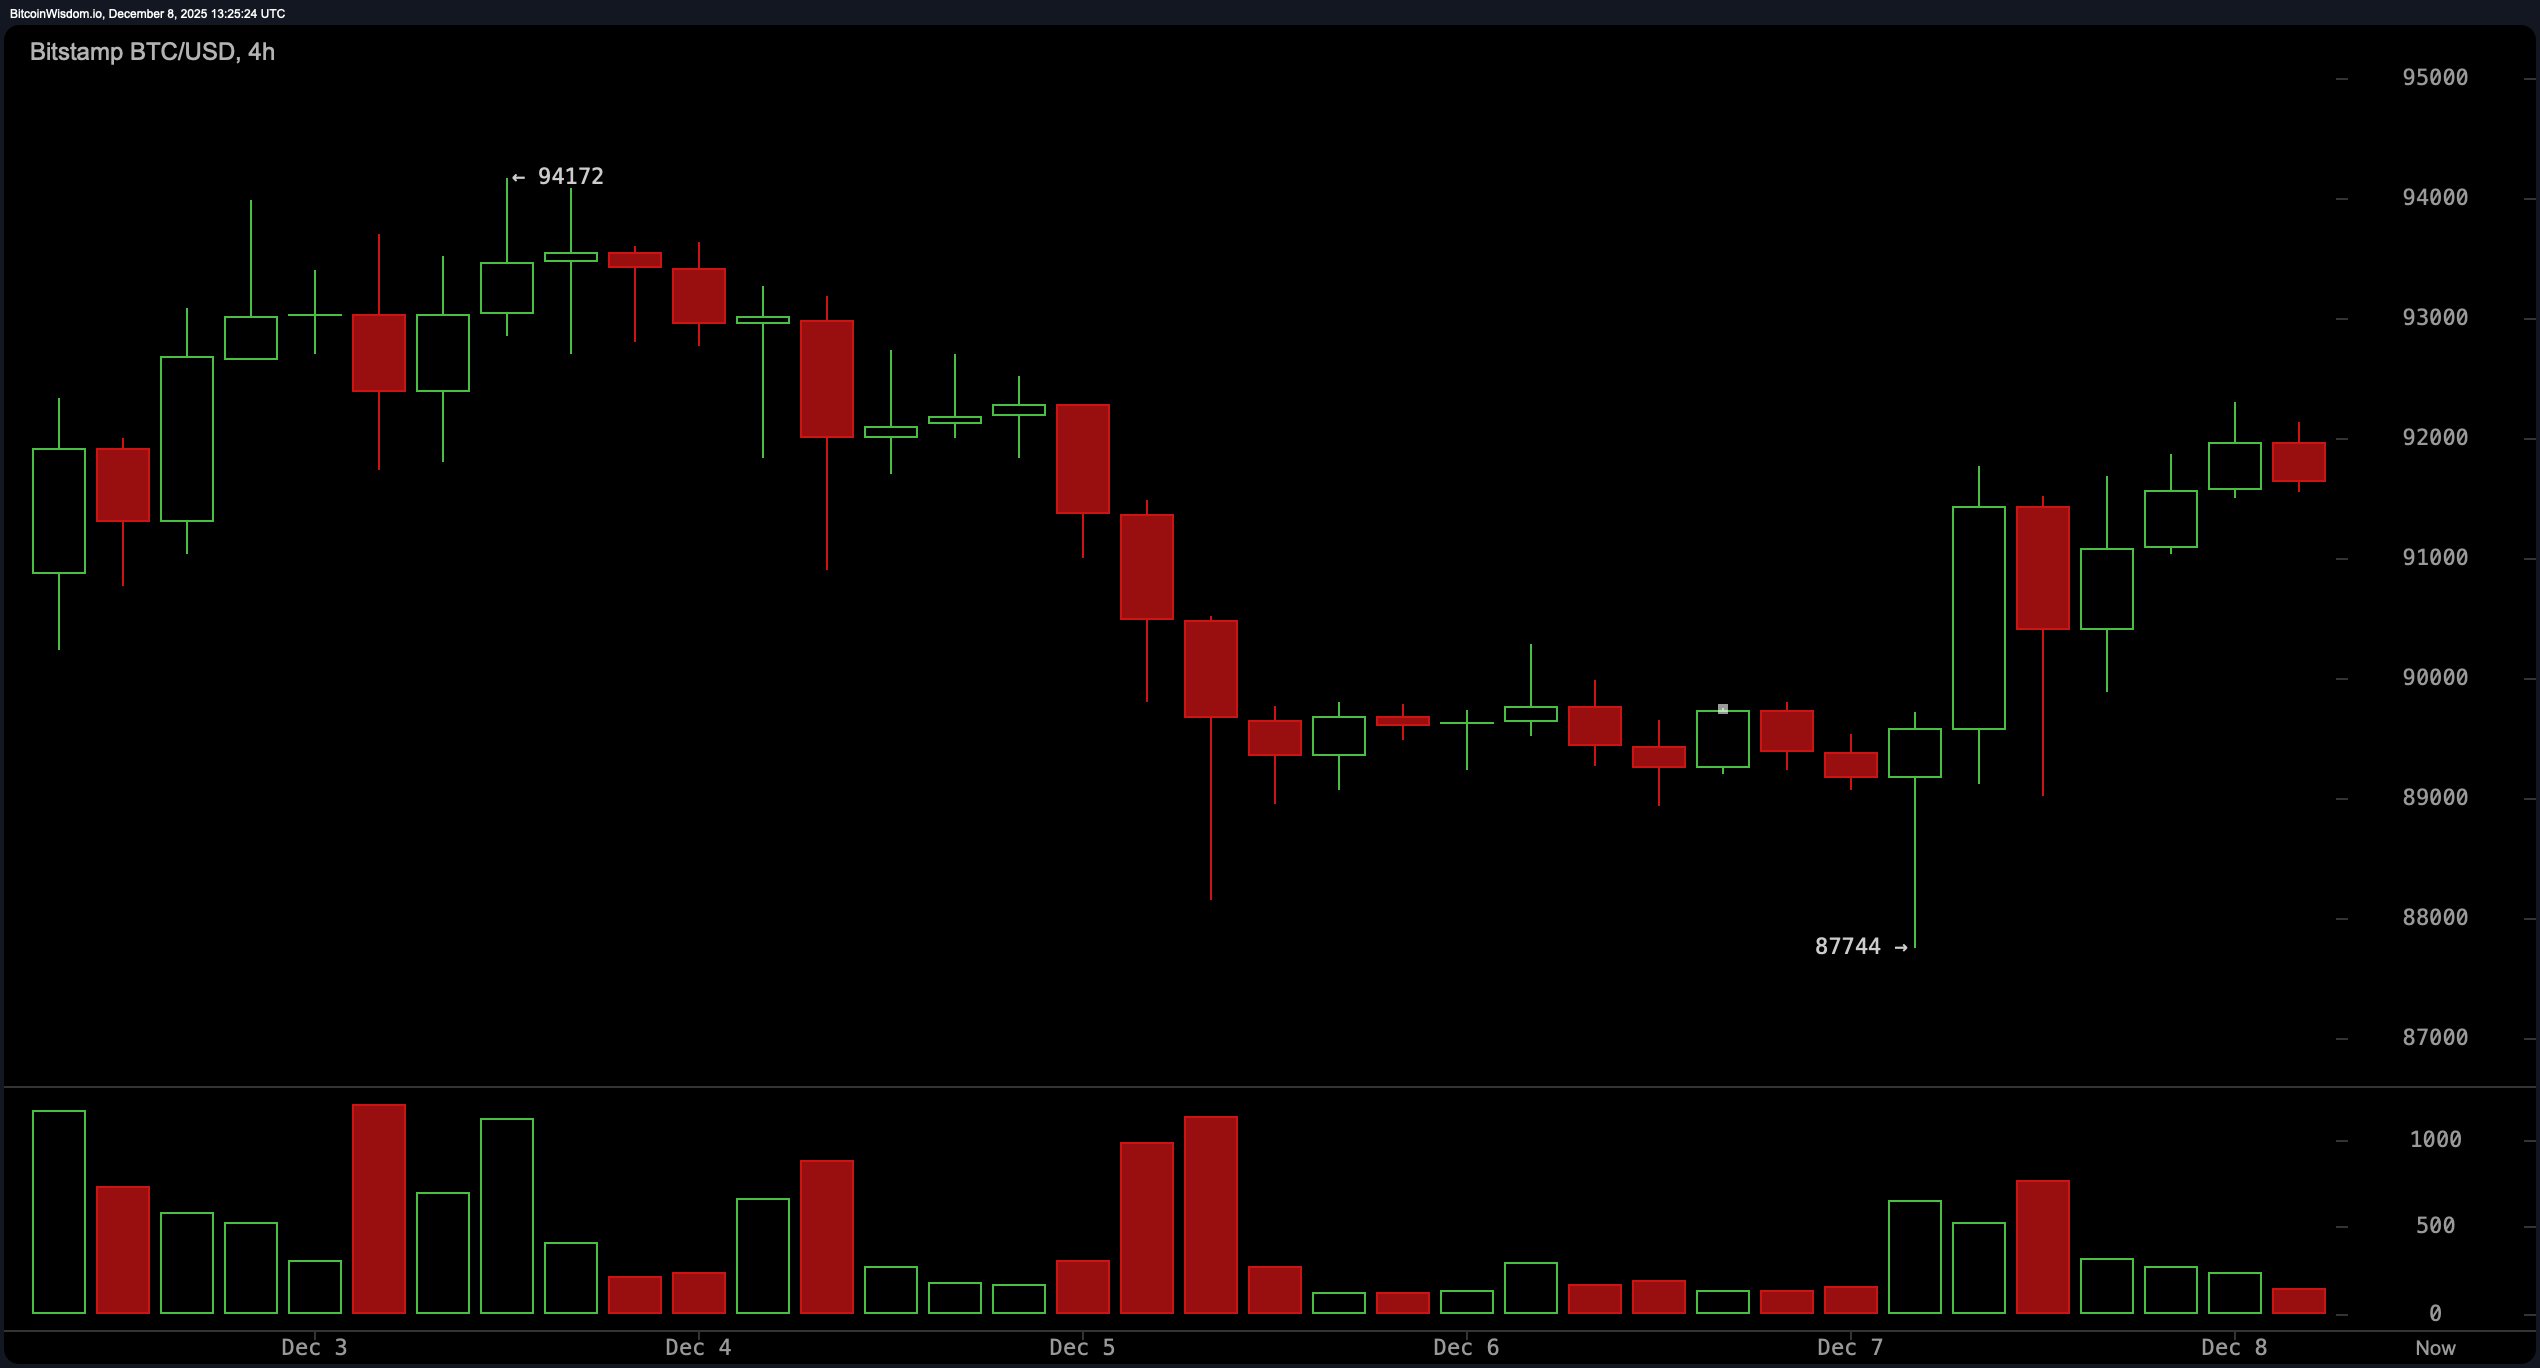
Momentum is staging a comeback on the 1-hour and 4-hour charts, with price action forming higher lows and buyers stepping in on every dip like they’re bargain hunting at a flash sale.
Bitcoin’s recent bounce from $87,744 to just over $92,000 shows a textbook recovery structure on the 4-hour chart, but the fun seems to stall near resistance. Topping wicks and seller rejections near $92,000 hint that this dance isn’t over, and bitcoin might still be waiting for a true breakout partner.
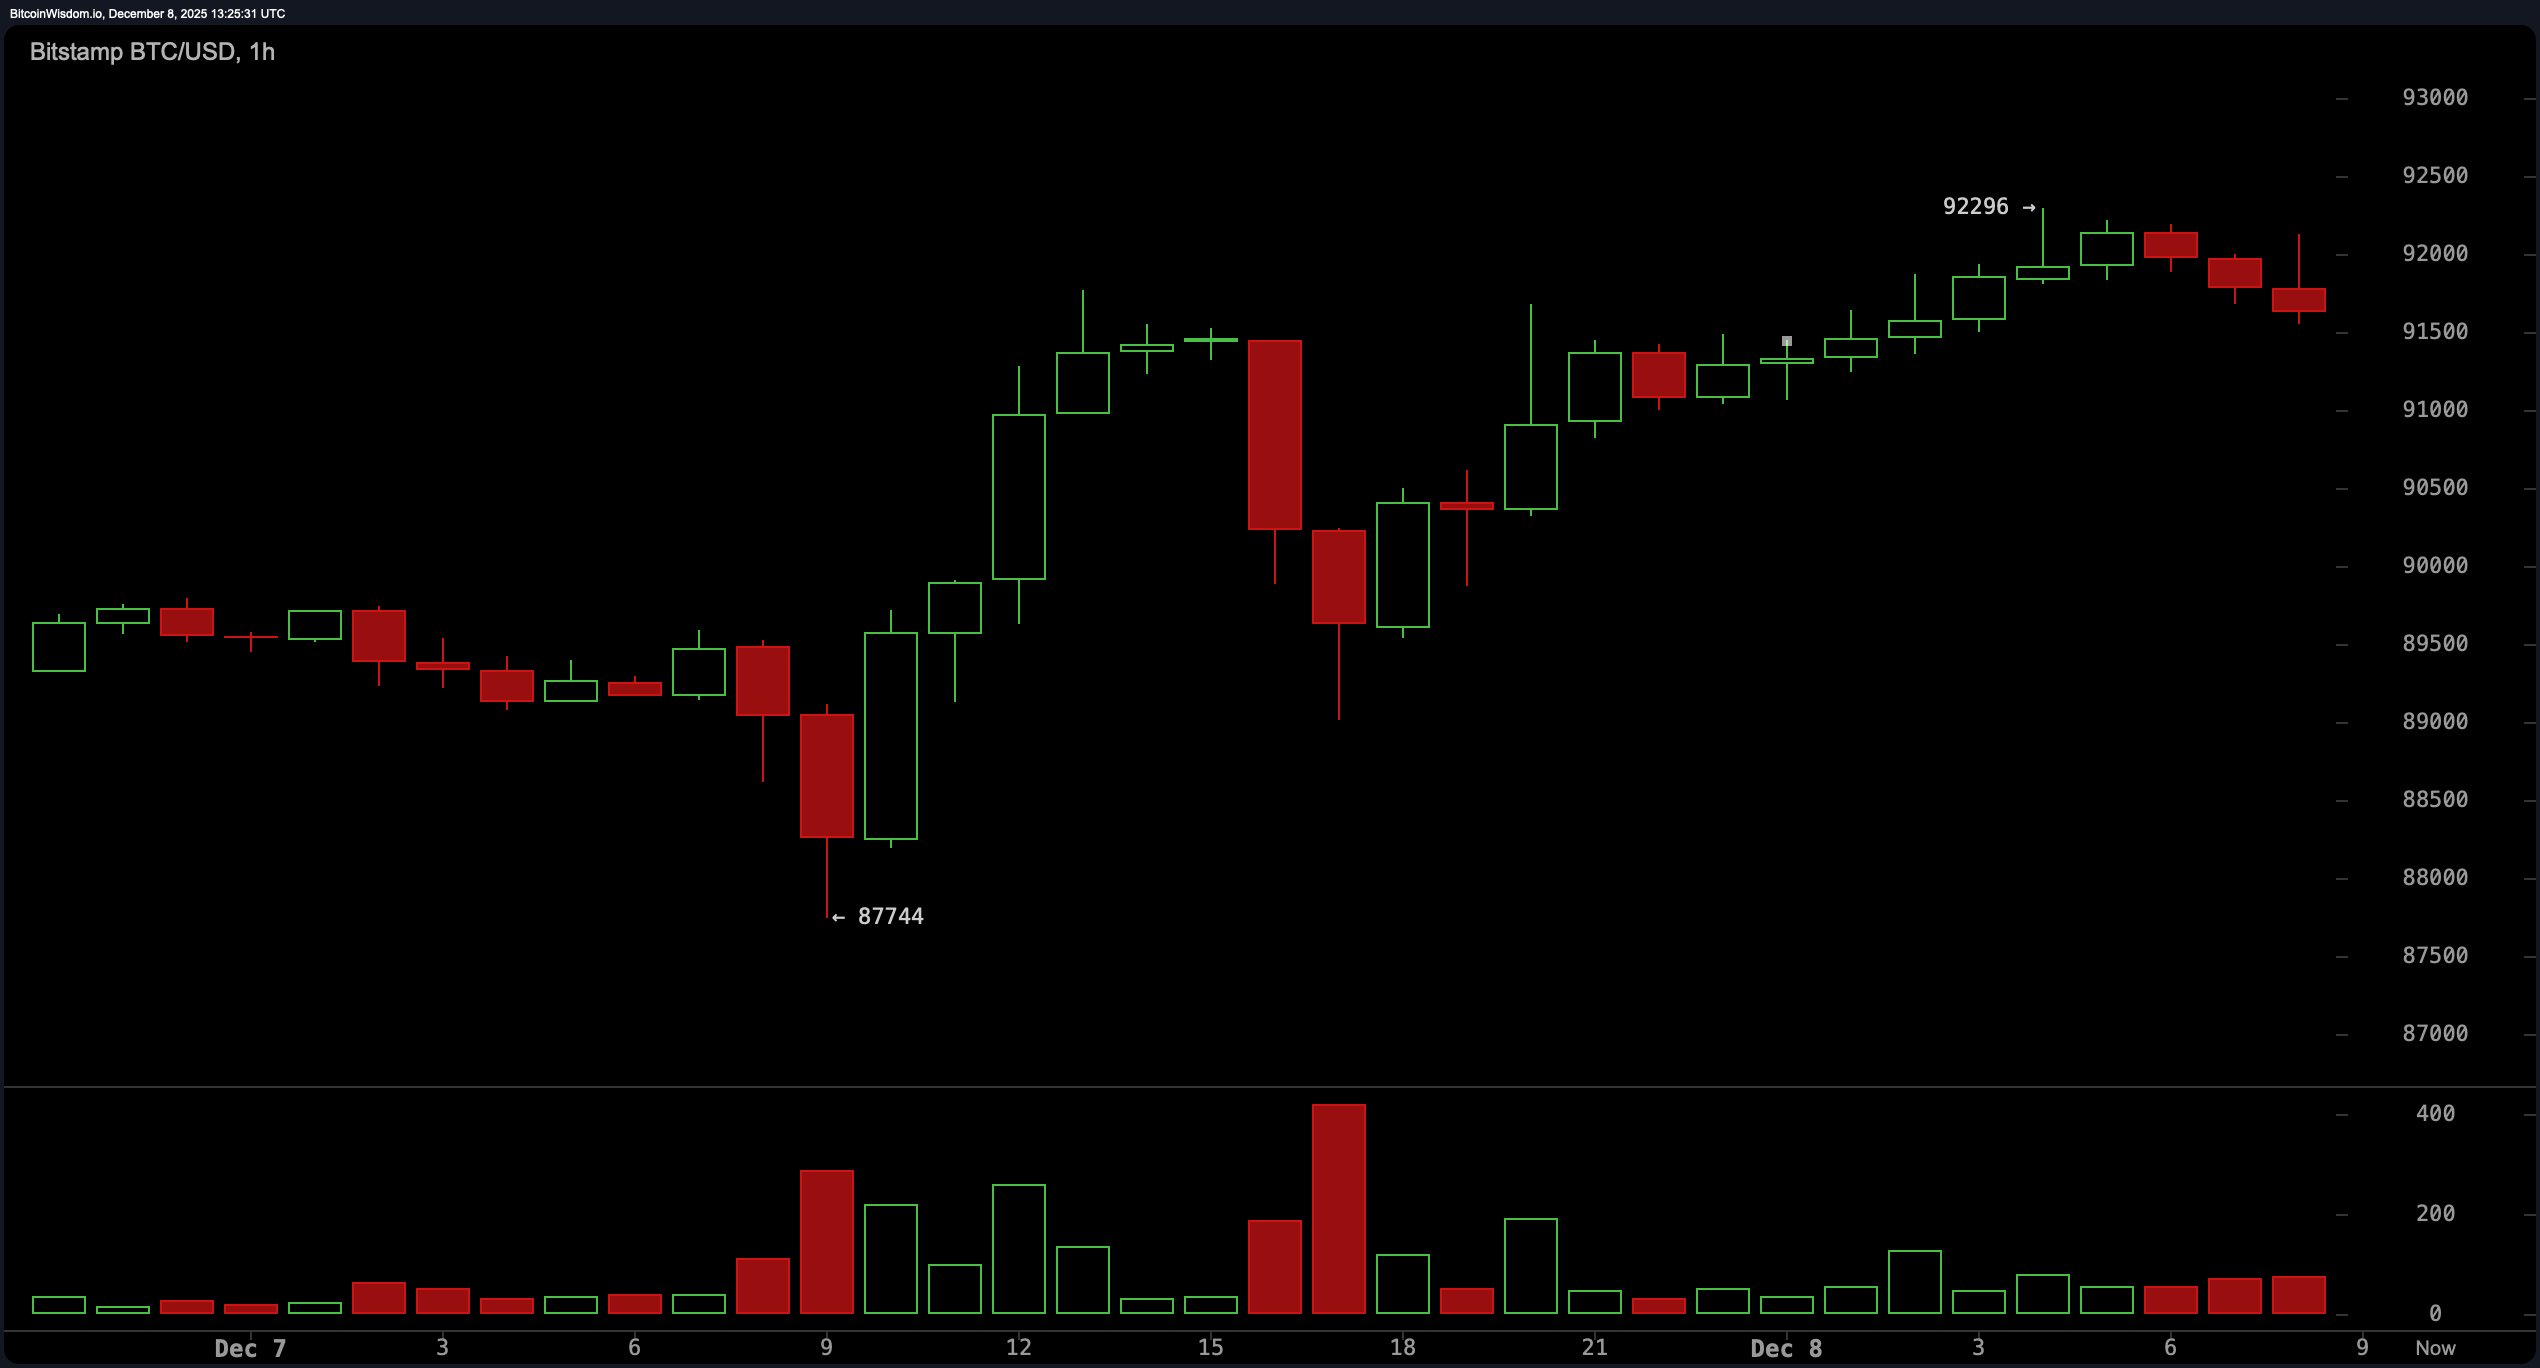
Zoom into the 1-hour chart, and things get spicy. Bitcoin is building an uptrend brick by brick, with higher highs and tidy little retracements that suggest steady, not euphoric, buying. The sweet spot for re-entry lies around $90,500–$91,000 per BTC, where prior consolidation has formed a sturdy mid-channel support. And if bitcoin manages to reclaim $92,000 with conviction, short-term scalpers may get their wish with exits toward the $92,500–$93,000 range. Just don’t blink, because a stop-loss below $89,800 is a sensible safety net for anyone playing close to the fire.
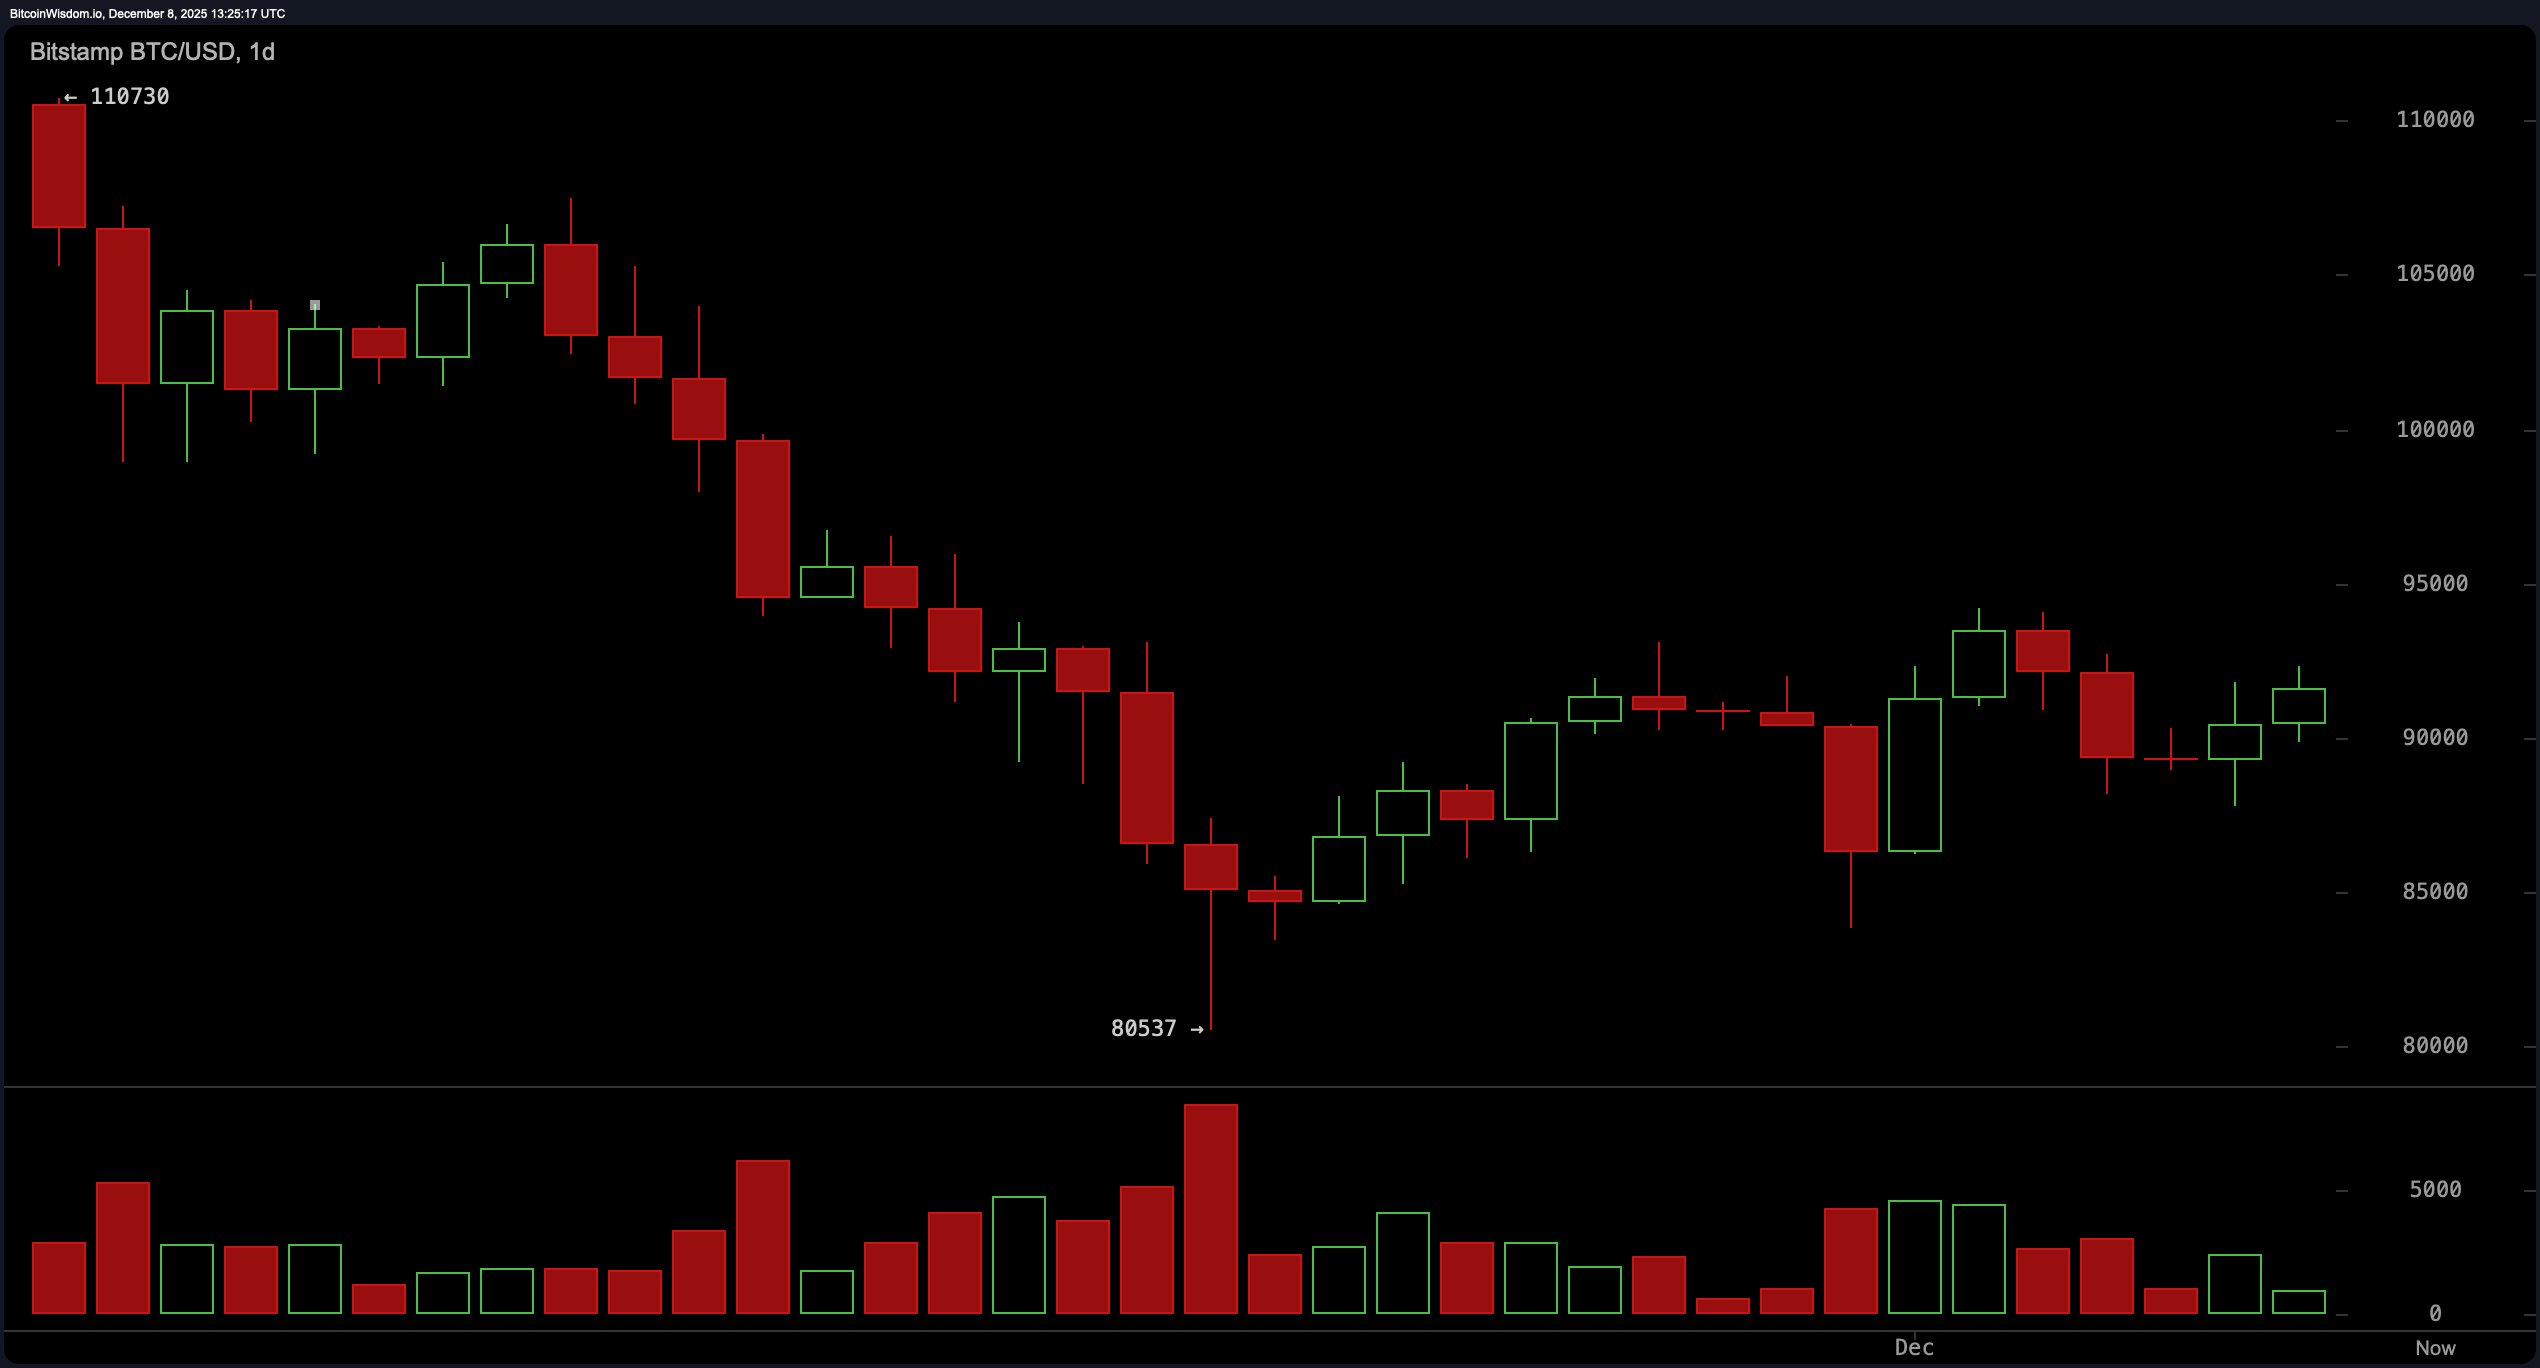
From a daily chart perspective, the broader structure hasn’t officially reversed. Bitcoin remains boxed in below $94,000–$95,000 resistance, with the ghost of $110,000 looming above like an ex that won’t stop texting. While four higher lows since the $80,537 bottom offer a glimmer of promise, the candles haven’t fully committed to a reversal. That leaves the $88,000–$90,000 zone as a critical area for opportunists — with risk becoming tangible if a daily close drops under $87,000.
Now, let’s talk oscillators and moving averages — because the technical indicators are having a split-personality moment. The relative strength index (RSI), Stochastic oscillator, commodity channel index (CCI), average directional index (ADX), and Awesome oscillator are all stuck in neutral, like a car on a hill with the parking brake halfway pulled.
But momentum and the moving average convergence divergence (MACD) are both signaling entry opportunities. That said, moving averages are a hot mess: short-term averages — like the 10-day and 20-day exponential (EMA) and simple moving averages (SMA) — still support continuation upward, but anything from the 30-day and beyond is flashing warning signs.
In sum, bitcoin’s short-term charts are throwing a party, but the daily chart is still waiting for an invitation. It’s a mixed bag of bullish momentum and overarching resistance, where patience, tight stops, and tactical exits remain the name of the game. And remember — in crypto, the only constant is chaos, so bring your seatbelt and maybe a helmet.
Bull Verdict
If bitcoin holds above the $90,000 level and reclaims $92,500 with volume, the case strengthens for a continued climb toward $94,000 and potentially $96,000. Momentum indicators like the MACD and short-term moving averages are leaning supportive, and the rebound from $87,744 shows legitimate buyer interest. A clean break above $94,000 would confirm the reversal and put $100,000 back on the radar.
Bear Verdict
Should bitcoin fail to sustain its footing above $90,000 — or worse, close below $87,000 on the daily — the current structure unravels faster than a rug pull. With medium- to long-term moving averages still aligned against it and resistance pressing down from $94,000, this rally risks being nothing more than a dead cat bounce in disguise. Any decisive rejection from $92,500 could invite a swift revisit to $85,000 or lower.
FAQ
- What is the current price of bitcoin today? Bitcoin is trading at $91,808 as of December 8, 2025.
- Is bitcoin in an uptrend right now?Short-term charts show bullish momentum, but the daily trend remains capped by resistance.
- What are the key support and resistance levels for bitcoin?Support sits near $87,000, while resistance zones range from $92,500 to $94,000.
- Where could bitcoin price go next?A breakout above $92,500 could target $94,000–$96,000, while a drop below $87,000 risks deeper pullbacks.