Bitcoin stabilizes near key support while elevated liquidations and volatility highlight fragile momentum and ongoing uncertainty in market direction.
Bitcoin ($BTC) is holding firm above the $67,000 level, but beneath the surface, price action shows a market still searching for a clear direction after weeks of sustained volatility. $BTC is currently trading at $67,242.84, marking a modest 0.5% gain over the past 24 hours.
During the session, the price fluctuated within a defined daily range between $65,932.08 and $68,371.34. This relatively wide intraday band highlights ongoing volatility even as Bitcoin stabilizes near its mid-range, suggesting both buyers and sellers remain active near current levels.
Meanwhile, market structure reflects strong underlying scale and liquidity. Bitcoin’s market cap stands at about $1.34 trillion, up 0.85%. Trading activity remains elevated, with 24-hour volume reaching $50.86 billion, also up 12.3%, confirming sustained participation across markets.
Despite the latest intraday recovery, broader performance remains mixed, with $BTC up 0.5% on the day but still down 4.7% over the past 7 days. However, the next decisive breakout or breakdown could determine whether $BTC is preparing for renewed upside expansion or extending its broader consolidation phase.
Bitcoin Price Analysis
Bitcoin’s technical structure remains fragile, with price still trading near the lower boundary of its volatility range. Immediate support is now established around the lower Bollinger Band near $60,012, which acted as a critical defense point during the recent sharp selloff. This level represents the last major volatility floor before the deeper psychological zone around $60,000.
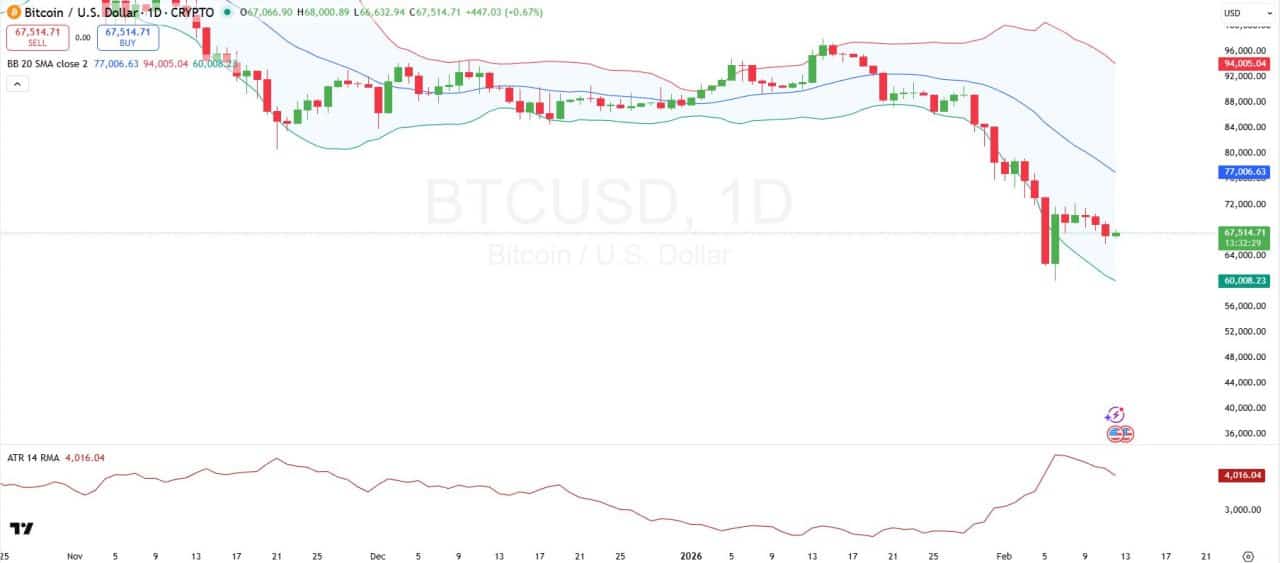
So far, $BTC has managed to hold above this band and stabilize near $67,541, suggesting buyers are attempting to form a short-term base. However, any decisive daily close below $60,012 would signal renewed downside expansion and could accelerate selling pressure toward lower structural support zones.
On the upside, resistance remains firmly layered and continues to cap recovery attempts. The first barrier exists at the Bollinger Band midline, placed around $77,007. This level now acts as the primary recovery threshold and marks the point where the broader trend would begin to neutralize. After that, the upper band near $94,003 represents the longer-term resistance zone.
Further, volatility indicators reinforce the elevated risk environment. The Average True Range currently reads approximately 4,016, reflecting significantly expanded price movement compared to prior consolidation phases. This elevated ATR confirms that recent price swings are large but have started declining.
Bitcoin Liquidation
Bitcoin’s recent liquidation data reveals that over the past 24 hours, total liquidations reached approximately $145.92 million, with short positions accounting for $82.71 million, compared to $63.20 million in long liquidations.
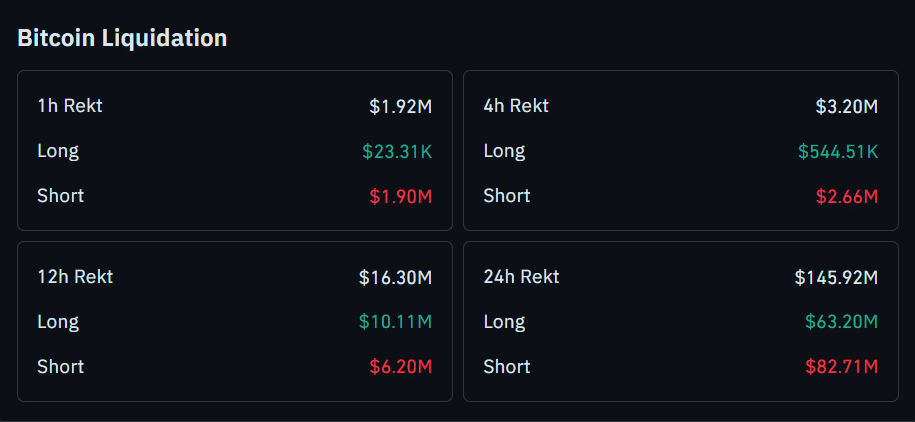
However, the broader 12-hour liquidation structure presents a more balanced but still volatile picture. Total liquidations reached $16.30 million, with long positions accounting for $10.11 million and shorts at $6.20 million.
Shorter timeframes reinforce the trend of aggressive short-side pressure. In the past 4 hours alone, total liquidations reached $3.20 million, with $2.66 million coming from short positions and only $544,510 from longs.