
Bitcoin is trading at $113,561 to $113,800 over the last hour with a market capitalization of $2.26 trillion. Over the past 24 hours, it recorded a trading volume of $49.17 billion and an intraday price range of $112,680 to $115,899, revealing heightened volatility and uncertainty in short-term direction.
Bitcoin
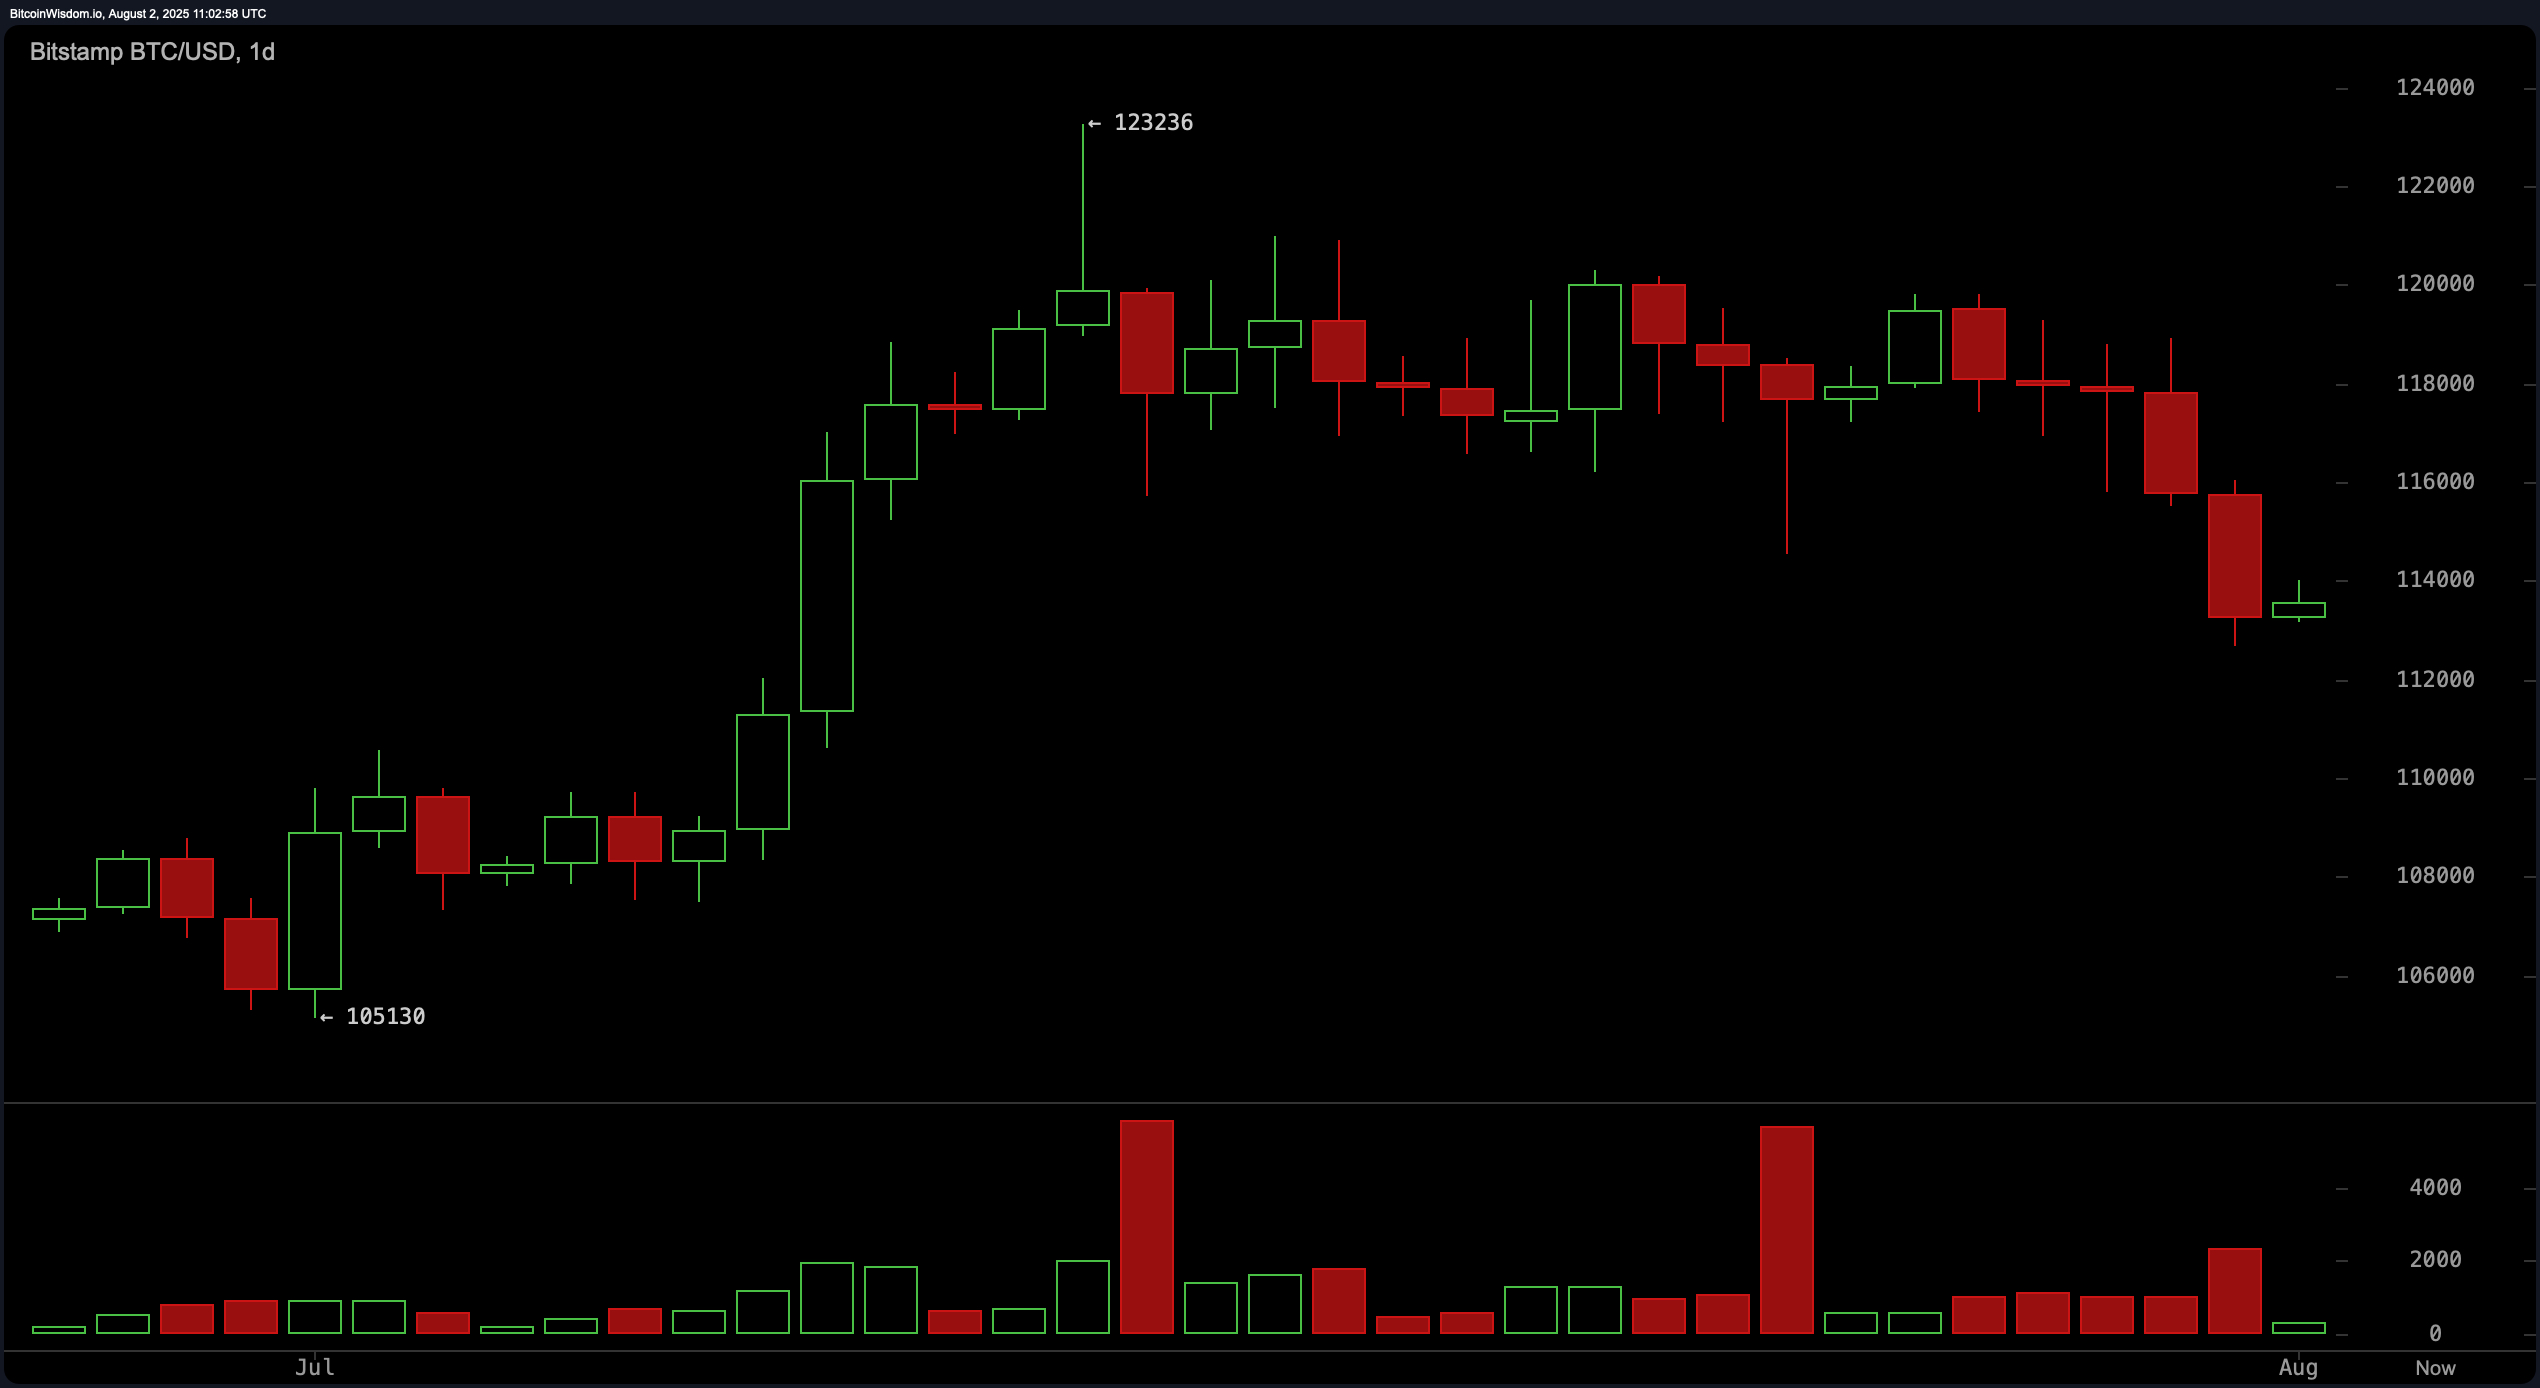
A detailed review of the daily chart shows bitcoin’s recent decline from highs of approximately $123,236, indicating a short-term downtrend. Strong selling volume near the top suggests a distribution phase, with resistance clearly defined between $118,000 and $120,000. The price has found recent support near the $112,680 to $113,000 range, where high-volume bounces have previously occurred. If price revisits this area and selling pressure subsides, it could offer a bullish re-entry point. However, a failure to reclaim territory above $117,000 with renewed volume would reinforce bearish sentiment and signal an opportune exit.
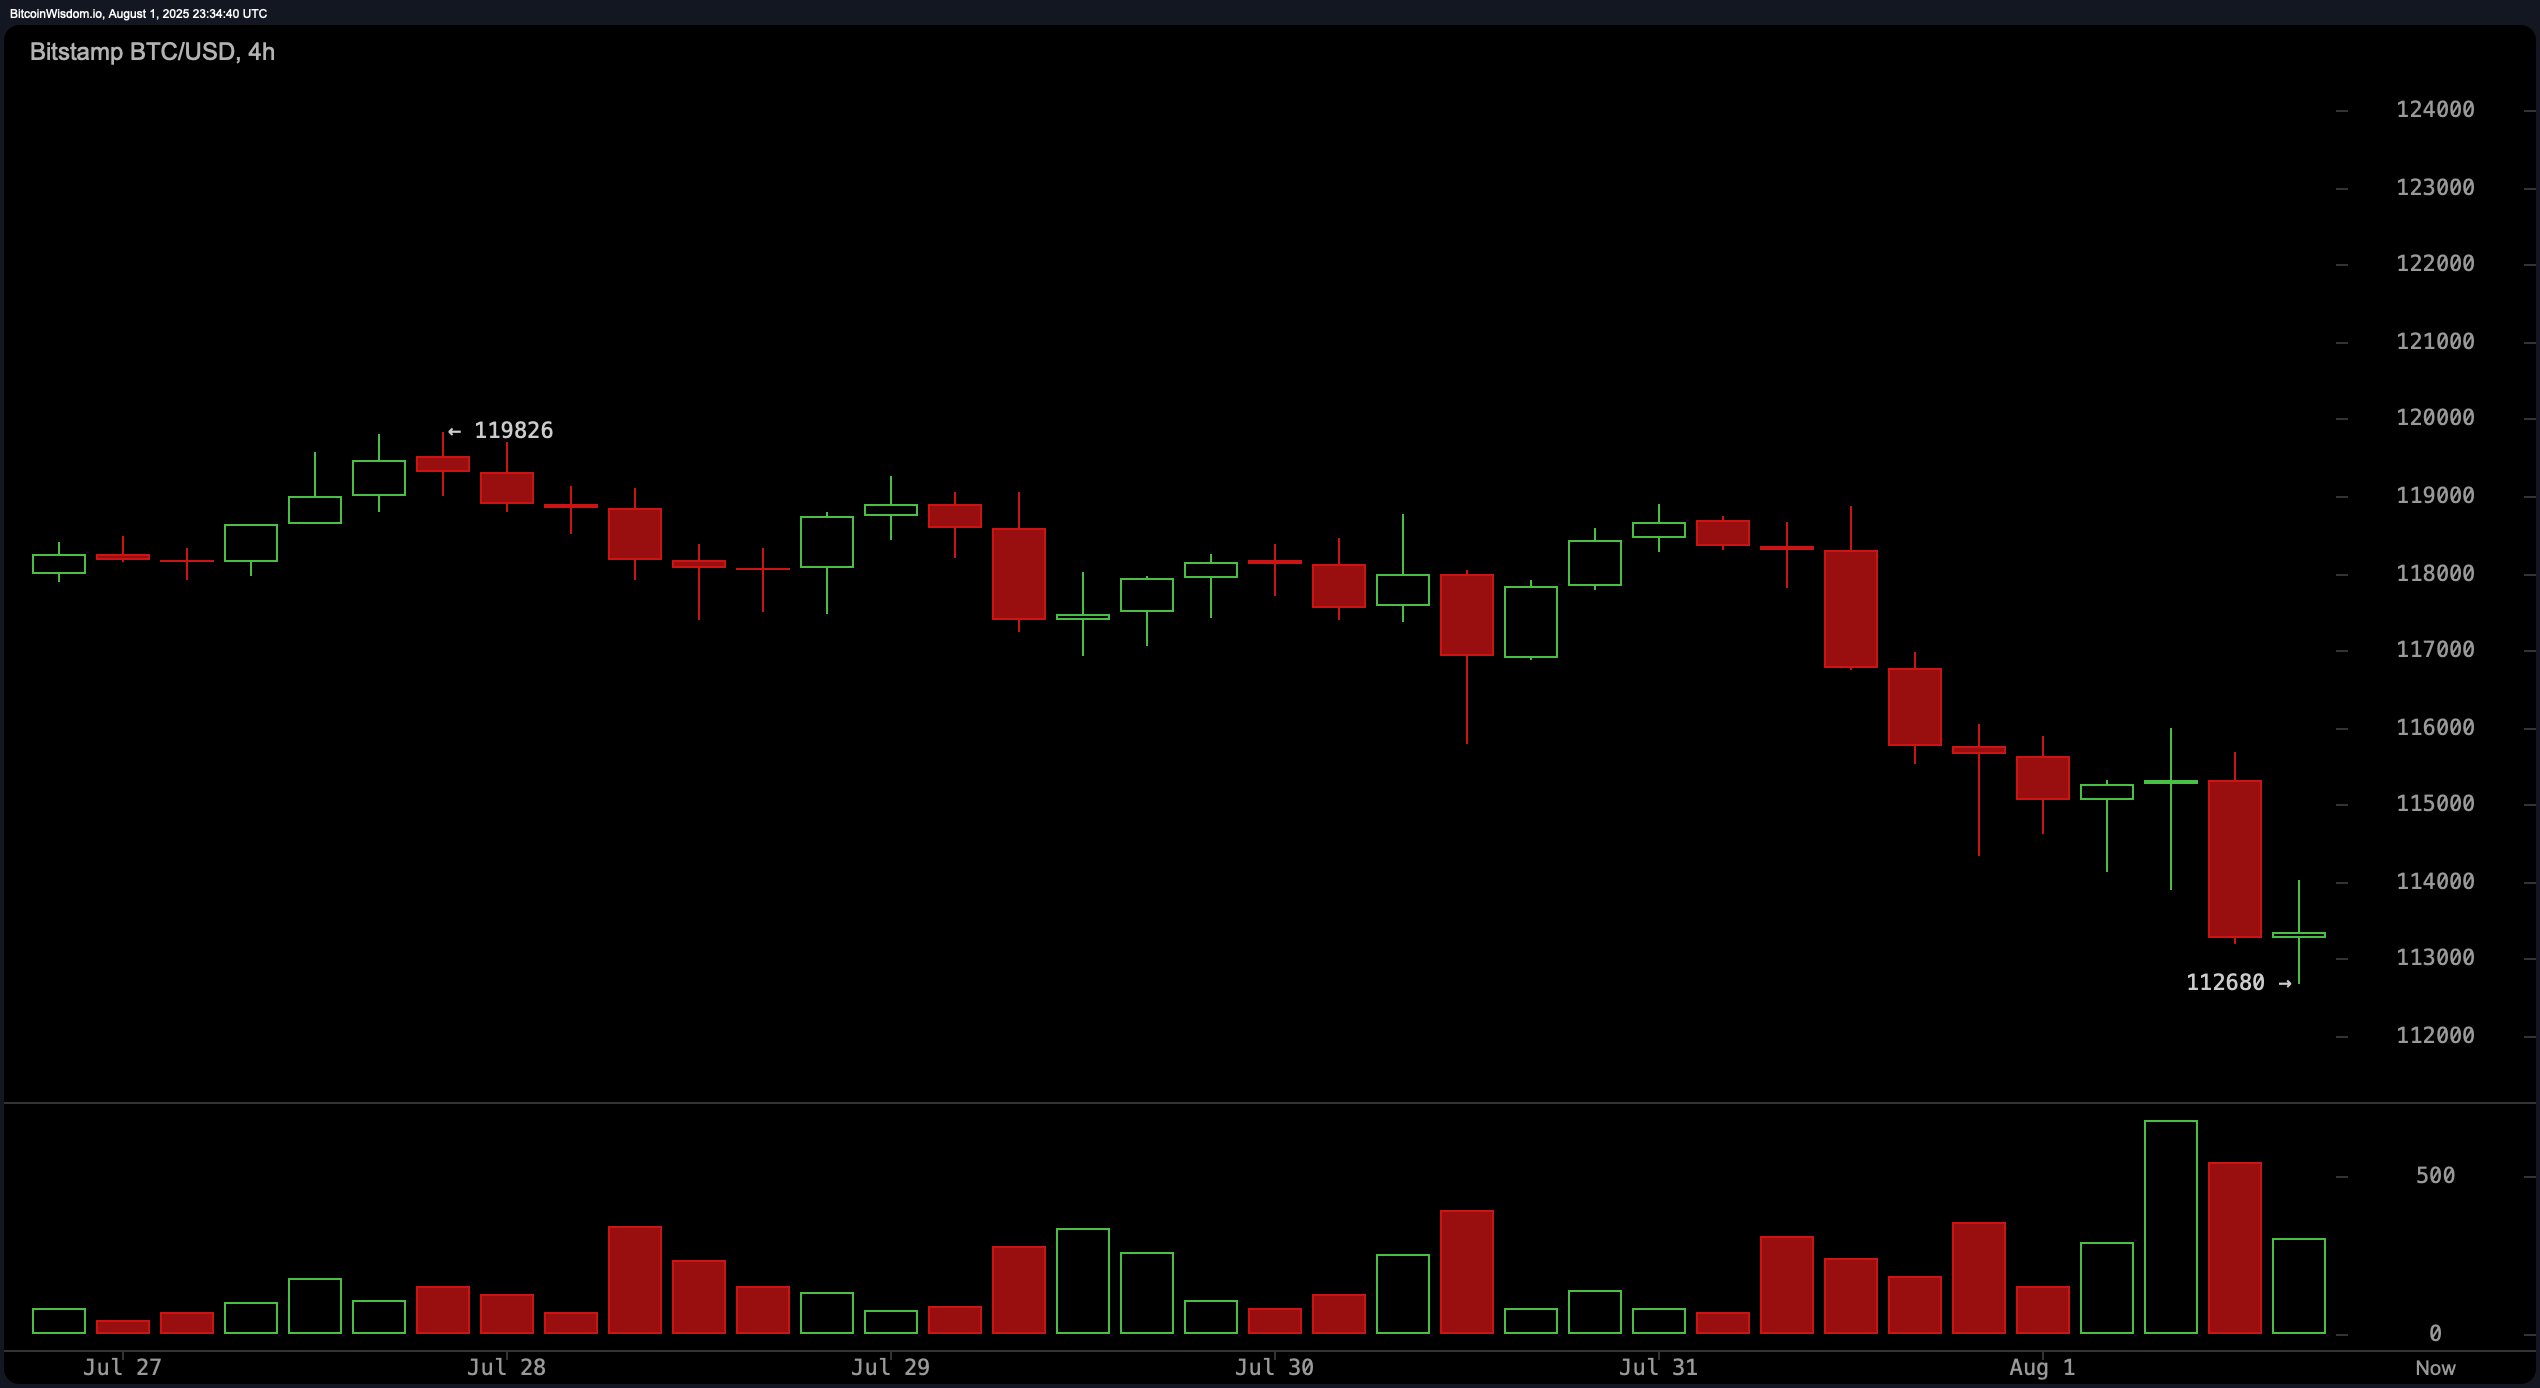
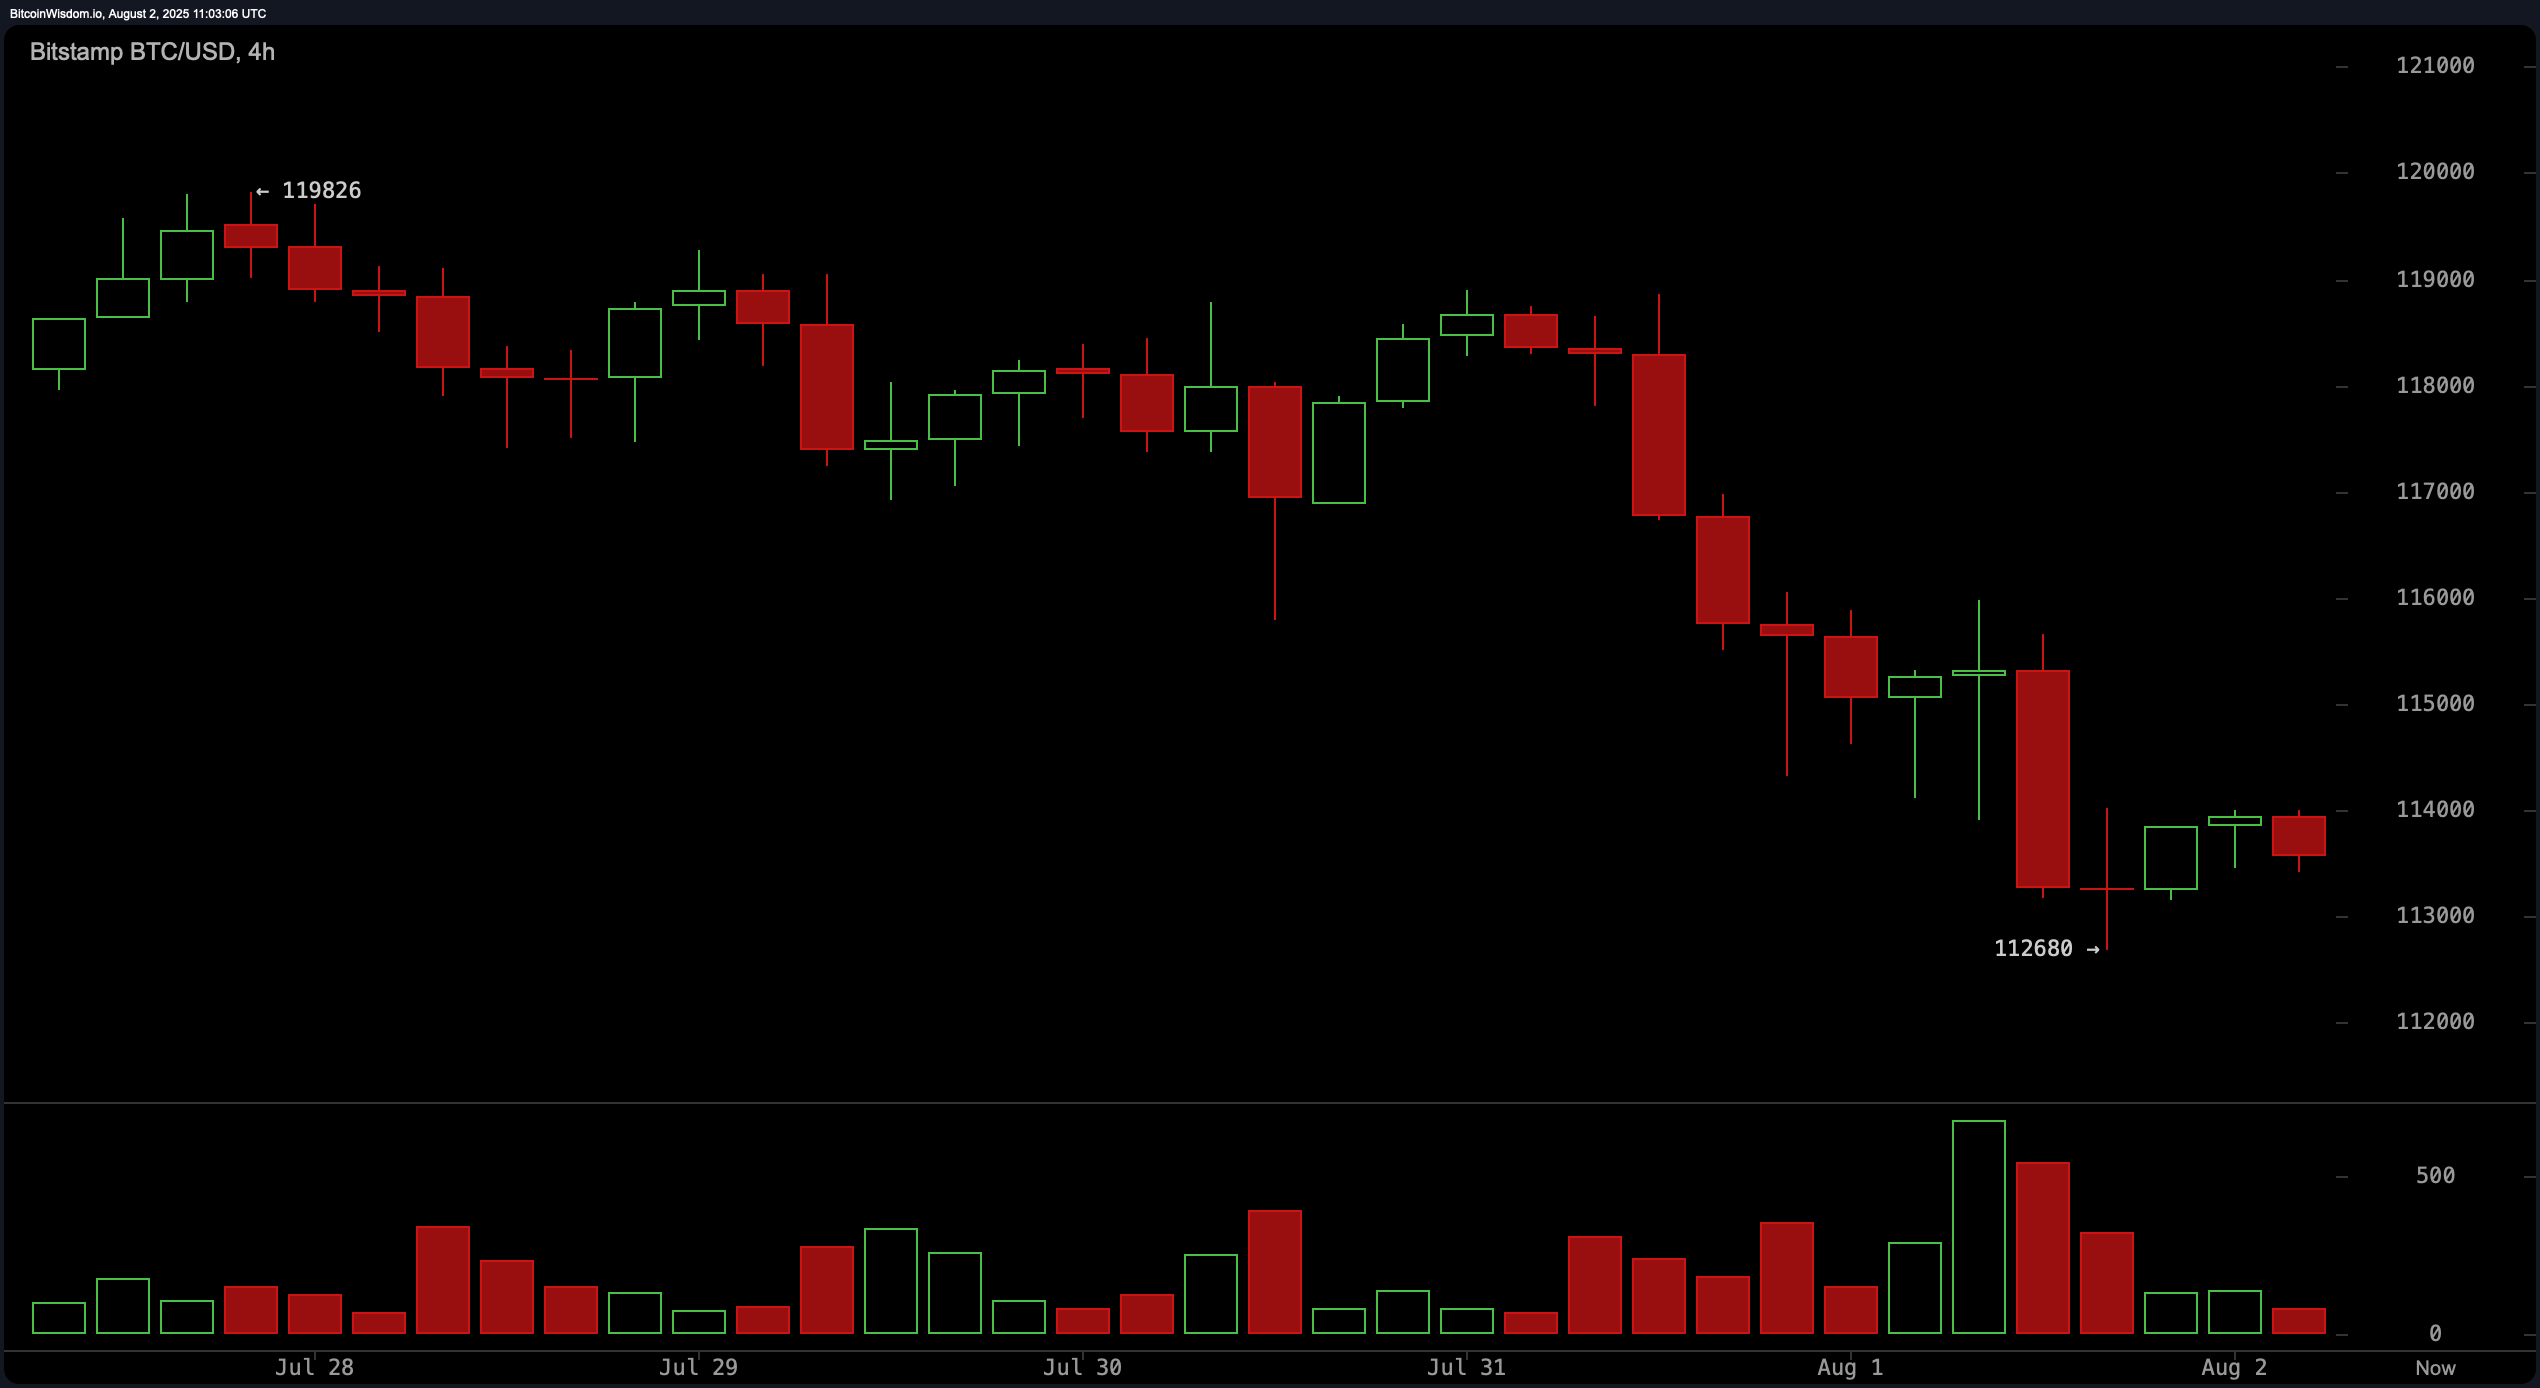
On the 4-hour chart, bitcoin displays pronounced bearish momentum, emphasized by the presence of bearish engulfing candles. The price has touched the support floor at $112,680, but attempts to recover have been weak, characterized by low-volume green candles. The market appears to be entering a possible consolidation zone between $112,500 and $114,500. A decisive break above this range with strong volume could initiate a short squeeze targeting $116,000, while a breakdown below $112,500 would affirm continued downward momentum.
The 1-hour BTC/USD chart confirms a microstructure of lower highs and lower lows, reinforcing the current short-term bearish trend. Although there has been a modest bounce from the $112,680 level, volume remains underwhelming, and candlestick patterns lack conviction. Immediate resistance lies between $114,200 and $114,500. A clean breakout above this level may prompt a short-lived bullish move, but a failure to hold above $113,000 risks accelerating downside momentum.
Oscillators show mixed signals. The relative strength index (RSI) is neutral at 43, while the Stochastic is at 13, also reflecting neutrality. The commodity channel index (CCI) at -265 and momentum at -5,256 both suggest potential bullish conditions, contrasting with the moving average convergence divergence (MACD) level of 730, which implies a bearish signal. The average directional index (ADX) at 21 points to a weak trend, and the Awesome oscillator at 1,172 remains neutral. These readings suggest market indecision, with potential setups in either direction depending on volume and breakout confirmations.
Moving averages reflect a bearish short-term bias and a bullish long-term trend. The 10-, 20-, and 30-period exponential moving averages (EMAs) and simple moving averages (SMAs) all indicate bearish signals, with values above the current price. In contrast, the 50-, 100-, and 200-period EMAs and SMAs are below the current price and suggest bullish signals. This divergence signals a transitional phase where long-term investors remain optimistic, while short-term traders are reacting to recent price weakness. Positioning trades near the support or resistance thresholds with volume confirmation remains critical for managing risk in the current environment.
Bull Verdict:
If bitcoin maintains support above $112,500 and volume tapers off on sell-side pressure, there is potential for a bullish reversal toward $116,000 and possibly a retest of the $118,000 resistance. Continued strength in the 50-, 100-, and 200-period moving averages further supports a long-term bullish outlook, provided short-term consolidation resolves upward.
Bear Verdict:
Should bitcoin fail to hold $112,500 support and face rejection near $114,500, the bearish trend is likely to accelerate with a downside target near $110,000. The prevailing weakness in short-term momentum, confirmed by sell signals in key moving averages and lackluster buying interest, underscores a high-risk environment for bullish entries.