Bitcoin is approaching a critical area where chart resistance near $79,000 to $80,000 meets a major short liquidation cluster around $76,500. That setup suggests $BTC could make one more push higher to clear nearby liquidity before facing renewed downside pressure.
Bitcoin Eyes $79,000 as Trader Flags Repeat Top Pattern
Bitcoin may be moving toward another local top near $79,000 to $80,000, based on a chart shared by Ted on X. The weekly BTCUSD chart on Bitstamp shows Bitcoin trading near $75,000 after rebounding from a sharp drop earlier this year. The setup focuses on a pattern seen at the last two local tops, where price pushed above the high of the prior capitulation candle before reversing.
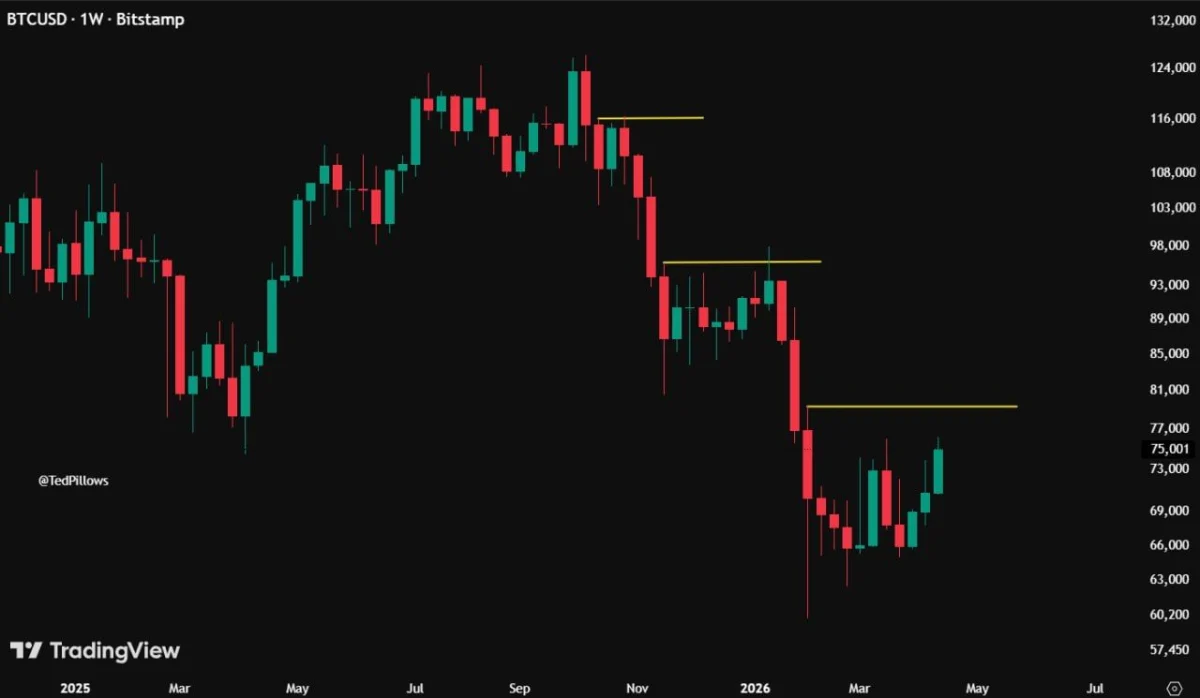
BTCUSD 1W. Source: TradingView,Ted on X
In the chart, the latest recovery follows a deep selloff that drove Bitcoin down toward the low $60,000 area. Since then, $BTC has climbed steadily and is now approaching the yellow marked resistance zone near $79,000. That area also lines up with the high of the most recent capitulation candle, which Ted says is the level to watch if the same pattern plays out again.
The broader point is simple. In the previous two topping formations, Bitcoin first reclaimed the capitulation candle high, then peaked shortly after. Because of that, Ted expects a similar move this time and says he plans to short $BTC in the $79,000 to $80,000 range if price reaches that zone.
Still, the chart does not confirm a top yet. Bitcoin remains below that resistance area, and the current rebound is still in progress. Therefore, the next move matters most: if $BTC pushes into that zone and stalls, it could strengthen the case for another local peak. If it breaks through cleanly, the pattern may fail.
Bitcoin Tracks Two Major Liquidity Zones as Traders Watch for a Sweep Higher
Bitcoin is moving between two major liquidation clusters, according to a heatmap shared by Ted on X. The chart points to a short liquidation zone near $76,500 on the upside and a long liquidation zone near $69,500 on the downside. Those areas now stand out as the main levels where market pressure could intensify.
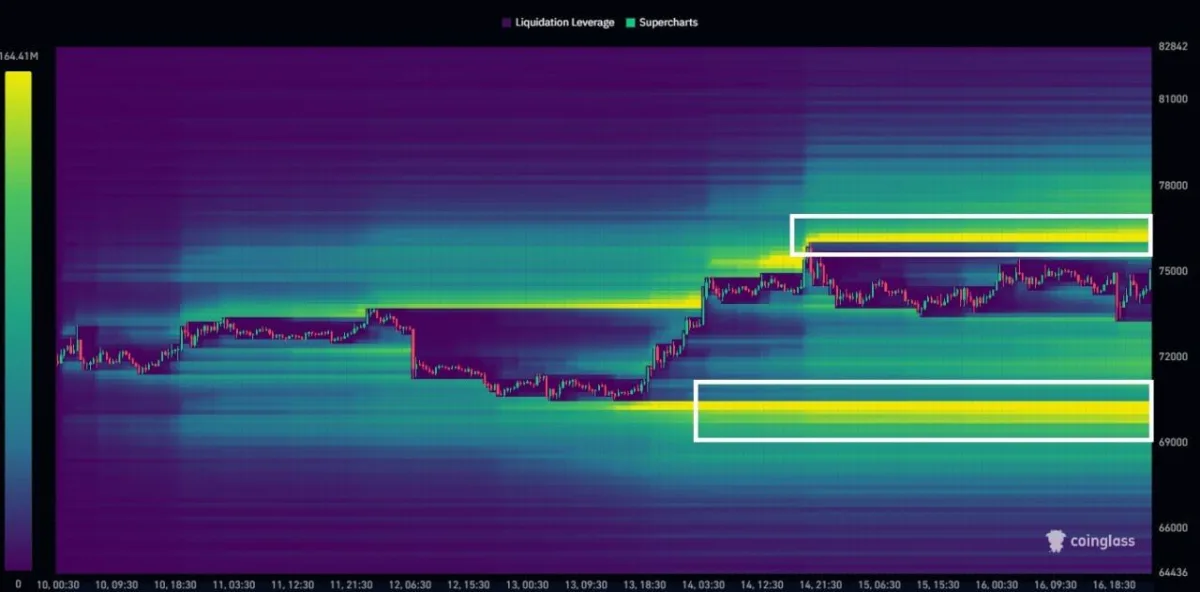
$BTC Liquidation Leverage Heatmap. Source: CoinGlass,Ted on X
The heatmap from CoinGlass highlights where leveraged positions are concentrated. Brighter yellow bands usually show heavier liquidity, which means price often moves toward those zones as positions get forced out. In this case, the upper cluster near $76,500 marks the main short squeeze area, while the lower cluster near $69,500 marks the larger downside liquidation pocket.
Ted said his base case is for Bitcoin to retest this week’s high before the broader downtrend resumes. That view suggests a possible move into the upper liquidity area first, followed by a reversal lower. If that happens, traders would likely watch whether the market then starts moving toward the lower $69,500 cluster.
The chart does not confirm that path yet, but it does frame the likely battleground. For now, Bitcoin remains caught between two strong liquidity magnets. Therefore, the next major move may depend on which side gets cleared first.