Bitcoin started the week with fresh pressure on both the short term and bigger picture charts. One chart shows price still trading under a falling resistance line, while another highlights a new CME gap above current levels, putting traders’ focus on whether $BTC can recover or stays stuck under key pressure zones.
Bitcoin Downtrend Claim Meets a Familiar Pattern
Ted Pillows says Bitcoin is still in a downtrend and that the rally is a bull trap. The chart shows short term weakness. However, it also shows a pattern seen in past cycles.
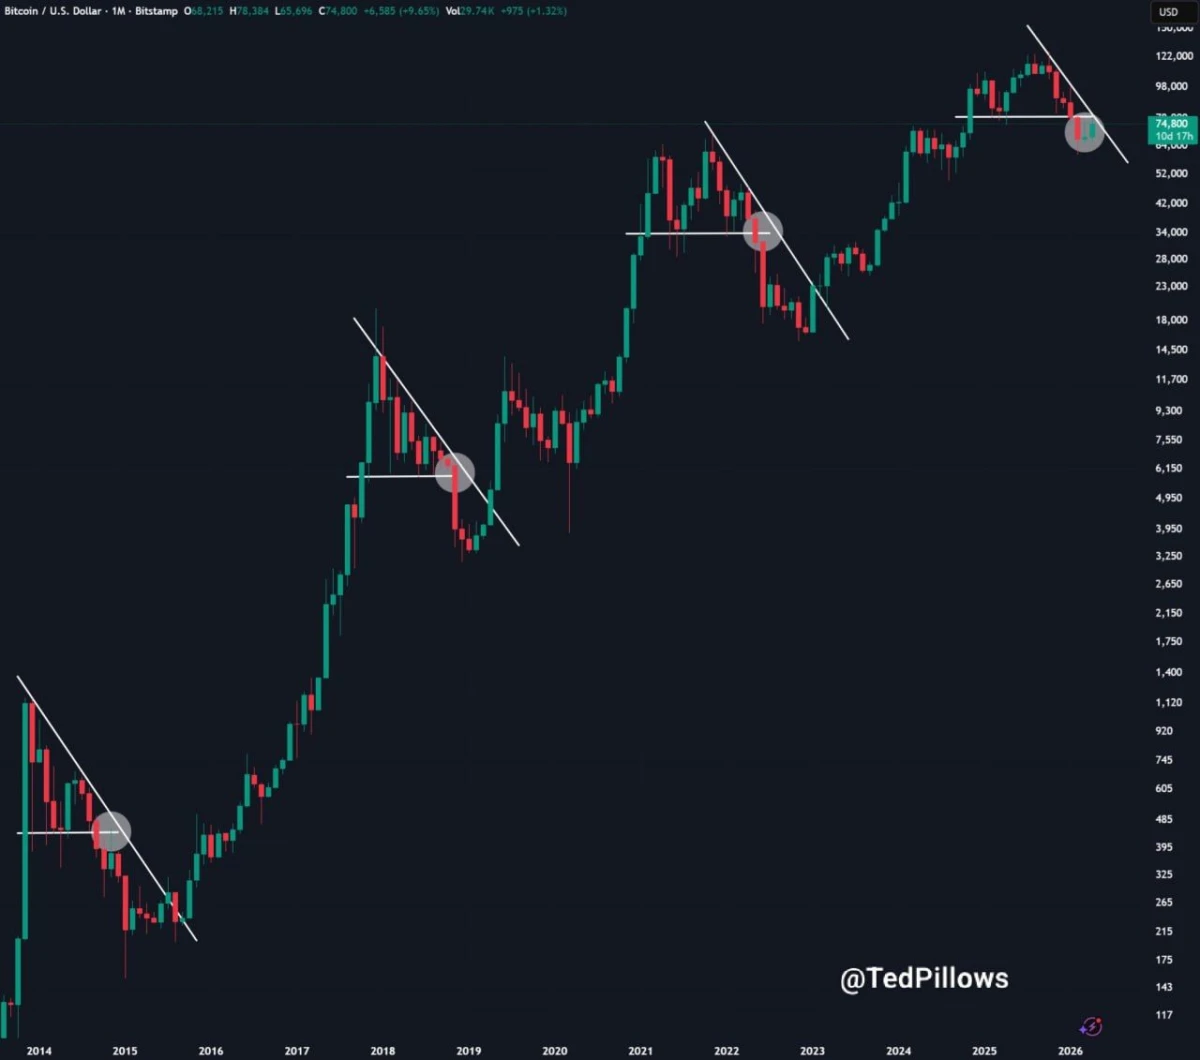
Bitcoin / U.S. Dollar Monthly Chart. Source: TradingView/Ted Pillows on X
In each cycle, Bitcoin fell under a descending trendline after a peak. Then it broke that line, retested a key level, and moved higher. The marked circles show those retests. Therefore, the current structure does not stand apart from earlier corrections.
Still, the latest section keeps the bearish case alive. Price remains under a descending resistance line on the right side of the chart. Until Bitcoin breaks above that structure, the downtrend argument remains valid in the short term.
Even so, the broader chart does not fully support the bull trap call. The larger structure still looks like a correction within a long term uptrend, not a clear trend failure.
New Bitcoin CME Gap Puts Focus on Early Week Volatility
Daan Crypto Trades points to a new CME gap on Bitcoin futures after the weekend move. The chart shows CME futures reopening well below Friday’s close, leaving an untraded area between roughly $74,900 and $77,500. That gap formed as stock futures opened lower, while oil moved higher after weekend headlines.
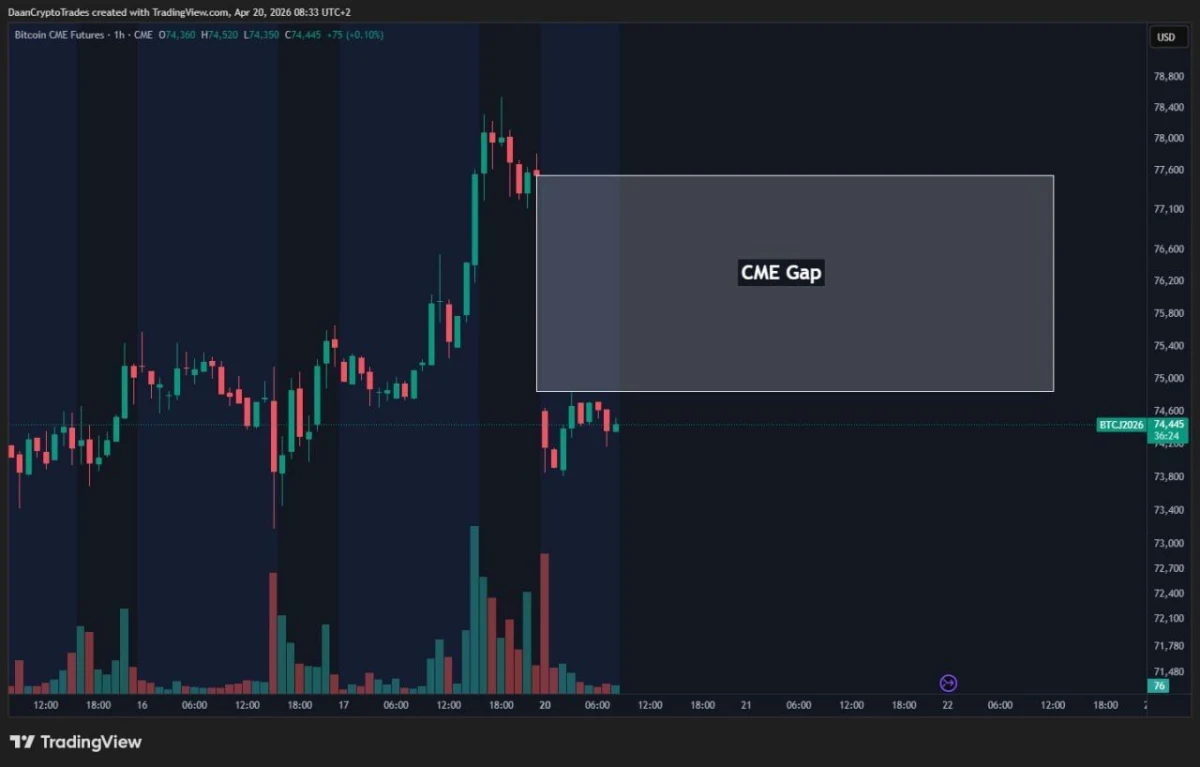
Bitcoin CME Futures 1 Hour Chart. Source: TradingView/Daan Crypto Trades on X
The setup matters because CME gaps often become short term reference zones for traders. In this case, Bitcoin futures reopened near $74,400 after trading much higher before the close. As a result, the market now has a wide overhead gap that could act as a magnet if price starts recovering. At the same time, it also marks a zone where sellers may step in if the bounce loses strength.
So far, the chart shows weak recovery rather than strong follow through. Price bounced slightly after the open, but it still sits far below the gap range. Therefore, the near term structure suggests caution. Bitcoin now enters the week with macro pressure in the background and a clear technical imbalance above current price. If momentum improves, traders will likely watch whether $BTC starts moving into that gap. If not, the lower reopening level may continue to define the short term tone.