Bitcoin is pushing into a critical zone where weekly resistance and short term whale sell orders are lining up. While the rally has stayed strong, the charts show $BTC still needs a clean break above $78,000 to clear the pressure building near $80,000.
Bitcoin Tests $78,000 Resistance as Weekly Breakout Wait Continues
Bitcoin has reached a major weekly resistance zone near $78,000, according to a chart shared by Elja. The image shows $BTC pushing back into a gray resistance band after recovering from a sharp drop earlier in 2026. That move signals strong momentum, but the chart suggests the market has now reached an area that could decide the next trend direction.
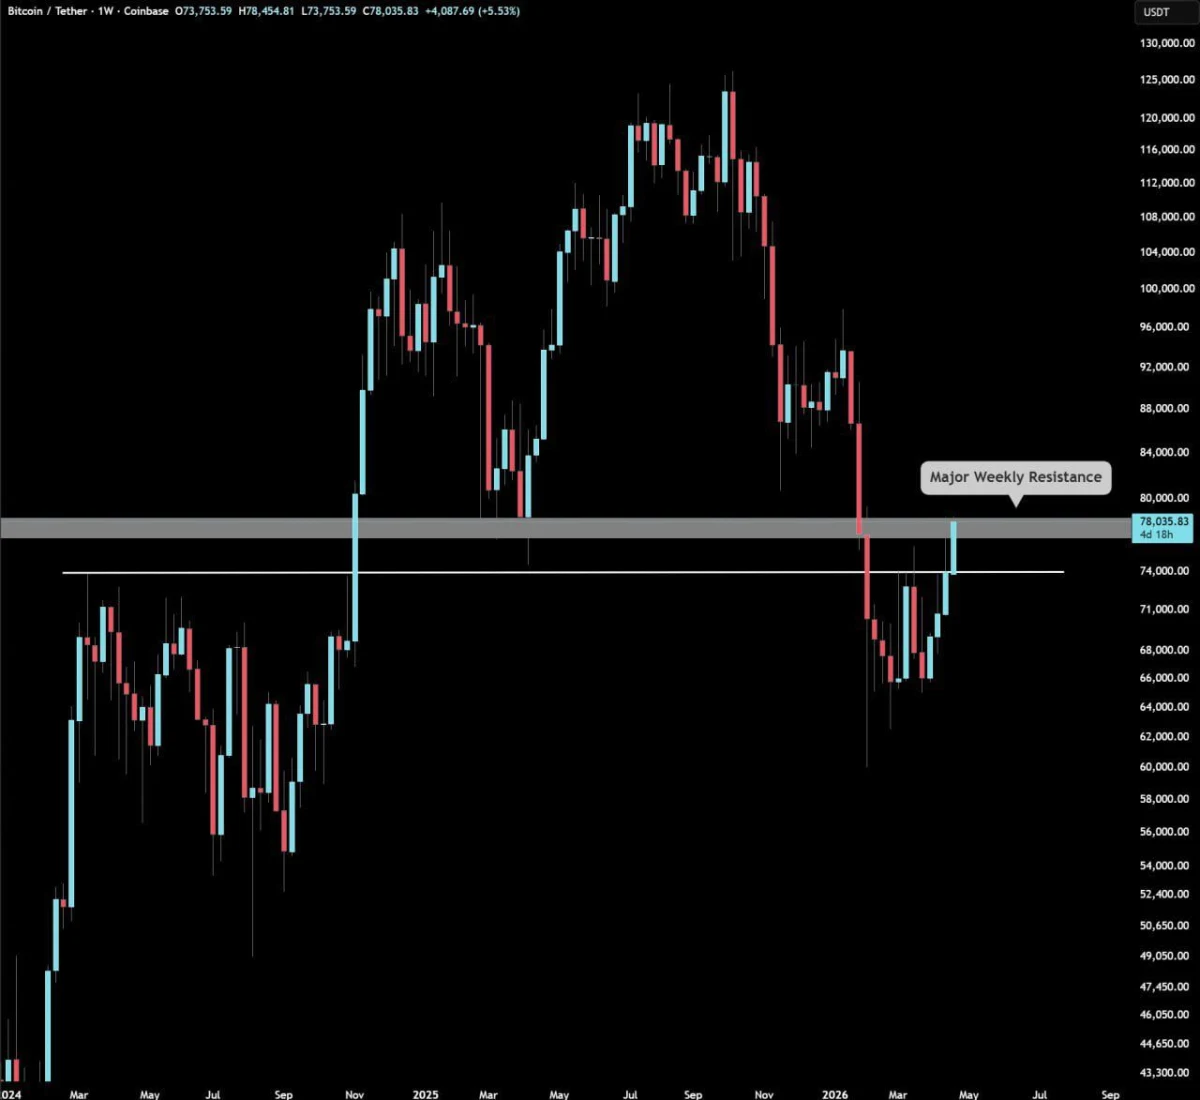
Bitcoin / Tether 1W Resistance Chart. Source: Elja on X
The setup matters because this zone appears to match a former support area that later turned into resistance. In other words, Bitcoin is now testing a level that previously played an important role on the weekly chart. The post also marks a white horizontal line below the gray band, showing that $BTC has already reclaimed one lower level, but still needs to clear the higher resistance area.
For now, the key point is confirmation. A weekly close above the $78,000 zone would strengthen the bullish case and suggest Bitcoin has flipped major resistance back into support. However, if $BTC fails to close above that band, the rally could lose strength and stall near current levels.
Bitcoin Faces Heavy Sell Wall Near $80,000 as Whale Bids Sit Lower
Bitcoin is trading into a dense sell zone between $78,000 and $80,000, according to the 15 minute whale orderbook chart from CoinGlass. The image shows stacked ask liquidity across that range, which suggests strong overhead resistance as $BTC trades near $77,900. In contrast, the largest visible bid sits much lower at about $75,731, with more than $217 million in buy interest.
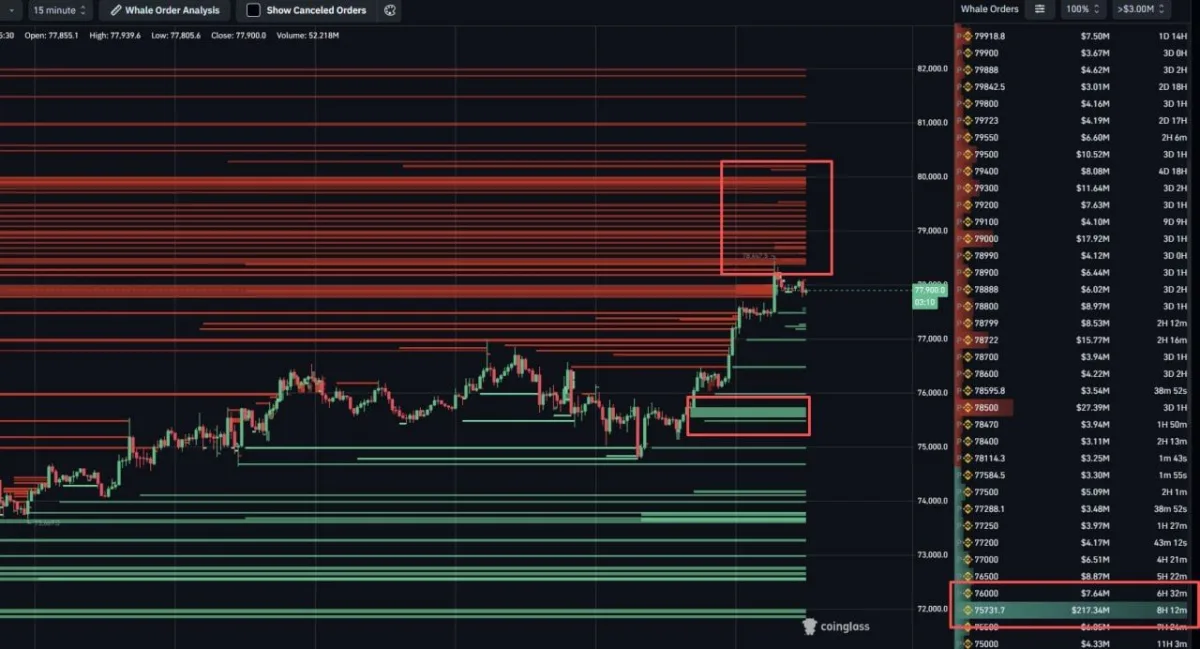
$BTC 15 Minute Whale Orderbook Analysis. Source: CoinGlass on X
That gap matters because it shows large traders are defending higher levels with sell orders while placing major buy support below the current price. In simple terms, the orderbook suggests upside may face friction near $78,000 to $80,000, while demand appears stronger closer to the mid $75,000 area. The chart also highlights multiple sell orders around $79,000 and $80,000, which adds to the resistance cluster.
For now, the setup points to a range where whales are active on both sides but not at the same levels. If Bitcoin breaks through the heavy sell wall, traders may read that as a sign of stronger momentum. However, if price gets rejected, the large bid near $75.7K could become an important support area.