BlackRock’s iShares Bitcoin Trust returned to focus last week after fresh ETF flow data showed strong institutional demand behind Bitcoin’s latest move. According to Arkham, IBIT clients bought about $732.6 million worth of $BTC during the week.
That figure accounted for most of the $823.7 million in total net inflows into U.S. spot Bitcoin ETFs. Farside Investors’ data reinforced that trend, showing IBIT posted daily inflows of $256 million, $39.3 million, $246.9 million, $167.5 million, and $22.9 million between April 20 and April 24. That made BlackRock the clear driver of the rebound in weekly ETF demand.
IBIT Drives Weekly ETF Demand
The inflows reinforced BlackRock’s role as the largest institutional gateway into Bitcoin exposure. The firm’s official iShares page listed IBIT’s net assets at about $63.03 billion as of April 24.
The fund trades on Nasdaq and tracks the CME CF Bitcoin Reference Rate. Arkham’s dashboard also showed that BlackRock held more than $69.7 billion in total assets, underscoring its scale in the market.
That buying activity mattered as ETF issuers source coins to match new share demand. That process can tighten the available supply and support price action when inflows remain consistent, especially during periods of improving investor confidence.
IBIT Inflows Match Bitcoin’s Bullish Price Action
The ETF demand was reflected in last week’s price action. According to TradingView data, Bitcoin opened the week near $74,023 and climbed more than 7% to a weekly peak around $79,485 on Wednesday. However, the move stalled near that zone.
The token later pulled back toward the $77,541-$77,075 support area, which aligned with the 38.20% Fibonacci level, making it a key level for traders. Nevertheless, Bitcoin later closed the week near $78,685, keeping the broader structure constructive despite the rejection near $79K.
$79K Resistance Remains the Major Test
This week, Bitcoin began with a brief bullish push, but the token again failed to break the $79,000 resistance area. At press time, $BTC hovered near $77,000, down about 1.5% on the day.
The current structure shows Bitcoin trading inside a narrowing range, with price rejected near the upper resistance trendline. A clean breakout above $79,485 could strengthen bullish momentum and open the path toward the $80,000–$90,000 region.
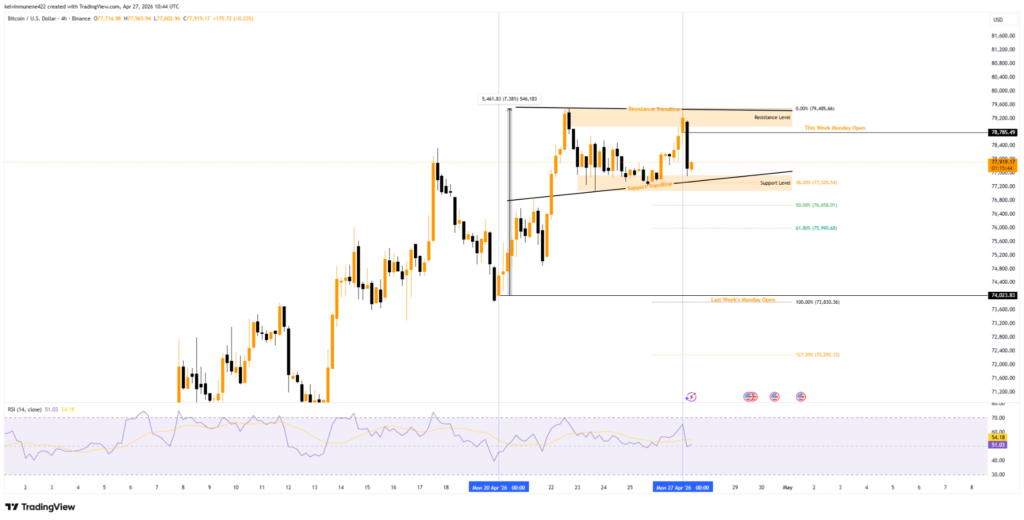
Source: TradingView
On the downside, immediate support remains near $77,541–$77,075. Below that, deeper Fibonacci levels at $76,658 and $75,990 could become important if selling pressure increases.
Meanwhile, the RSI stood near 51, showing neutral momentum. That reading indicated neither overheated buying nor dominant selling pressure, leaving the $79K area as the main level traders continued to monitor.
Related: TRON and HTX Commit $20M USDT to Aave V3 to Support TRON Expansion