The pioneer cryptocurrency Bitcoin ($BTC) retraced from its weekly high of $82,833 amid the renewed uncertainty in the middle east war. The pullback gained additional momentum as $BTC’s futures logged their 67th straight day of negative funding rates— a move that highlights sellers’ conviction for a prolonged correction in its price. However, the historical data identifies this setup sets the stage for a potential recovery in the market. Here are key levels to watch in Bitcoin price in May 2026.
Why Bitcoin Price Reverted From $83,000 Barrier
Bitcoin price is up 0.18% on Saturday to trade at $80,344. This shallow uptick follows the re-escalating geopolitical tension as U.S. airstrikes against Iranian military facilities, Following attacks on American naval destroyers in the Strait of Hormuz.
President Donald Trump has called this strike a “Love tap” in an ABC interview, while adding that the ceasefire with Iran is still intact but harder action is possible if Tehran refuses a deal. The move triggered notable volatility in oil market prices as benchmark index Brent Crude rose 2.9% to approximately $103 per barrel.
Thus, the broader crypto market witnessed a quick pullback, dragging $BTC to $80,000 level.
What Are Funding Rates, and Why Do They Matter Now?
Perpetual futures contracts are those that are not bound to expire ever, and that track the Bitcoin spot price, in which exchanges implement a periodic payment scheme called funding rate, to ensure that the price of the perpetual market remains grounded. When the majority of traders are bullish and long positions dominate, long holders pay short sellers. The opposite is when bearish sentiment gains the upper hand and shorts stack up – the shorts pay the longs.
If the funding rate is negative, it indicates an imbalance in the market, favoring wagers against the market. Short sellers are paying a continuous, compounding cost to maintain their positions.
According to K33 Research, the Bitcoin futures funding rates have been negative for straight 67 days, projecting its longest streak in a decade. Such a long period highlights short sellers’ determination to pay premium to long holders and hold their position against Bitcoin even during a recovery momentum.
“I care about this regime for one simple reason: timing,” said Vetle Lunde, Head of Research at K33. “Lasting negative funding rates have a very strong track record of flagging where you should buy with conviction.”
History Says Bitcoin Often Rallies After Extended Negative Funding
When K33’s data is compared with on-chain analytics providers such as Glassnode and CoinGlass, it shows a similar trend in every case of long periods of negative funding.
The COVID Crash Bottom occurred in March 2020: The world markets froze and Bitcoin lost control and dropped to $3,800. Traders started to bet further price drops, leading to funding rates going sharply negative. Rather, the bottom was created and Bitcoin entered a record run that saw it surpass $60,000 within a year.
June – August 2021 – China Mining Ban: Bitcoin’s future was suddenly placed under a cloud of fear following Beijing’s sudden ban on crypto mining. The price slipped back to $30,000 and funding rates turned negative for 49 days. The market calmed, the shorts started to give way and Bitcoin rallied to a new all-time high later that year.
November 2022 – The FTX Collapse: FTX, one of the world’s largest crypto exchanges, has collapsed, leaving a shudder in the crypto industry. Funding turned into a negative and open interest increased on the short side as traders took on more contagion bets and the price of Bitcoin settled around $15,500. It had reached $23,000 when the short side had essentially all capitulated by the end of January 2023.
2023 — Silicon Valley Bank Crisis: Negative funding coincided with a brief fall in Bitcoin price to under the $20,000 mark during the banking crisis.The negative funding coincided with a slight drop in Bitcoin’s price to under $20,000 during the banking stress. Within a few weeks, a recovery occurred.
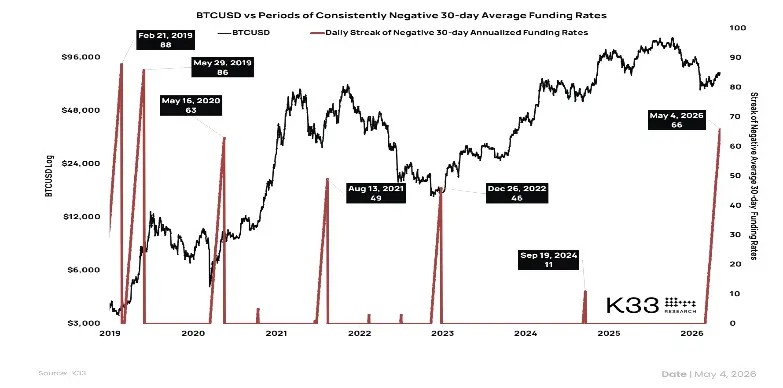
In each of these instances, the theme is the same: short sellers have been piling on for a long time and they go wrong — and when they begin to cover the squeeze makes the rally even bigger.
The Short-Squeeze Coiling Beneath the Surface
The current situation is very volatile, especially because of the structure of open interest. On major exchanges, open interest is also going up but funding continues to be in negative territory, where new short trades are being made and not unwinding. The combination of rising open interest and negative funding is a classic “loaded spring” set-up: With fuel increasing for a short squeeze, waiting for a catalyst to set it off.
This week, FxPro chief market analyst Alex Kuptsikevich highlighted that Bitcoin surged to $82.8K on Wednesday and failing to breach 200-day moving average, is “not a sign of buyer exhaustion,” and a few analysts have pointed to $83,200 as the technical threshold that if breached could lead to a forced short cover and ascent to $93,000.
K33 also pointed out that Bitcoin activity on the Chicago Mercantile Exchange (CME) has remained quiet even as the cryptocurrency has regained ground, as overall institutional positioning is far from the high of 2024 and 2025. Participation is still resuming, but with a certain hesitation.
Bitcoin Price at a Crossroad as Channel Breakout May Fail
Over the past week, the Bitcoin price showed a notable rally from $74,912 to a weekly high of $82,833. Amid this recovery, the coin buyers gave a decisive breakout from the resistance trendline of a rising channel pattern in daily charts.
While the breakout was expected to further fuel the bullish momentum, the escalated geopolitical tension pushed Bitcoin $BTC0.74% within the channel range again to trade $80,388. This could be a retesting period for Bitcoin price to reattempt channel breakout and bolstering its position for a continued recovery.
The post-breakout rally could challenge immediate resistance of $84,330, followed by a leap to $98,000.
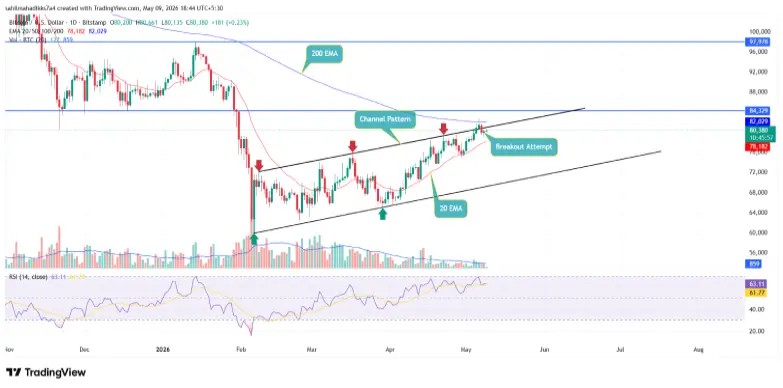
On the contrary, if sellers continue to defend the channel resistance at $81,300 mark, the Bitcoin price could witness renewed selling pressure and potential retest of $73,500 support.