Bitcoin ($BTC) has climbed roughly 40% from its February lows, bringing the price back to a critical resistance zone that could determine whether the bear market continues or finally ends.
Key takeaways:
- Bitcoin fell 2.25% to around $80,500 after failing once again to break above its 200-day EMA resistance.
- Previous rejections from the same technical level triggered Bitcoin declines of 25% and 36%.
Bitcoin bulls must decisively break key trend line
As of Monday, $BTC/USD was down 2.25% near $80,500, erasing its overnight gains as buyers once again failed to clear the 200-day exponential moving average (200-day EMA, blue line).
The level has capped Bitcoin’s rebound attempts since November 2025. Each rejection from the 200-day EMA has preceded steep drawdowns of 25% and 36%, respectively, putting the average decline near 30%.
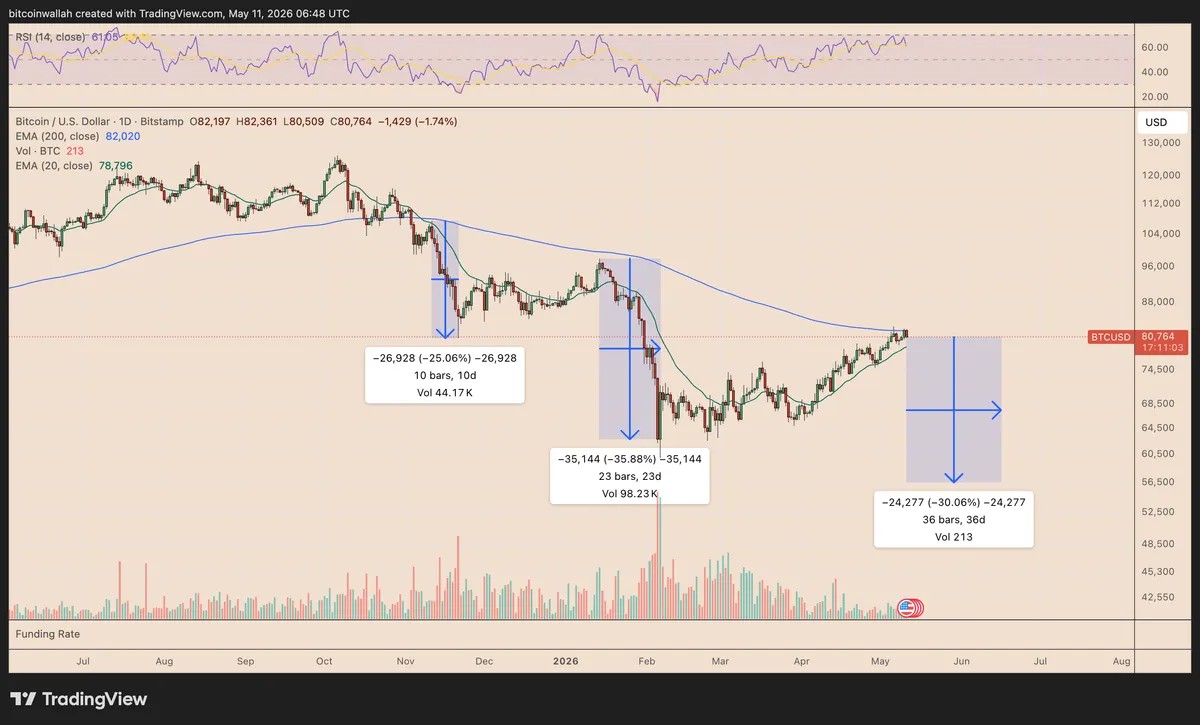
$BTC/USD daily chart. Source: TradingView
In his Monday post, analyst Brett said breaking above the 200-day EMA, currently near $82,580, could be “the end of the bears.” But given Bitcoin’s ongoing pullback, the prospects of $BTC falling further in the coming sessions appear higher.
$BTC’s price could fall toward $56,600 from current levels if it repeats its average 30% drawdown from the 200-day EMA rejection zone.
$BTC price “lifetime support” model shows $56,000 floor
The $56,600 level aligns closely with Bitcoin’s broader macro support range.
A new Bitcoin Lifetime Support Model, highlighted by analyst PlanC, places $BTC’s long-term upper support band near $57,110. The lower support was roughly around the $46,760 level.
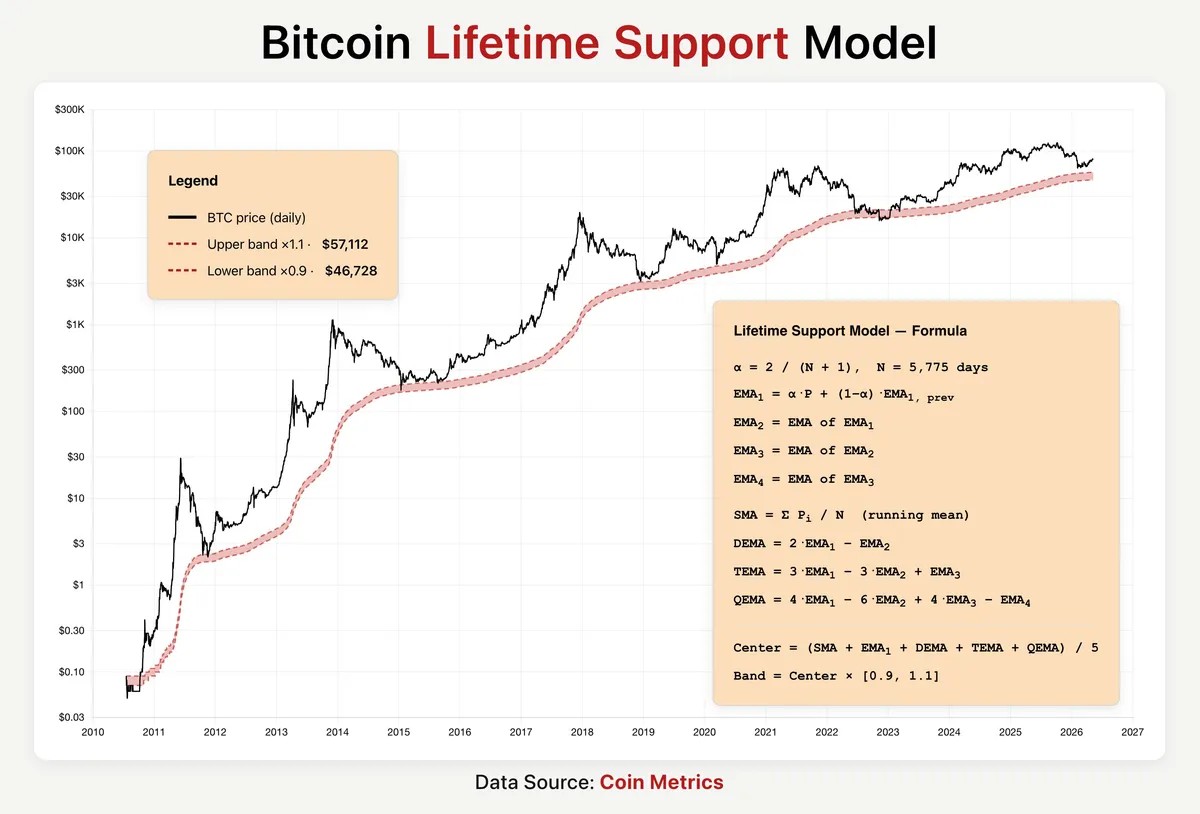
Bitcoin lifetime support model. Source: Coin Metrics/PlanC
The model averages Bitcoin’s lifetime simple moving average with its single-, double-, triple- and quadruple-EMAs, then plots a 10% band around the result.
Historically, similar lifetime support zones have acted as macro bear-market floors. That means Bitcoin’s immediate setup remains bearish, but a decline toward the mid-$50,000s would still place $BTC near a major long-term support area.
Bitcoin’s still unresolved bear flag pattern also hints at a potential drop below $60,000 in the coming weeks, as shown below.
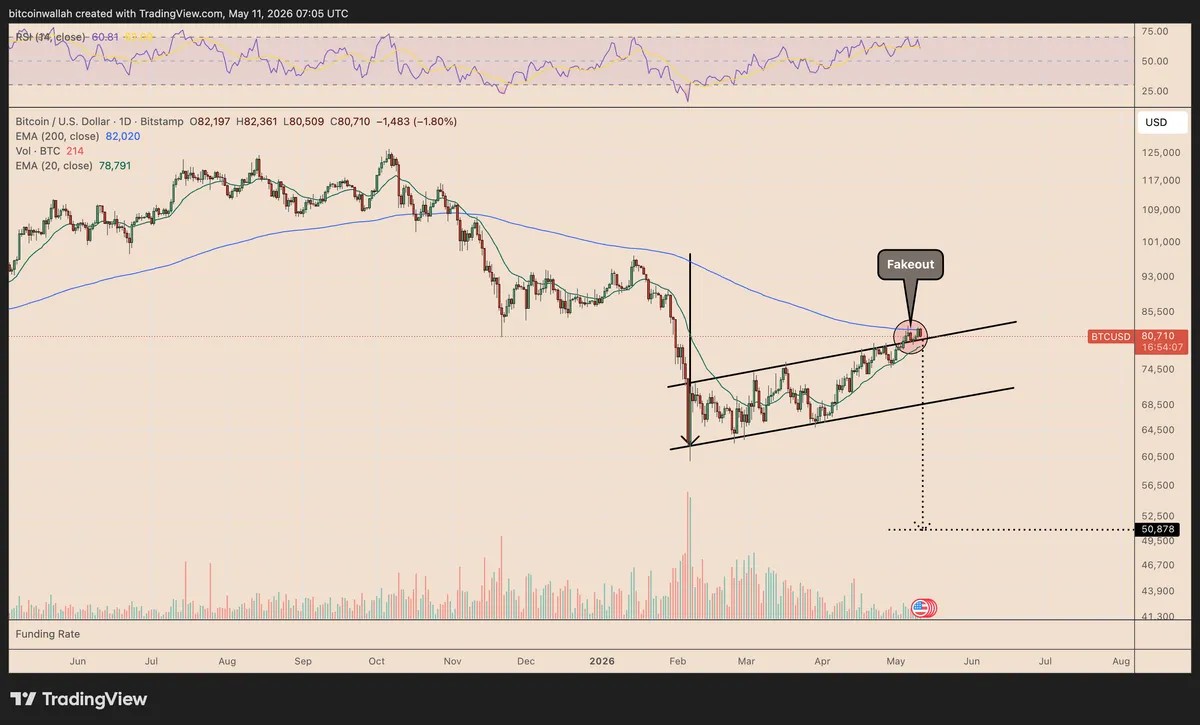
$BTC/USD daily chart. Source: TradingView
Bitcoin’s 2026 rebound mirrors past cycle bottoms
Despite the near-term bearish setup, Bitcoin’s latest rebound from the 200-week simple moving average (200-week SMA, blue line) is flashing a historically bullish signal.
$BTC bounced by over 38% after testing the 200-week SMA near $61,000. This blue level closely aligns with major cycle bottoms seen in 2018 and during the March 2020 crash.
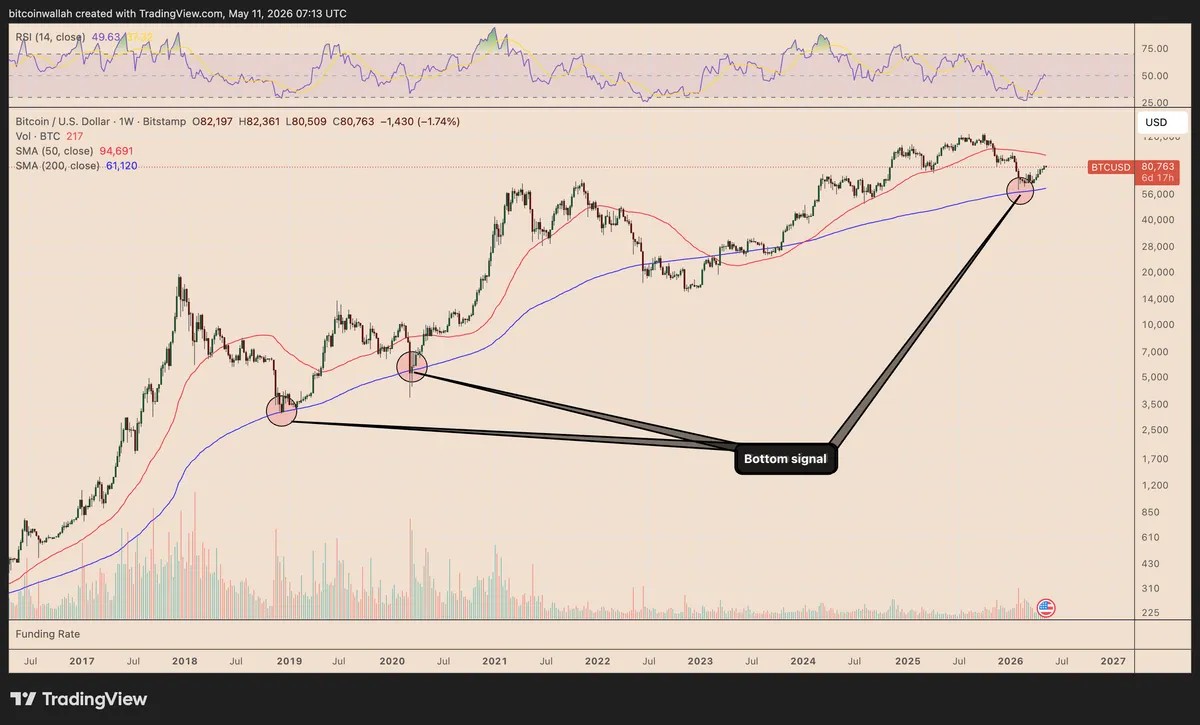
$BTC/USD weekly chart. Source: TradingView
In both prior instances, Bitcoin briefly dipped toward or below the 200-week SMA before staging a sustained recovery toward the 50-week SMA (red).
Related: Analyst says Bitcoin’s $60K bottom signals weaken bear-market forecast
Bitcoin’s next upside target could be near $94,700, up roughly 17% from current price levels, if the fractal continues to play out. A move that high could support Brett’s view that the bear market is nearing its end.
The bullish outlook is also backed by strong fundamentals, including aggressive whale accumulation that recently absorbed nearly 500% of Bitcoin’s newly issued supply.
This article is produced in accordance with Cointelegraph’s Editorial Policy and is intended for informational purposes only. It does not constitute investment advice or recommendations. All investments and trades carry risk; readers are encouraged to conduct independent research.
Leave a Reply
You must be logged in to post a comment.