ETF inflows hit $630 million the day before Bitcoin flipped Tesla in market cap — and calling it a coincidence requires ignoring how markets actually work.
On May 10, @LLuciano_$BTC , a well-known market enthusiast posted what became one of the most shared crypto milestones of the week:
Bitcoin surpassing Tesla to become the world’s 12th largest asset globally. The post pulled 83,900 views in hours. Few people traced the fuel behind it back to May 1.

The $630M That Nobody Talked About Enough
On May 1, U.S. spot Bitcoin ETFs attracted net inflows of $630 million in a single day — underscoring sustained institutional demand.
Simultaneously, spot Ethereum ETFs posted $101 million in inflows, marking a recovery after recent outflows.
The May 1 session crystallized a broader shift — snapping a three-day ETF outflow streak.
Fidelity added $19 million into its FBTC product, a concrete sign that institutional conviction was returning.
Spot Bitcoin ETFs then stacked nine straight green days of inflows totalling $2.7 billion — with the $629 million day on May 1 as the opening move.
Every dollar of net inflow corresponds to roughly the equivalent dollar of $BTC being acquired and locked in custody — where it is unlikely to return to circulation.
That is not speculative buying. That is structural supply removal.
April 2026 saw nearly $2 billion in net ETF inflows — the strongest monthly figure of the year.
May has already recorded over $600 million in net inflows in its first days alone.
The institution that buys through an ETF does not sell on a Trump tweet. That bid is patient. And it is compounding.
What the Charts Are Showing on May 11
BTCUSD (Weekly): As of May 11, 2026 (06:14 UTC), Bitcoin trades at $80,919.37, down -1.56% on the week — a pullback after touching $82,439 at the highs.
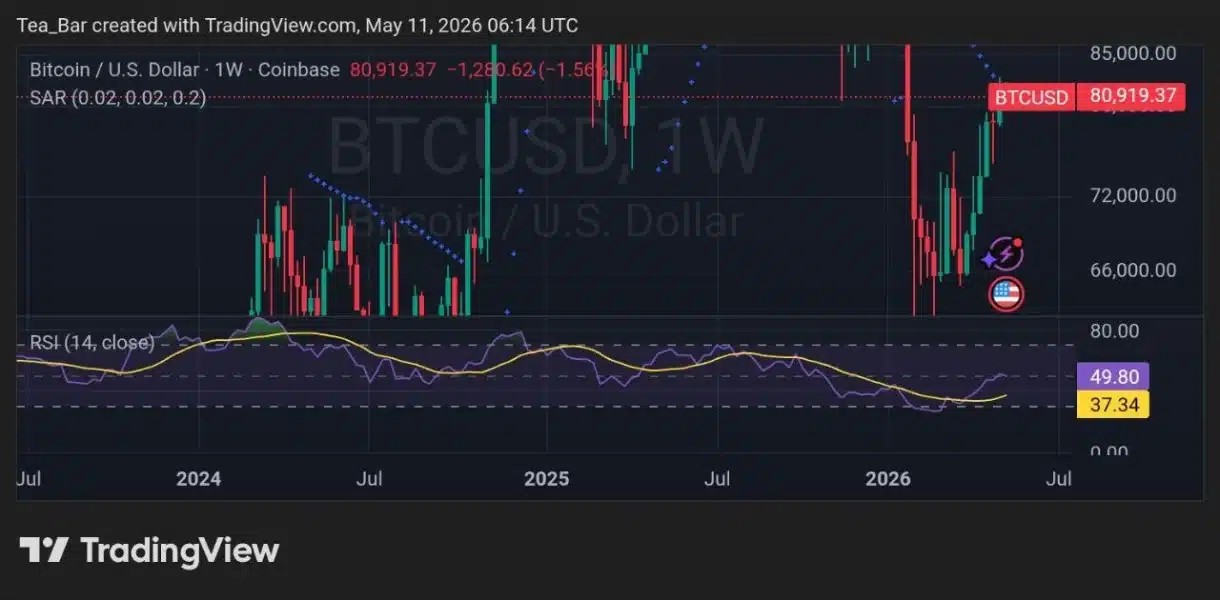
The Parabolic SAR on the dotted red line sits above price, keeping the weekly trend technically bearish.
The RSI at 49.80 is mid-range — not overbought, not oversold.
The RSI signal at 37.34 is still climbing from deeply depressed levels, suggesting the longer-term momentum picture is still improving despite the weekly pullback.
Looking at the full cycle from 2023 to now, every major $BTC leg higher began while the weekly RSI was still sub-50 and rising — the exact setup visible today.
BTCUSD (Daily): As of writing, Bitcoin trades at $80,939.13, down -1.53% on the day.
The Bollinger Bands show the upper band at $82,439.18, the mid-SMA at $78,884.00, and the lower at $75,328.82.
Price is pulling back from the upper band — a technically normal development after a multi-week advance.
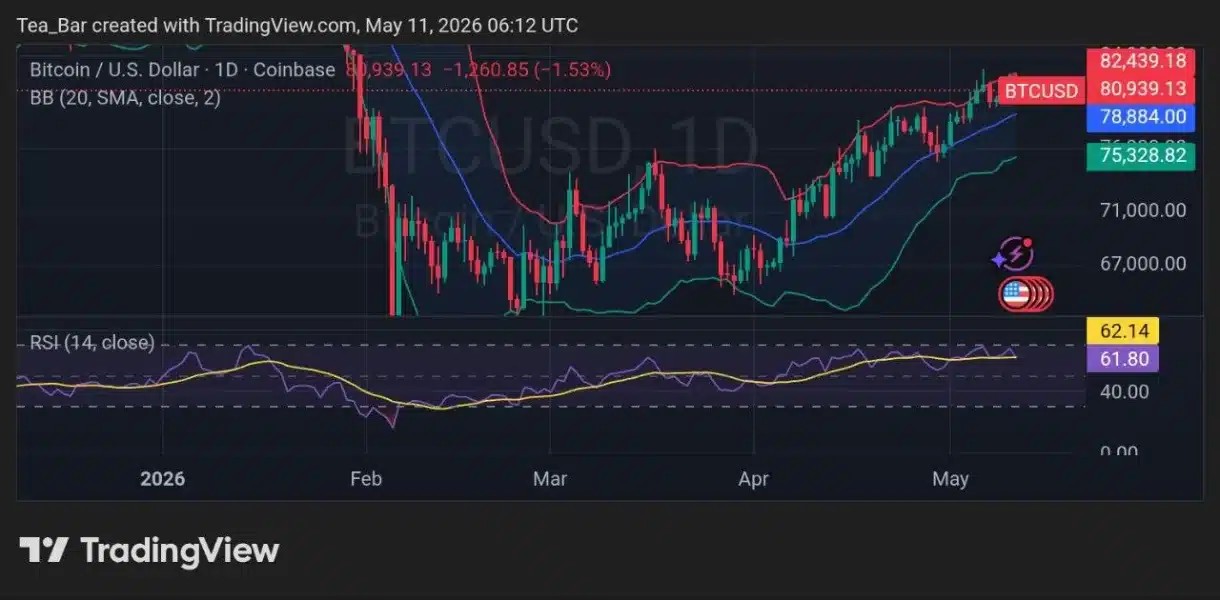
The daily RSI at 62.14 remains firmly bullish. The signal at 61.80 is in lockstep — both rising, neither near overbought.
The mid-SMA at $78,884 is the key daily support level. As long as price holds above it on a closing basis, the trend structure remains intact.
The Milestone That Changes the Conversation
Bitcoin passing Tesla is not just a number. It is a category shift. U.S. spot Bitcoin ETFs pulled in approximately $2.44 billion during April 2026 — the strongest monthly figure of the year.
On May 4 alone, inflows hit $532 million, driven by BlackRock’s IBIT and Fidelity’s FBTC.
When an asset backed by that kind of sustained institutional inflow overtakes the world’s most famous tech stock in market cap, it stops being a speculation story.
It becomes an allocation story — and those tend to move much slower, much larger, and much longer than any trade.
The question is no longer whether institutions are taking Bitcoin seriously. The question is how far up the global asset rankings they are willing to take it.
Disclaimer:
This article is for informational purposes only and does not constitute financial, investment, or trading advice. The views expressed are based on publicly available data, market observations, and the author’s interpretation at the time of writing. Cryptocurrency markets are highly volatile and unpredictable, and past performance or current technical setups do not guarantee future results. Readers should conduct their own research and consult with a qualified financial advisor before making any investment decisions. TechGaged does not accept liability for any losses incurred based on the information presented.
Leave a Reply
You must be logged in to post a comment.