Bitcoin price fell below $70,000 for the first time since April 7 as crypto markets faced renewed selling pressure. $BTC dropped roughly 3.8% to 4.9% during the session, reaching intraday lows between $69,325 and $69,690 before recovering slightly.
The decline came as traders reacted to a mix of geopolitical tension, which caused nearly $800 million in leveraged positions to be liquidated across the broader crypto market, according to data from CoinGlass.
The move also followed a Trump-style post shared by the @TrumpTruthOnX commentary account, which called for Iran to admit defeat and sign “Documents of Surrender.” The post said Iran should acknowledge that its navy was “resting at the bottom of the sea,” that its air force was “no longer with us,” and that its remaining military should leave Tehran with weapons dropped and hands raised.
The post also criticized major U.S. media outlets and Democrats, saying they would portray Iran as victorious even under a surrender scenario. The message drew attention as traders monitored U.S.-Iran talks, military exchanges, and the future of shipping access through the Strait of Hormuz.
U.S.-Iran Tensions Add to Market Stress
Bitcoin’s drop came as negotiations between the United States and Iran remained unstable. Iran’s negotiating team reportedly paused communication through mediators, while military exchanges continued to test a fragile regional ceasefire.
President Donald Trump said negotiations were continuing “at a rapid pace” and expressed hope that a deal could reopen the Strait of Hormuz. Reports also said delays were tied to requested changes in a draft agreement and Iranian concerns over past U.S. compliance.
Iran also demanded a halt to expanding Israeli military operations against Hezbollah in Lebanon as part of the conditions for a final peace agreement with the United States. The regional tension added to risk-off trading across crypto markets.
Bitcoin supply in loss also rose to about 40.6%, showing that a large share of circulating value is now held below its acquisition cost. Historical data shows that past cycle lows have formed when this metric moved into higher loss zones, though each new cycle has required a lower loss threshold than earlier ones.
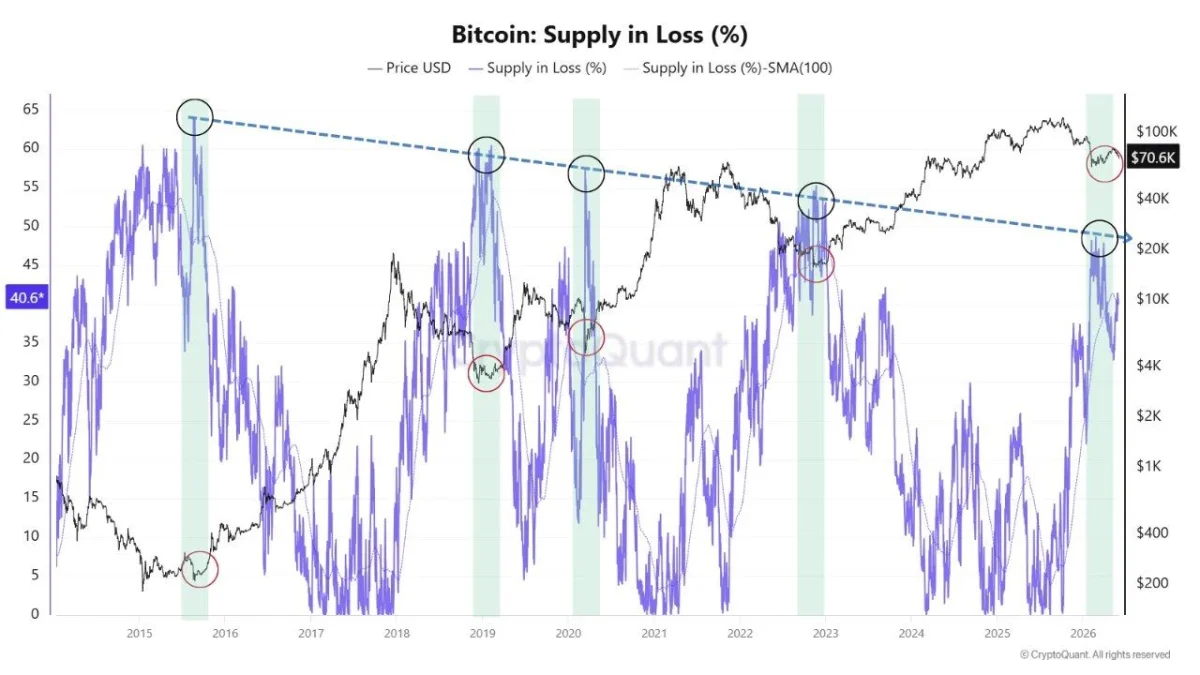
Source: CryptoQuant
The current reading shows market stress, but it has not yet reached the upper band that has marked some past accumulation zones. Bitcoin remains below its former support at $71,305, while $68,589 is the next near-term level traders are watching.
ETF Outflows and Equity Rotation Weigh on Crypto
Spot Bitcoin ETFs recorded their 10th to 11th straight day of net outflows, with total withdrawals estimated between $2.97 billion and $3.5 billion during the streak. The outflows added pressure to Bitcoin as institutional demand weakened.
At the same time, U.S. equities continued moving higher. The S&P 500 pushed above 7,600 points to record levels as investors continued buying artificial intelligence-related stocks. That shift showed capital moving toward traditional equity markets while crypto remained under pressure.
Bitcoin also failed to follow other risk assets higher. $BTC moved near $69,631 on Bitstamp while major stock indexes advanced. The divergence added to the view that crypto markets were facing their own liquidity and positioning pressures.
Source: X
Trader Ardi said the loss of $72,500 was important because Bitcoin had broken multiple support levels across different timeframes. He said the next major liquidity area was around $68,700 unless $BTC quickly reclaimed the lost range.
Indicators have also pointed to weakness after Bitcoin fell through another Timescape level. The trading resource said the $68,000 to $69,000 range would be the next test. It also said a further decline could bring the 200-day simple moving average back into focus.
$BTC Loses $70,000 Support, What Next?
Bitcoin’s fall below $70,000 came after the asset broke several major short-term technical levels. The price lost the lower boundary of an ascending channel that had supported its recovery through April and May.
According to crypto analyst Ali Charts, $BTC also moved below the 100-day simple moving average, which is often used as a medium-term trend marker. A break below that line can show that short-term momentum has shifted away from buyers.
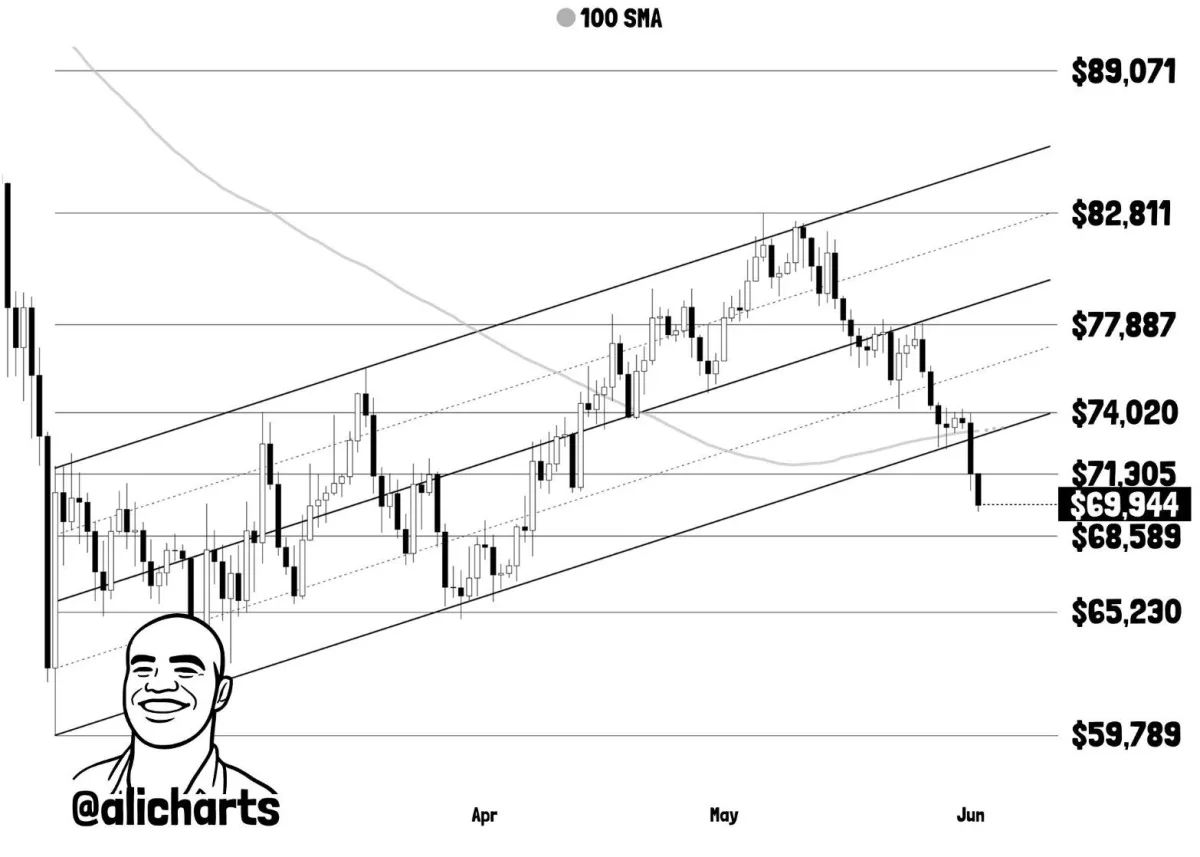
Source: X
Another key level lost during the sell-off was the 0.5 Fibonacci retracement near $71,305. That area had acted as support, but it may now become resistance if Bitcoin attempts a rebound.
The latest chart data showed $BTC hovering near $69,944, with immediate support around $68,589. A daily close below that level could increase the chance of a move toward $65,230. If selling continues beyond that range, the wider downside level sits near $59,789.
On the upside, Bitcoin would need to reclaim $71,305 to reduce immediate bearish pressure. A stronger recovery would require a move above $74,020, which lines up with the broken channel support. Higher resistance levels remain near $77,887 and $82,811.
Leave a Reply
You must be logged in to post a comment.