Bitcoin’s fall into oversold territory has led technical indicators to signal a possible recovery.
According to analysts, $BTC, which has lost approximately 30 percent of its value in the last month, has reached its lowest Relative Strength Index (RSI) level since the pandemic-induced market crash of 2020.
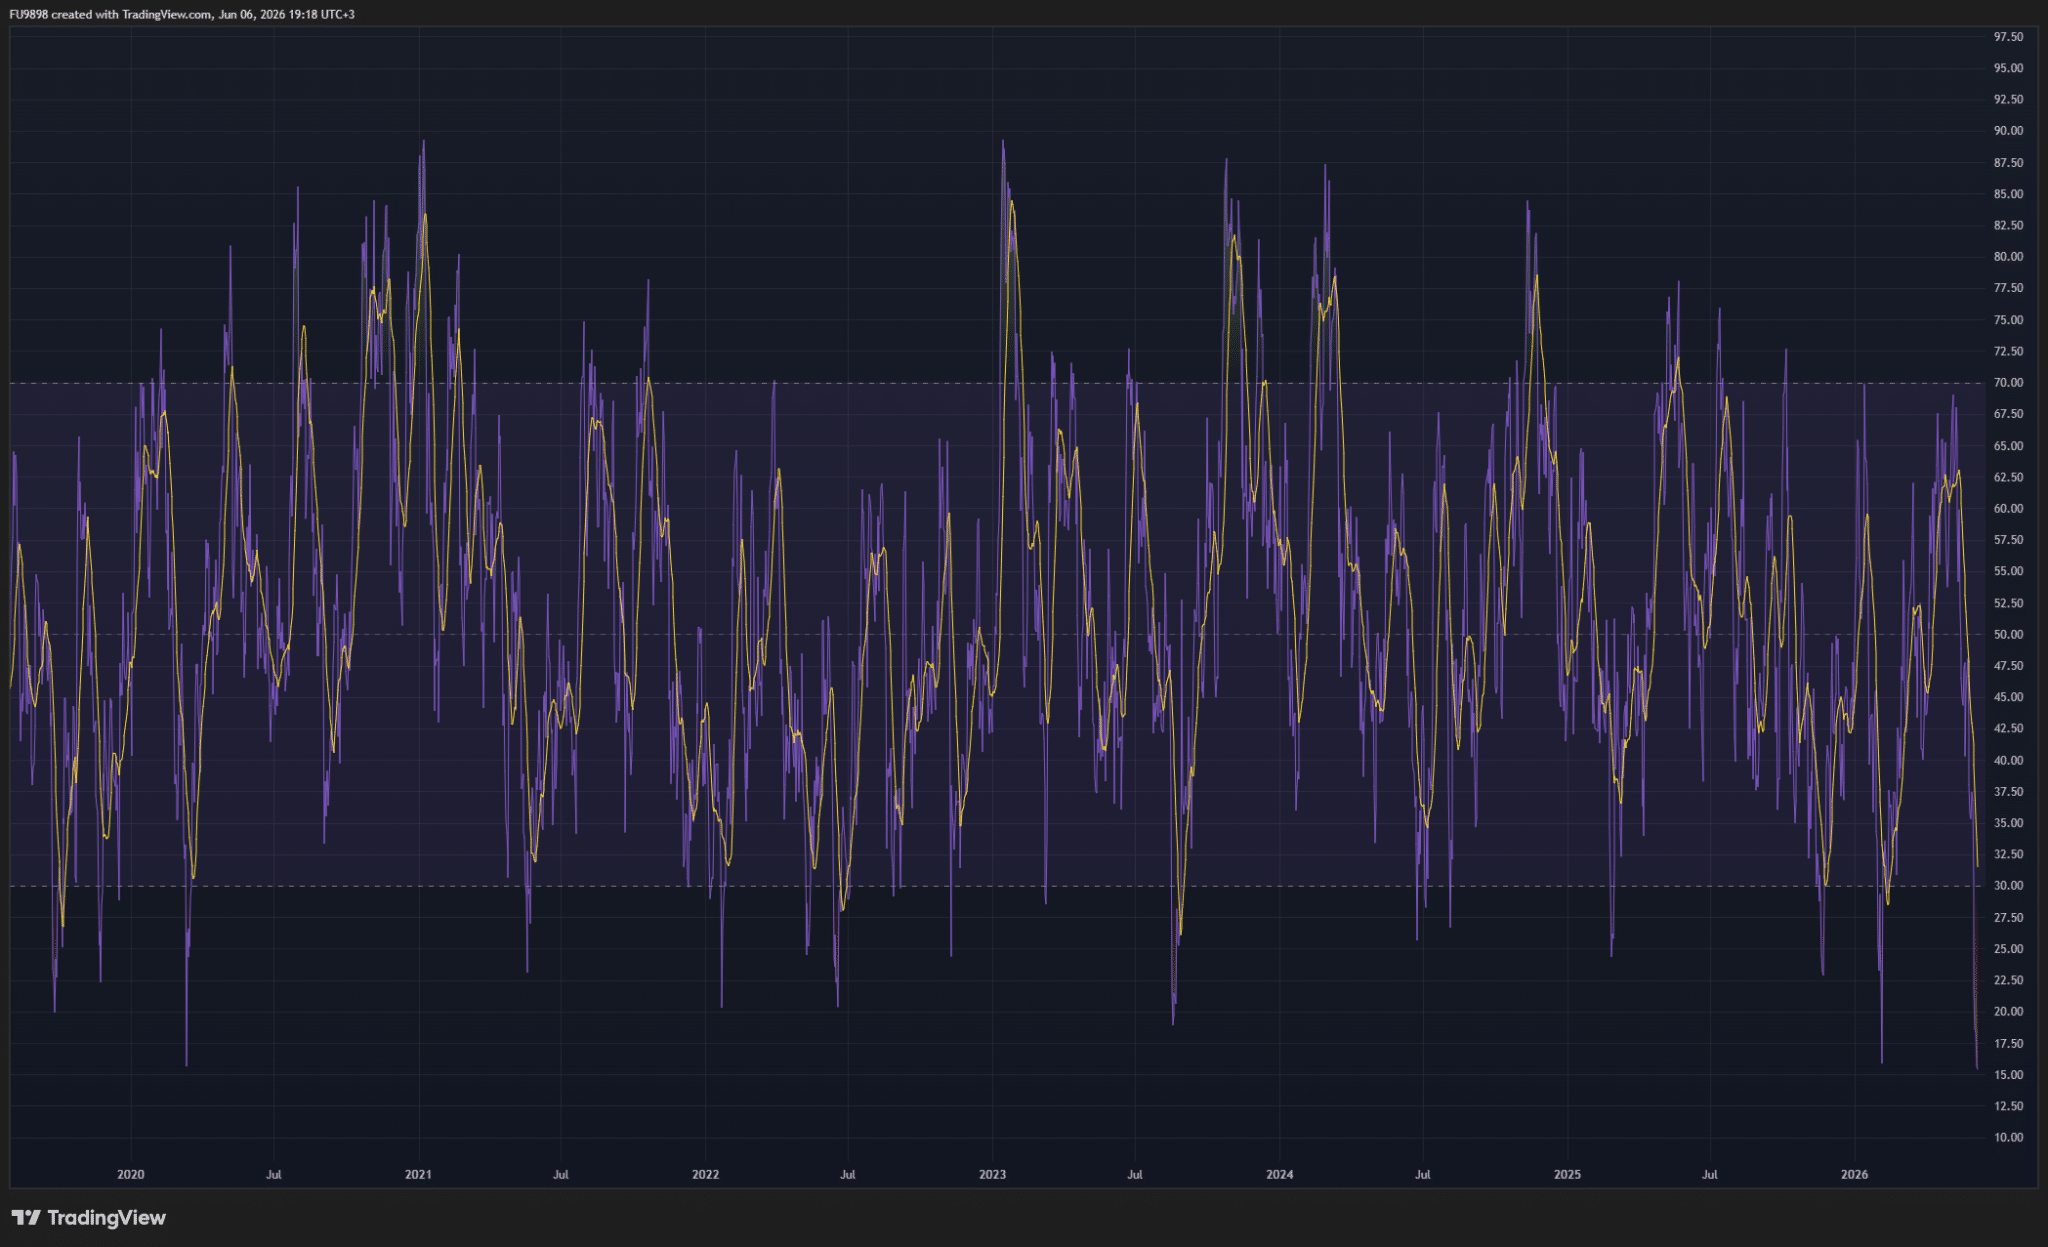
According to the data, Bitcoin’s daily RSI has fallen to approximately 15.5, reaching its lowest level since the sharp sell-off in March 2020. In technical analysis, levels below 30 are considered oversold, indicating that the market is under extremely intense selling pressure.
Analysts noted that similar RSI levels were observed both during the pandemic-induced crash of 2020 and the correction period in February 2026. According to analysts, Bitcoin recovered approximately 50% and 30% respectively after those periods. Currently, the $60,000 level, closely watched by investors, is considered a significant support point. If this level holds, Bitcoin is expected to experience a technical uptrend towards the $70,650 region, where the 20-day exponential moving average (EMA) is located, in the coming weeks. Conversely, a loss of the $60,000 support level risks a price decline to the mid-$50,000 level.
On-chain data also indicates increasing pressure on the market. It is noted that the profit-loss ratios of short-term Bitcoin investors have fallen to historically low levels, suggesting that many investors who recently bought have sold at a loss. Analysts say that market sentiment is increasingly approaching panic levels.
Crypto analyst Scott Melker stated that approximately 5.3 million Bitcoin are currently being held in a loss position by long-term investors. According to Melker, this figure surpasses the levels seen during the FTX exchange crash and represents the highest amount of unrealized losses recorded since the sell-off during the 2020 pandemic.
Melker noted that market sentiment and price movements are largely synchronized, stating that investors were overly optimistic at the peaks seen in May, but had shifted to extreme pessimism as of June 3rd. The analyst added that such shifts in sentiment often indicate that market bottoms may not be far off, but this alone should not be considered a definitive reversal signal.
*This is not investment advice.
Leave a Reply
You must be logged in to post a comment.