Bitcoin’s latest selloff pushed more than 50% of its circulating supply into an unrealized loss, according to K33 Research.
More than 10 million $BTC last moved above current prices after Bitcoin briefly fell below $60,000.
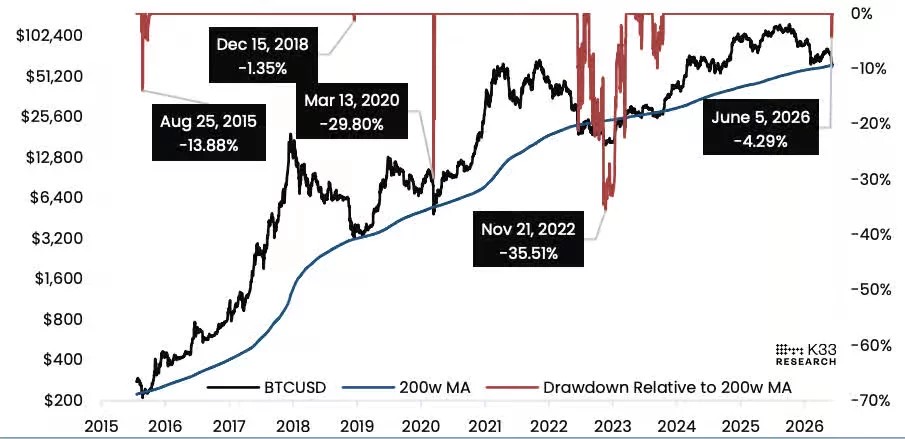
The move also took Bitcoin under its 200-week moving average. K33 views the area near $60,000 as a possible cycle low, but its historical data leaves room for another decline.
Half of Bitcoin supply moves underwater
The share of supply trading at a loss rose from about 30% one month ago to more than 50%. K33 said this level has appeared near every major Bitcoin bear-market bottom.
In 2011, 2018 and 2022, Bitcoin reached its cycle low within 31 days after the first reading above 50%.
“While not a guarantee,” Vetle Lunde said, the setup may favor stronger long-term returns than further downside.
The 2014 cycle was the main exception. Bitcoin took 101 days to bottom and fell another 46% after crossing the 50% mark, showing that the signal can arrive early.
Bitcoin retests its 200-week average
Bitcoin briefly traded 4.29% below its 200-week moving average during the June decline. Earlier bear markets also reached this trend line before forming their final lows.
The current drawdown has reached about 53% over roughly eight months. Previous major declines lasted about one year and erased between 76% and 85%, making the present correction shorter and shallower.
K33 said its base case places the cycle low near $60,000. However, the report recommended patience and an unleveraged approach because past bottoms often included another selloff before recovery.
ETP outflows keep selling pressure elevated
Global Bitcoin ETPs recorded 22,840 $BTC in weekly outflows. Average daily outflows reached 4,108 $BTC between May 7 and June 8, almost ten times Bitcoin’s daily issuance.
Four-week outflows totaled 85,643 $BTC, the largest such period tracked by K33. Global products held about 1.47 million $BTC, their lowest balance since June 2025.
The selloff pushed Bitcoin’s daily RSI to its lowest reading since November 2018. The Fear & Greed Index dropped to 8 before recovering to 10, keeping sentiment in extreme fear.
Lower leverage reduces forced-selling risk
CME Bitcoin futures open interest fell to a 2.5-year low as institutional traders reduced exposure. Futures premiums also narrowed, showing limited demand for leveraged long positions.
Perpetual funding rates and open interest declined from recent highs. K33 said this reduced the immediate risk of another liquidation-driven fall, although weak spot demand and ETP outflows remain active pressures.
As previously reported, capital rotation toward the SpaceX IPO and large technology stocks may also be weighing on Bitcoin. Still, Strategy bought 1,550 $BTC during the decline, offering one counterpoint to the broader risk-off trend.
Leave a Reply
You must be logged in to post a comment.