Bitcoin remains trapped beneath a major resistance cluster after failing to sustain last week’s recovery. The latest price action has shifted back in favor of the bears, with $BTC breaking below its short-term rising structure and once again moving toward the lower boundary of its recent range.
Bitcoin Price Analysis: The Daily Chart
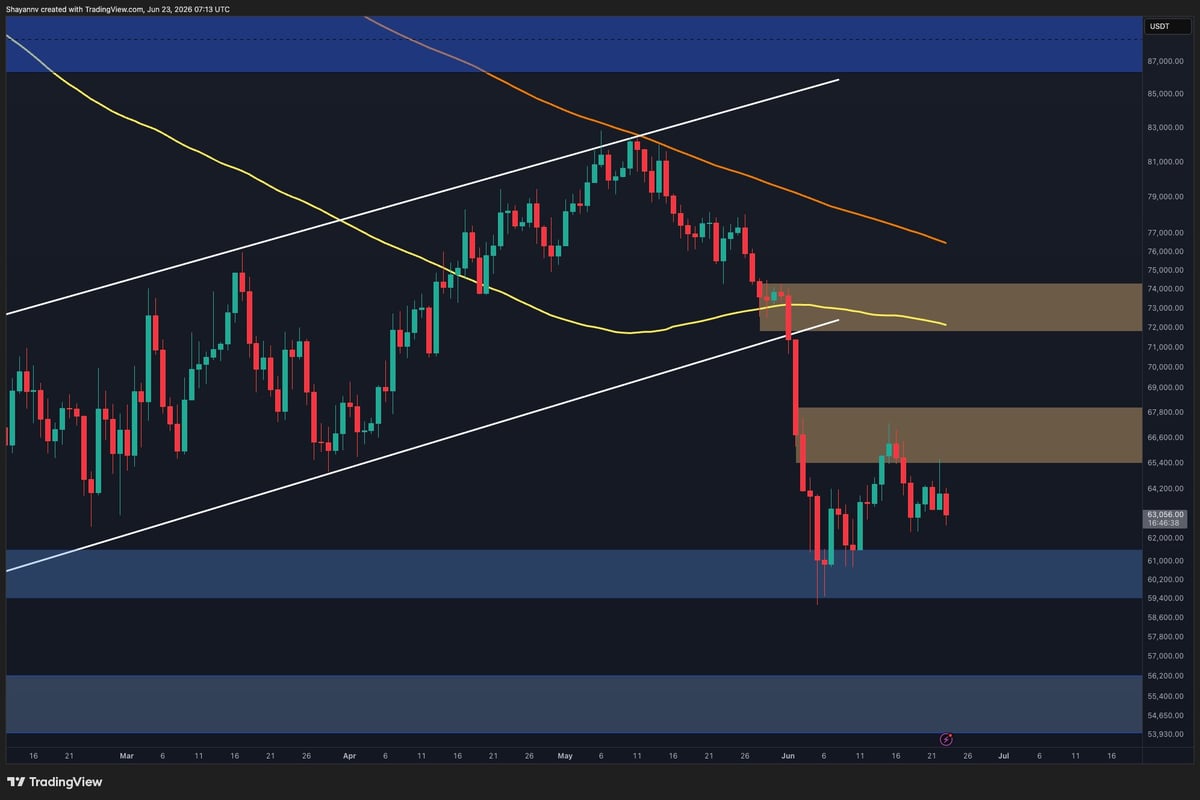
On the daily timeframe, $BTC continues to trade below the first major supply zone between $65K and $68K. After briefly recovering into this area, sellers regained control and pushed the market lower, reinforcing the importance of this resistance region.
The recent rejection also keeps $BTC below the 100-day moving average near $73K and well below the 200-day moving average around $77K, maintaining the broader bearish structure.
The most important support remains the $59K to $61K demand zone, which has repeatedly attracted buyers throughout June. However, each rebound from this area has produced a lower high, suggesting that bullish momentum is gradually fading.
As long as $BTC remains below $68K, the market remains vulnerable to another test of the $60K support region. A decisive breakdown beneath this zone could expose the next major support area around $54K to $56K.
$BTC/USDT 4-Hour Chart
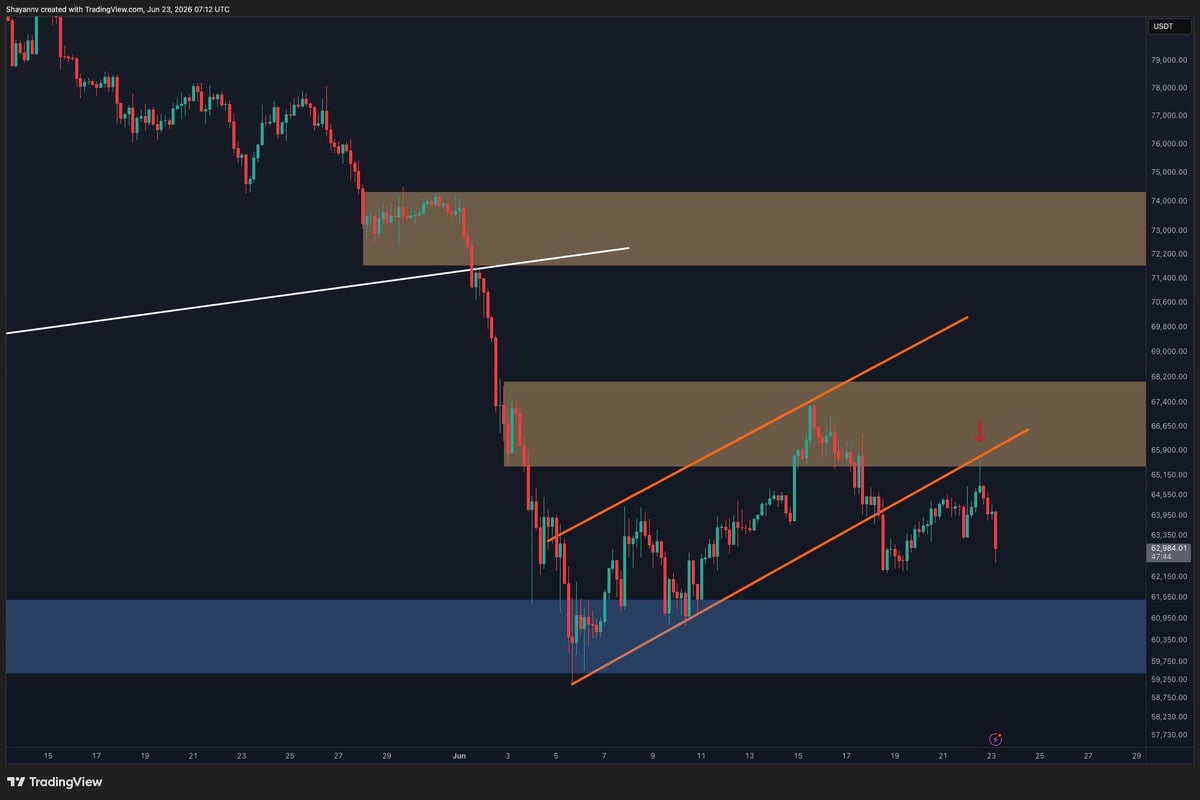
The 4-hour chart paints a more bearish picture in the short term. $BTC recently broke below its ascending recovery channel after another rejection from the $65K to $68K supply zone.
More importantly, the latest recovery attempt failed to produce a new high and instead formed another lower high near $65K before sellers stepped back in. Price is now trading around $63K and moving toward the lower end of the recent range.
The loss of the rising trendline is a notable development because it signals weakening short-term momentum. Unless buyers quickly reclaim the $64K to $65K area, the probability of another move toward the $60K to $61K support zone remains elevated.
The immediate resistance remains the $65K to $68K supply region, while the blue support zone around $60K is the key level that bulls must defend.
Sentiment Analysis
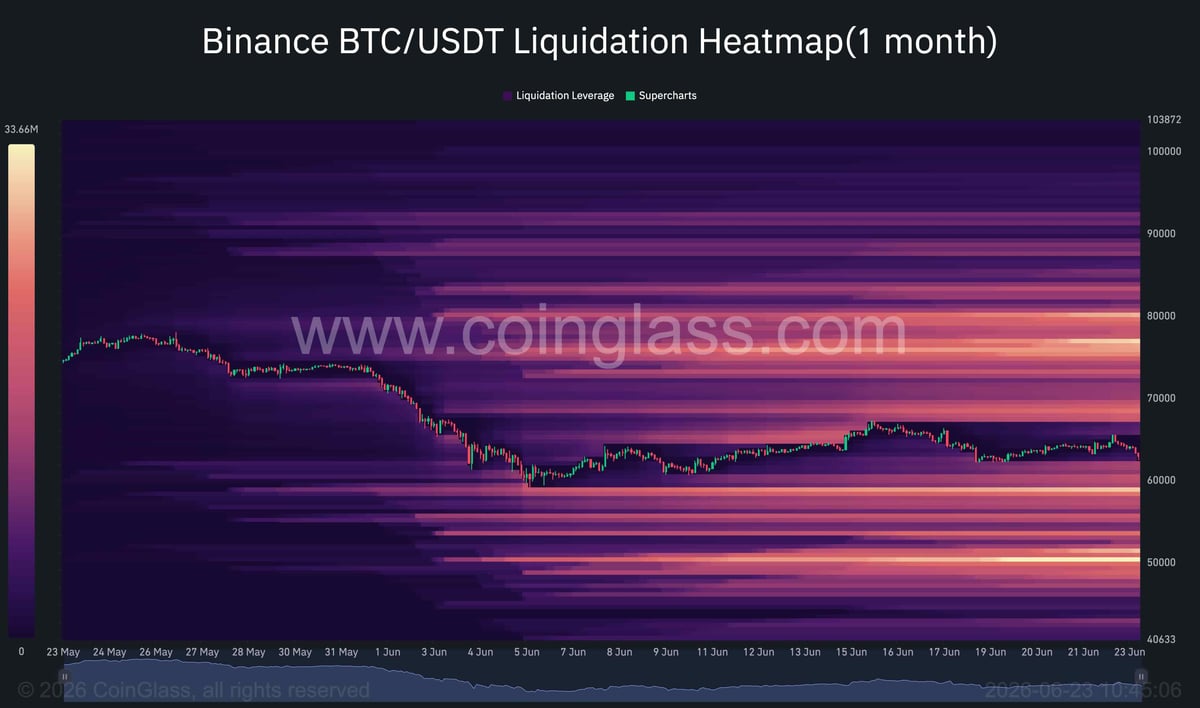
The Binance $BTC liquidation heatmap highlights a substantial concentration of liquidity beneath the current market price, making the downside particularly interesting from a liquidity perspective.
While liquidity exists above the market around $70K, $75K, and higher levels, the most significant and closest cluster is located below the current price action. Large liquidation pools can be seen around the $59K to $60K region, with even larger concentrations extending toward $55K and roughly $50K to $52K.
Since markets often gravitate toward large liquidity concentrations, this setup suggests that downside liquidity remains largely untapped. The repeated failures beneath the $65K to $68K supply zone further increase the risk that $BTC eventually breaks below the $60K support area to target these lower-liquidity pockets.
In other words, while the $60K region continues to act as support, it is also sitting directly above a substantial liquidity vacuum. If sellers manage to force a decisive breakdown, the move could accelerate as the market seeks larger liquidation clusters between $55K and $50K.
For now, the key battle remains at $60K to $61K, but the heatmap suggests that the larger liquidity incentive currently resides below the market rather than above it, leaving the risk skewed toward an eventual downside sweep if support fails.
Leave a Reply
You must be logged in to post a comment.