Bitcoin is testing a critical area near its 2024 halving level, with traders watching whether support holds or another sell-off begins. While Yoddha highlights a long-term buying opportunity near $38,500, Kaz expects Bitcoin to first target $62,300 and potentially fall toward the low $50,000s.
Bitcoin Tests 2024 Halving Level as Trader Eyes Long-Term Dip
Bitcoin is trading near a major long-term level as crypto trader Yoddha argues that investors should “buy the dip and forget” ahead of the 2028 halving.
The two-week $BTC chart shows Bitcoin near $64,865, almost matching the roughly $65,567 level marked for the 2024 halving. According to the chart, this area could determine whether Bitcoin stabilizes or extends its correction.
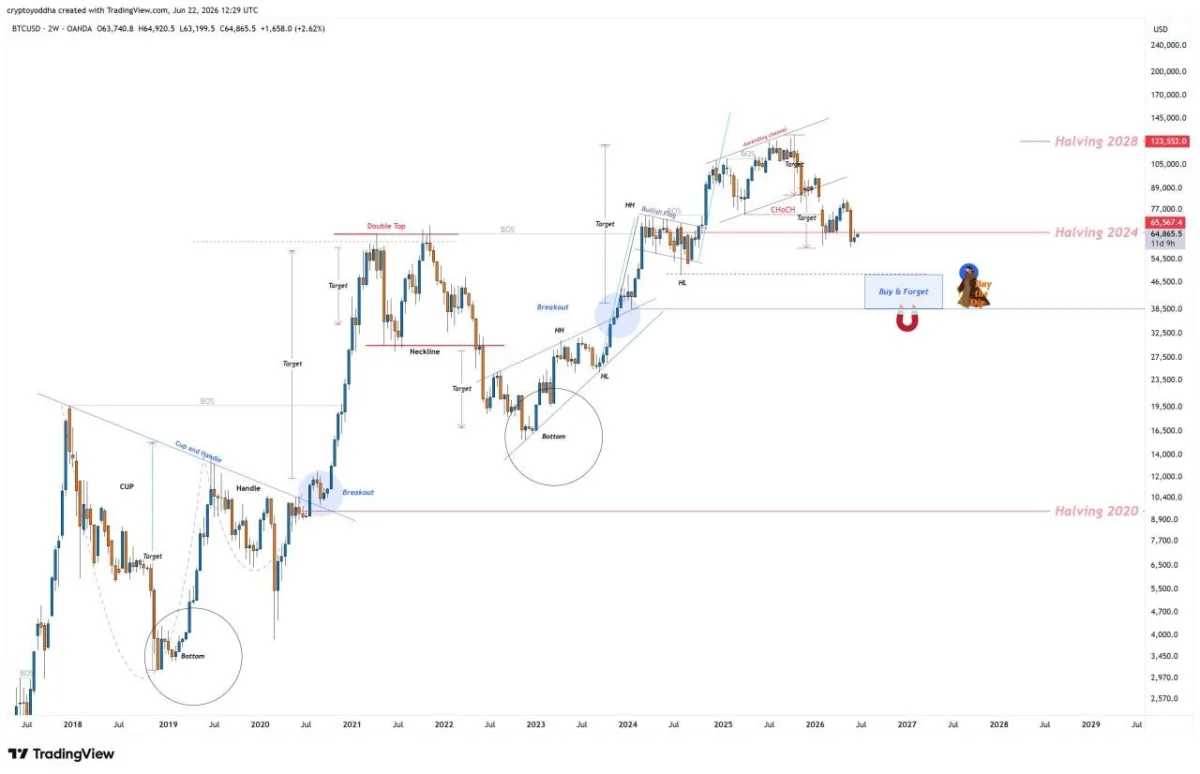
$BTC/USD Two-Week Chart. Source: Yoddha (@CryptoYoddha) on X
Bitcoin previously broke below an ascending channel after reaching the $110,000-$120,000 region. The breakdown produced a bearish change-of-character signal, followed by a decline toward the chart’s projected target near $65,000.
Yoddha compares the current structure with previous Bitcoin cycles. The chart highlights accumulation periods after the 2018 and 2022 market declines, followed by breakouts and strong advances around later halving cycles.
However, the trader’s preferred long-term accumulation area sits considerably lower. A “buy and forget” zone is marked near $38,500, suggesting another major decline could offer a stronger entry opportunity if the current support fails.
The chart also places a possible 2028 halving-cycle reference near $123,552. This does not guarantee that Bitcoin will reach or hold that price. Instead, it reflects the trader’s view that Bitcoin’s four-year cycle could remain influential.
For now, holding the $64,000-$65,500 region would support a potential recovery. A sustained breakdown could shift attention toward lower support levels, with the $38,500 area representing Yoddha’s main long-term dip target.
Bitcoin Retest Could Trigger Drop Toward Low $50,000s
Bitcoin may be approaching another downside move after completing a resistance retest, according to crypto trader Kaz.
The analyst said Bitcoin moved into a key reversal area near $65,500-$66,200, where the chart shows a potential rejection zone. Kaz also pointed to the June 22 reversal pivot as further evidence that the recent rebound may have reached its local top.
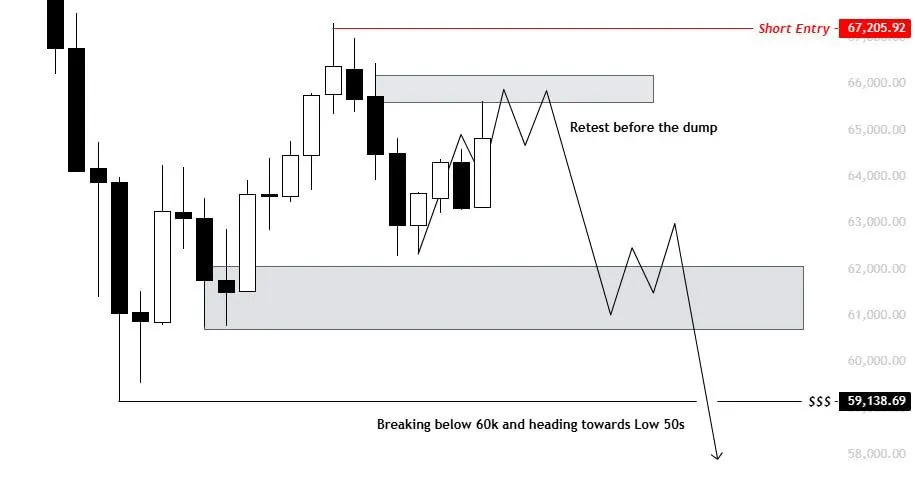
$BTC/USD Short-Trade Setup. Source: Kaz (@XBTkaz) on X
The first downside target sits near $62,300, representing the previous weekly low. Below that, the chart highlights a broader support and liquidity zone between approximately $60,700 and $62,000.
Kaz expects Bitcoin to test the $61,200-$61,800 bounce zone even if the market remains inside its current range for longer. The analyst argues that liquidity below recent lows could attract price before another meaningful recovery begins.
A break below $60,000 would strengthen the bearish setup and could expose the upper $50,000s before a deeper decline toward the low $50,000s. Kaz identified this lower region as the primary target for the broader swing trade.
However, the bearish outlook would weaken if Bitcoin breaks decisively above the resistance zone. Such a move could invalidate the short setup and open the way for a stronger advance.
For now, the trader remains focused on a rejection from resistance, followed by a sweep of the previous weekly low and a possible continuation toward lower support.
Leave a Reply
You must be logged in to post a comment.