Bitcoin is consolidating above $65,000 as buyers struggle to overcome a cluster of technical resistance levels.
The cryptocurrency remains below its 50-day, 100-day, and 200-day exponential moving averages, keeping the short-term price outlook uncertain.
Although institutional demand and improving global liquidity conditions are helping to limit deeper losses, overhead supply continues to prevent a decisive recovery.
Bitcoin’s macroeconomic environment, derivatives positioning, and technical structure currently present a mixed picture: cautious in the short term but more constructive over a longer time horizon.
Bitcoin options market signals institutional optimism
Activity in the derivatives market continues to indicate underlying confidence among sophisticated traders.
Bitcoin options open interest remains above $26 billion, showing that substantial capital is still committed to contracts tied to the cryptocurrency’s future price.
Call options account for approximately 60% of the outstanding positions.
Calls generally benefit when the underlying asset rises, meaning their dominance points to persistent structural optimism among options traders.
However, a high proportion of calls does not guarantee an immediate rally.
Bitcoin may remain range-bound while traders wait for a stronger catalyst or position for price gains over a longer time frame.
Demand from spot Bitcoin exchange-traded funds continues to support the market by providing a consistent source of institutional buying.
ETF inflows have moderated compared with the stronger surges recorded earlier in the market cycle.
The slower pace means institutional demand is helping to stabilize Bitcoin but has not been sufficient to absorb all the supply available at higher prices.
The $65,500–$67,000 region remains a major area of overhead resistance.
Holders who previously bought around these levels may be using price recoveries to reduce their positions, limiting Bitcoin’s upside.
A meaningful acceleration in ETF inflows could help absorb this supply and improve the chances of a sustained breakout.
The wider macroeconomic environment remains moderately favorable for Bitcoin.
Expectations that the Federal Reserve will avoid further interest-rate increases have reduced some of the pressure on risk assets.
Meanwhile, rate-cutting cycles among other global central banks are improving liquidity conditions.
Lower interest rates typically reduce the appeal of yield-bearing defensive assets and can encourage investors to increase their exposure to equities, cryptocurrencies, and other higher-risk investments.
These liquidity tailwinds have helped protect Bitcoin from steeper declines, even as its technical structure remains weak.
However, renewed inflation concerns or more restrictive monetary policy could undermine that support.
Short-term Bitcoin outlook remains cautious
The $BTC/USD 4-hour chart remains bullish and efficient despite the consolidating performance over the past few days.
The cryptocurrency remains capped below its 50-day, 100-day, and 200-day EMAs, indicating that sellers continue to control several important dynamic resistance levels.
For the outlook to turn decisively bullish, Bitcoin needs to record a convincing daily close above the $66,250–$67,000 resistance zone.
Such a move could confirm a breakout from the current consolidation range and encourage sidelined buyers to return. Until that happens, the risk of further sideways trading or another rejection remains elevated.
If Bitcoin fails to overcome this region, traders may continue selling rallies while waiting for demand to strengthen at lower levels.
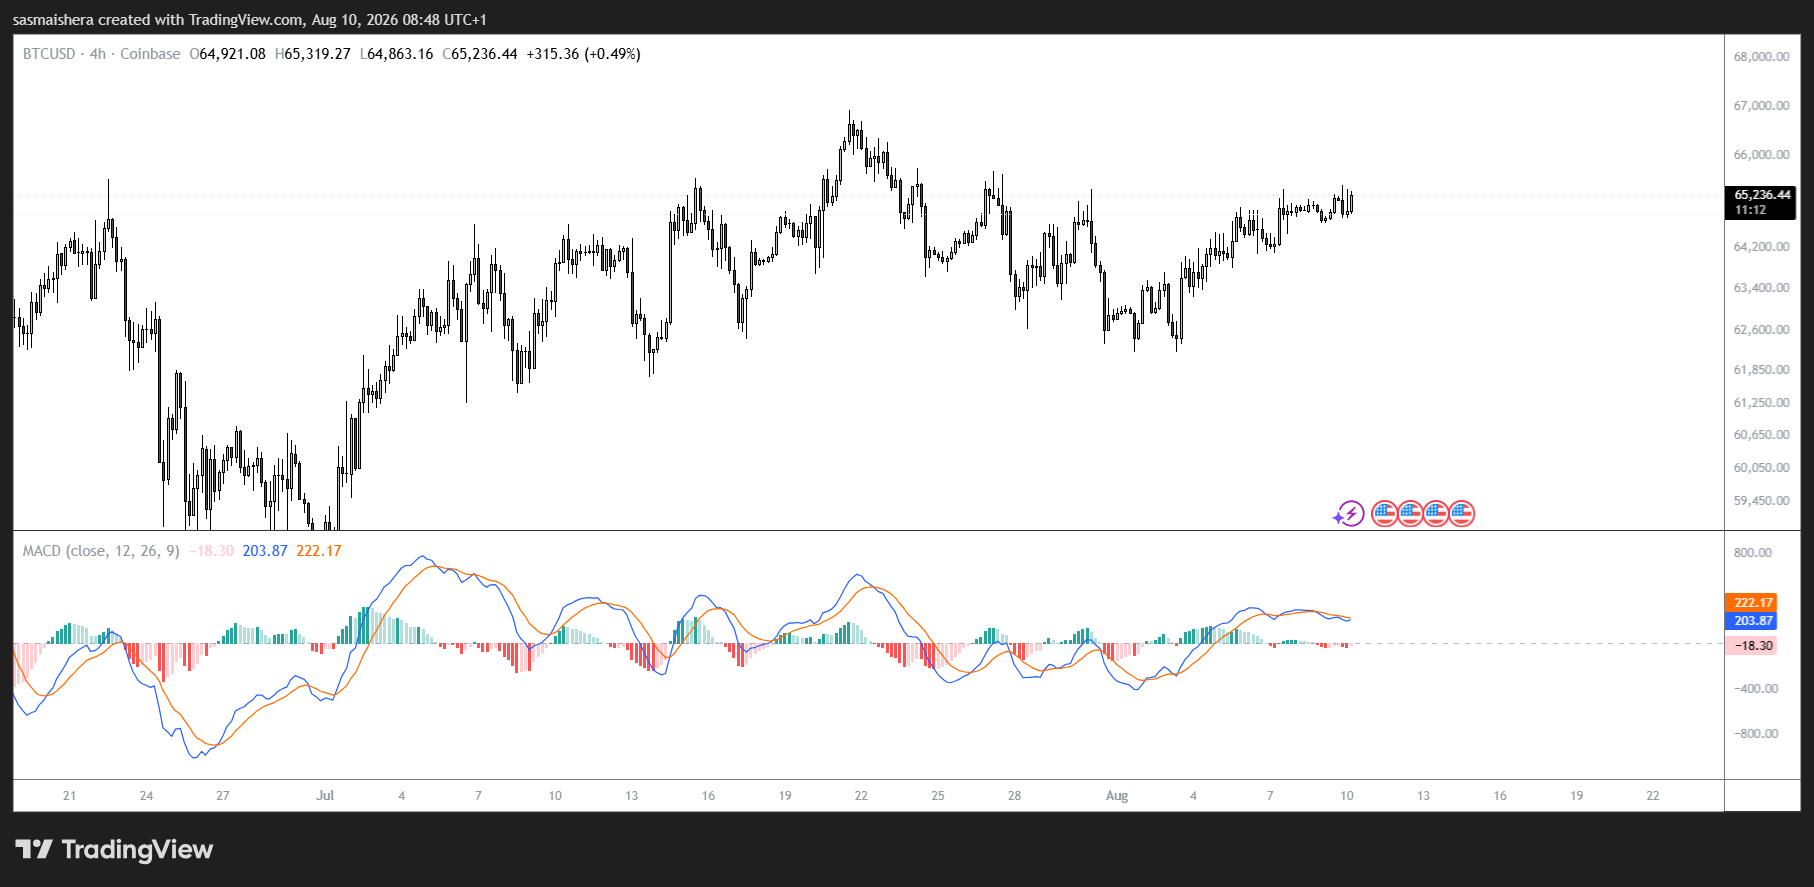
Technical indicators suggest that the bulls are still in control.
The MACD lines are within the positive region, while the RSI of 62 shows that Bitcoin is bullish but has yet to enter the overbought zone, leaving room for further rally.
However, if the bearish trend returns, Bitcoin will likely retest the $63,717 support level in the near term.
Failure to defend this support level could see $BTC extend its decline towards the August 1st low of $62,101.