Bitcoin’s ($BTC) daily Relative Strength Index (RSI) has climbed above 80, marking its most overbought reading since November 2024.
The move follows a ferocious multi-day rally that lifted the cryptocurrency from the low $60,000s to nearly $80,000, with the latest RSI reading signaling that a short-term pullback may be possible.
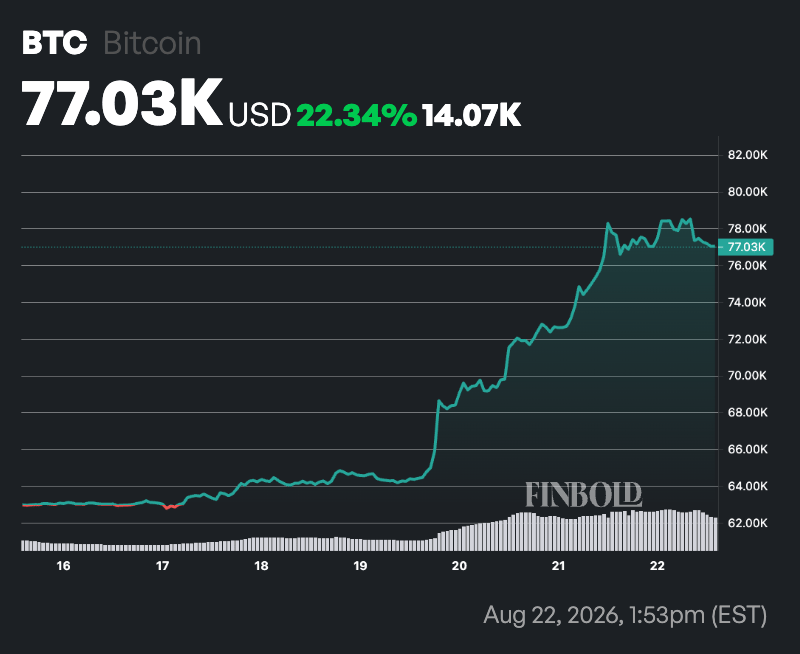
The rapid ascent began on August 19; Bitcoin gained more than 7% to approximately $69,300. The following session added another 5%, pushing the asset above $73,000. On August 21, $BTC surged roughly 7% more, briefly testing levels not seen in months.
In less than a week, Bitcoin advanced more than 20%, reclaiming key moving averages (MA), including the 200-day level near $69,000. By press time, $BTC was trading at $77,037, up almost 2% in the last 24 hours and 22% over the past week.
$BTC’s in danger of retreating
Following the rally, Bitcoin’s 14-day RSI stood at 85.99, firmly in overbought territory. Values above 70 are generally considered overbought, while readings above 80 have historically preceded periods of consolidation or correction as buying momentum becomes stretched.
The primary catalyst behind the advance was a cascading short squeeze. Billions of dollars in leveraged short positions were liquidated across major exchanges over several sessions, with estimates placing total short liquidations between $3 billion and $4 billion within days.
Forced buying from those liquidations amplified upward pressure in an environment of relatively limited supply, producing the sharp price surge.
Additional support came from U.S. Treasury announcements of increased longer-dated bond buybacks, which helped ease yields and boost risk assets. Renewed optimism around regulatory clarity and modest net inflows into spot Bitcoin ETFs also contributed to the rally.
Despite the strong rebound, Bitcoin remains well below its 52-week high near $126,000 and far from previous cycle peaks.
Key support levels now sit in the mid-$70,000 range and around the reclaimed 200-day moving average near $69,000.
A failure to hold recent gains could expose $BTC to a pullback toward the $65,000 to $70,000 region that defined the previous trading range.
Bitcoin’s key price levels to watch
Meanwhile, analysis by Ted Pillows in an X post on August 22 suggests Bitcoin is at a critical technical juncture after reclaiming and holding above its weekly Bull Market Support Band, a key indicator used to distinguish bull and bear market conditions.
According to Pillows, Bitcoin must secure a weekly close above the support band, currently around $69,500 and formed by the 20-week SMA and 21-week EMA, to confirm further upside.
$BTC is holding above its weekly bull market support band.
A weekly close above this zone is needed for more upside in Bitcoin. pic.twitter.com/lv3VEEqxun
— Ted (@TedPillows) August 22, 2026
$BTC is also trading comfortably above its 200-week moving average near $64,300, indicating that bulls remain in control of the long-term trend.
The next key hurdle lies between $78,000 and $80,000, a major resistance zone. A breakout above this range could pave the way for further gains.
However, losing the Bull Market Support Band would weaken the bullish outlook and raise the risk of a pullback toward the $64,000 region.
Featured image via Shutterstock