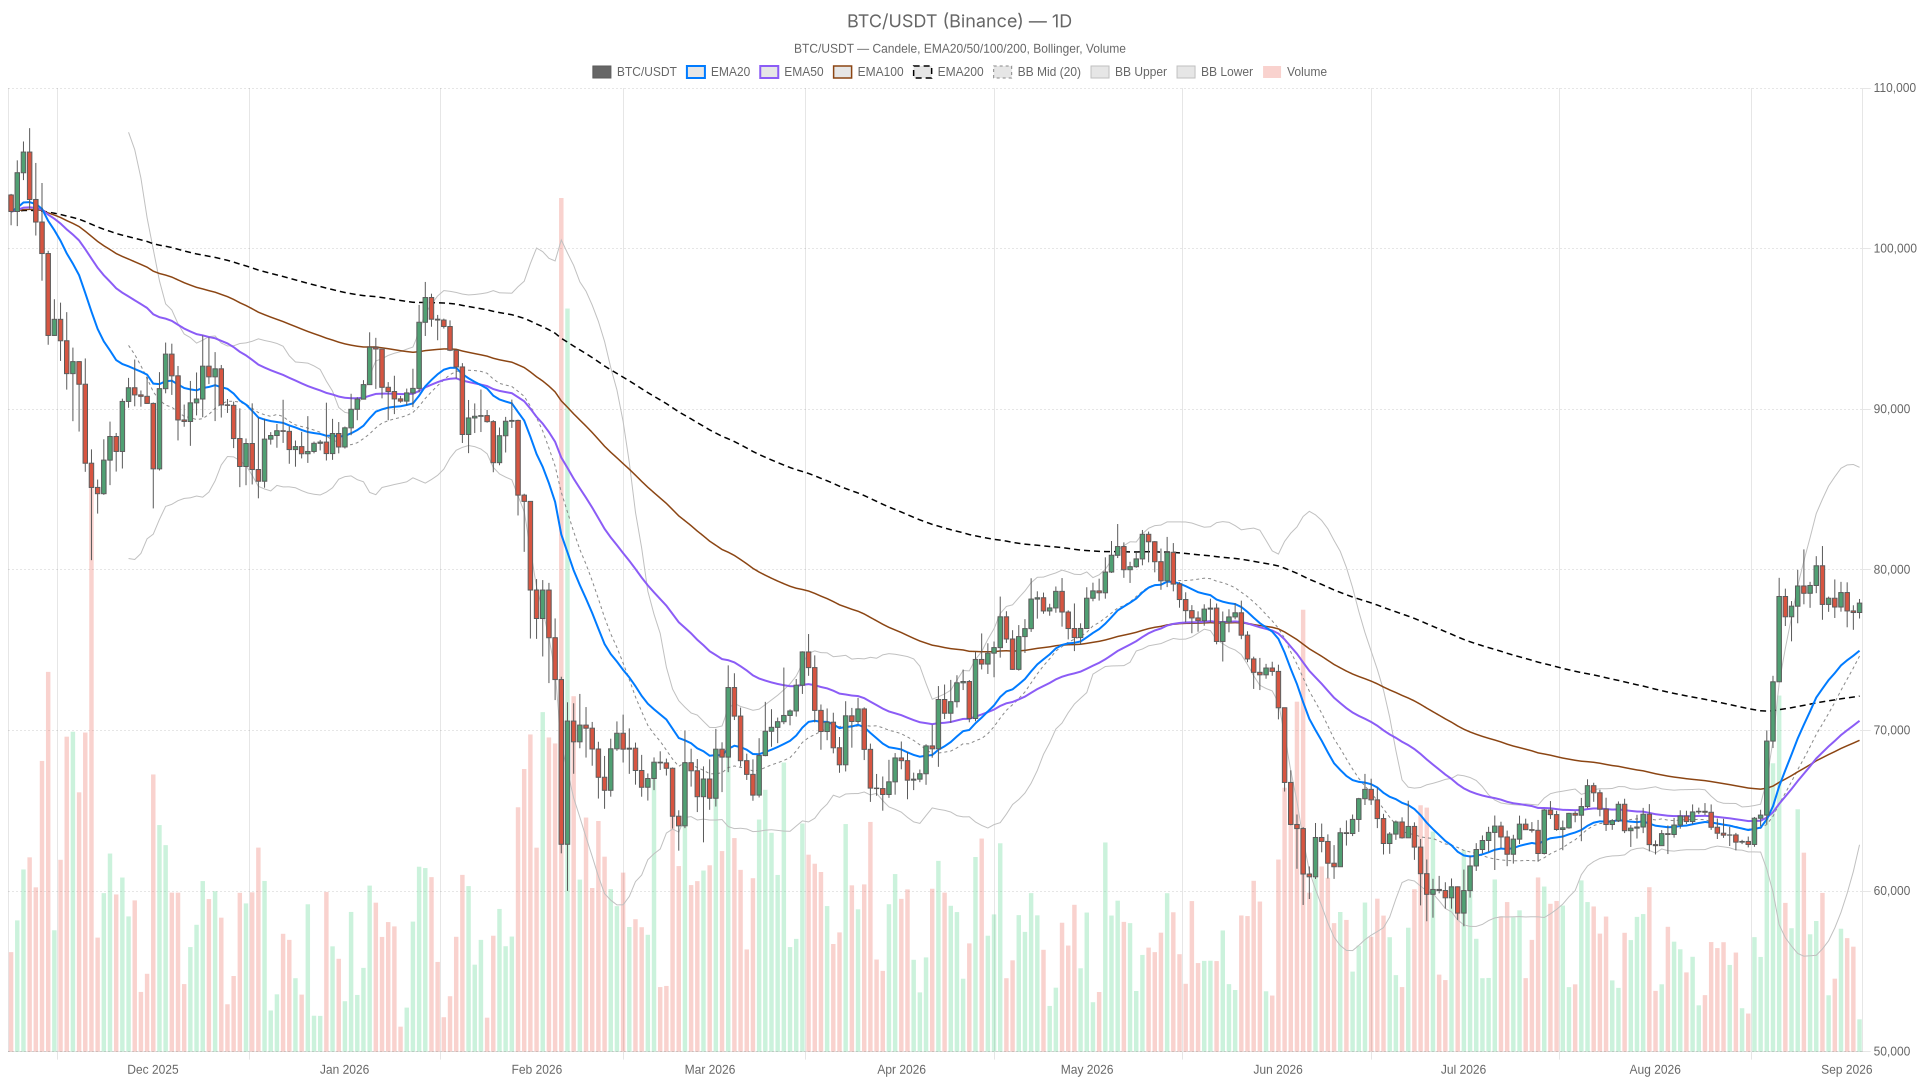
As of September 3, 2026, the Bitcoin price today sits at $77,927.99, holding just above a cluster of daily moving averages that have defined the uptrend for months. $BTC consolidates right at its daily pivot after a late-August run above $80,000.
Key takeaways
- Bitcoin trades at $77,927.99, holding above its EMA20, EMA50, and EMA200 in a textbook bullish structure.
- The daily MACD histogram has turned negative at -195.86, signaling that upside momentum is cooling despite intact price structure.
- Bitcoin dominance climbed to 59.58% as total crypto market cap slipped 2.70% to $2.63 trillion, per CoinGecko data — a defensive rotation into $BTC.
- Strategy, led by Michael Saylor, resumed Bitcoin purchases after a two-month pause, deploying $370 million.
- The Fear & Greed Index stands at 65 (Greed), pointing to complacent positioning during the momentum stall.
Daily structure sets the macro bias
The daily chart confirms a bullish macro structure: $BTC trades above its EMA20 (74,964.01), EMA50 (70,598.29), and EMA200 (72,134.21). With price above all three and shorter EMAs stacked above longer ones, the medium-term trend remains unbroken, and pullbacks continue to attract buyers rather than sellers.
RSI14 on the daily sits at 66.69 — firmly bullish without being overbought — suggesting room remains before the trend becomes stretched. However, tension emerges from the daily MACD: the MACD line (3,219.13) has fallen below its signal line (3,414.98), producing a negative histogram of -195.86. Momentum is decelerating even while price structure holds, a divergence that warns against leaning too heavily into the bullish narrative.
Moreover, the daily Bollinger Bands (mid 74,630.09, upper 86,381.19, lower 62,878.99) remain wide, with price above the midline and room toward the upper band. Daily ATR14 of 2,666.03 confirms elevated volatility. The daily pivot at 77,693.30, with resistance at R1 78,418.60 and support at S1 77,202.69, frames the immediate battleground: $BTC trades directly on its pivot, and whichever side it settles on will likely dictate the next several sessions.
Short-term timeframes show tension
The 1H chart tells a more cautious story. Price (77,928) sits above its EMA20 (77,527.90) and EMA50 (77,584.86), but remains below the EMA200 (78,085.71), which acts as an overhead cap. RSI14 at 59.14 and a positive MACD histogram of 78.41 point to modest bullish pressure building beneath that ceiling.
On the 15-minute chart, meanwhile, the regime flips bullish with EMA20 (77,750), EMA50 (77,568.06), and EMA200 (77,554.10) stacked in proper order. RSI14 at 56.80 and a barely positive MACD histogram of 5.15 confirm the move is real but low-conviction — consolidation rather than breakout. Notably, the 15-minute pivot, R1, and S1 all sit essentially at current price (77,927.99–77,928), meaning the market is parked at equilibrium awaiting a catalyst.
This multi-timeframe tension captures the current indecision: the daily trend remains intact but momentum fades, the hourly stays neutral and capped, and the 15-minute is technically bullish but unconvincing. No timeframe screams in a single direction, which is precisely why $BTC feels stuck despite holding above its longer-term averages.
Bullish vs bearish scenarios
The bullish case requires a daily close above R1 (78,418.60), confirmed by the 1H price clearing and holding above its EMA200 (78,085.71). That would signal the pivot fight was won by buyers and open the door toward the upper Bollinger region near 86,381.19. Renewed institutional demand lends credibility to this path: Strategy restarted Bitcoin buying after a two-month pause, deploying $370 million, according to Bloomberg, shortly after $BTC moved back above $80,000 on strong U.S. ETF inflows. Invalidation for bears would be a sustained hold above the daily EMA20 without losing S1 (77,202.69) intraday.
The bearish case, on the other hand, hinges on the momentum divergence visible on the daily MACD and the broader market’s -2.70% 24-hour move in total capitalization. If $BTC loses the daily pivot (77,693.30) and slips below the H1 EMA20/EMA50 cluster near 77,528–77,585, the next real magnet becomes the daily EMA20 near 74,964, with the EMA50 at 70,598 as a deeper fallback. Sentiment warrants attention: the Fear & Greed Index reads 65 (Greed) despite the market cap pullback, and complacent positioning during a momentum stall often precedes sharper corrections. Invalidation for the bullish structure would be a daily close below the EMA20.
Positioning and risk
The Bitcoin price today reflects a market caught between a still-intact bullish structure and cooling momentum, with dominance data suggesting capital is consolidating into $BTC rather than fleeing crypto. This setup is meaningfully different from a straightforward breakout or breakdown and argues for patience over conviction at current levels. The daily ATR of roughly 2,666 points serves as a reminder that moves in either direction can materialize quickly once the pivot zone resolves.
Institutional flows — the Saylor purchase, the ETF-driven push through $80,000 — represent genuine tailwinds, but they do not override the daily MACD’s more cautious message. Treat this as a market in transition rather than one that has already committed to a direction, and let the pivot levels above and below current price dictate the narrative over the coming sessions.
FAQ
What is Bitcoin trading at right now?
As of September 3, 2026, Bitcoin trades at $77,927.99, holding near its daily pivot of 77,693.30 and above all major daily moving averages.
Is Bitcoin’s bullish structure still intact?
Yes. $BTC remains above its EMA20 (74,964), EMA50 (70,598), and EMA200 (72,134), with the shorter EMAs stacked above the longer ones — a textbook bullish configuration despite cooling momentum on the daily MACD.
What are the key levels to watch for Bitcoin?
The immediate battleground is the daily pivot at 77,693.30. Resistance sits at R1 78,418.60, while support lies at S1 77,202.69. A daily close above R1 would open the path toward the upper Bollinger Band near 86,381, while losing the pivot could target the EMA20 near 74,964.
Disclaimer: This article is for informational purposes only and does not constitute financial advice, an investment recommendation, or a solicitation to buy or sell any financial instrument or cryptocurrency. The analysis provided is not indicative of future results. Investing in crypto assets and financial markets carries a high risk of capital loss. Always do your own research (DYOR) and consult a qualified financial advisor before making any decision.
Article produced with the assistance of artificial intelligence and reviewed by the editorial team.