
The S&P 500 Index rose to 7,650 points on Monday as top technology stocks continued rising. It has jumped by 1.95% from its lowest level last week. Still, Morgan Stanley believes that US stocks are set for a big decline.
Morgan Stanley predicts a dip in US stocks
American stocks may be at risk of a strong sell-off in the coming weeks as energy prices continue rising and the volatility in the bond market escalates.
In a statement, Mike Wilson, the chief analyst at Morgan Stanley, warned that the S&P 500 Index could drop by about 7% as these risks continue rising. He said:
“Should the correction in valuation take a turn for the worse in the near term due to a further tightening of financial conditions and/or materially higher energy prices, we think the S&P 500 could trade as low as 7,100 before the bull market resumes into year end.”
The S&P 500 Index has moved sideways in the past few weeks and reacted mildly to some major events that happened in the market recently. For example, the index remained narrow after the Federal Reserve delivered its interest rate decision last week. It hiked interest rates by 0.25% and hinted that it may hike rates again.
Most importantly, the S&P 500 Index reacted mildly to the earnings season, in which most companies reported strong financial results. The average earnings in the second quarter were over 50%, with technology and energy companies driving the surge. Some of the top companies in terms of earnings growth were over 50% and analysts believe that this growth will continue in the near term.
S&P 500 ETF inflows rising as valuation drops
On the positive side, American companies are doing relatively well this year, and this trend may continue in the coming months. According to FactSet, the average earnings growth for the third quarter is 28%. This means that, if its recent history continues, chances are that the earnings growth will be over 40%.
The other potential catalyst is that American investors continue pumping cash to the stock market. A good example of this is the Vanguard S&P 500 ETF (VOO), which has brought in over $140 billion in assets this year. Its assets under management (AUM) have jumped to over $1.07 trillion, and if the trend continues, they will hit $1.5 trillion in the next few years.
Further, there are signs that the S&P 500 Index has become a bargain. It trades with a forward price-to-earnings ratio of 19.1, lower than the five-year average of 19.3.
S&P 500 Index technical analysis
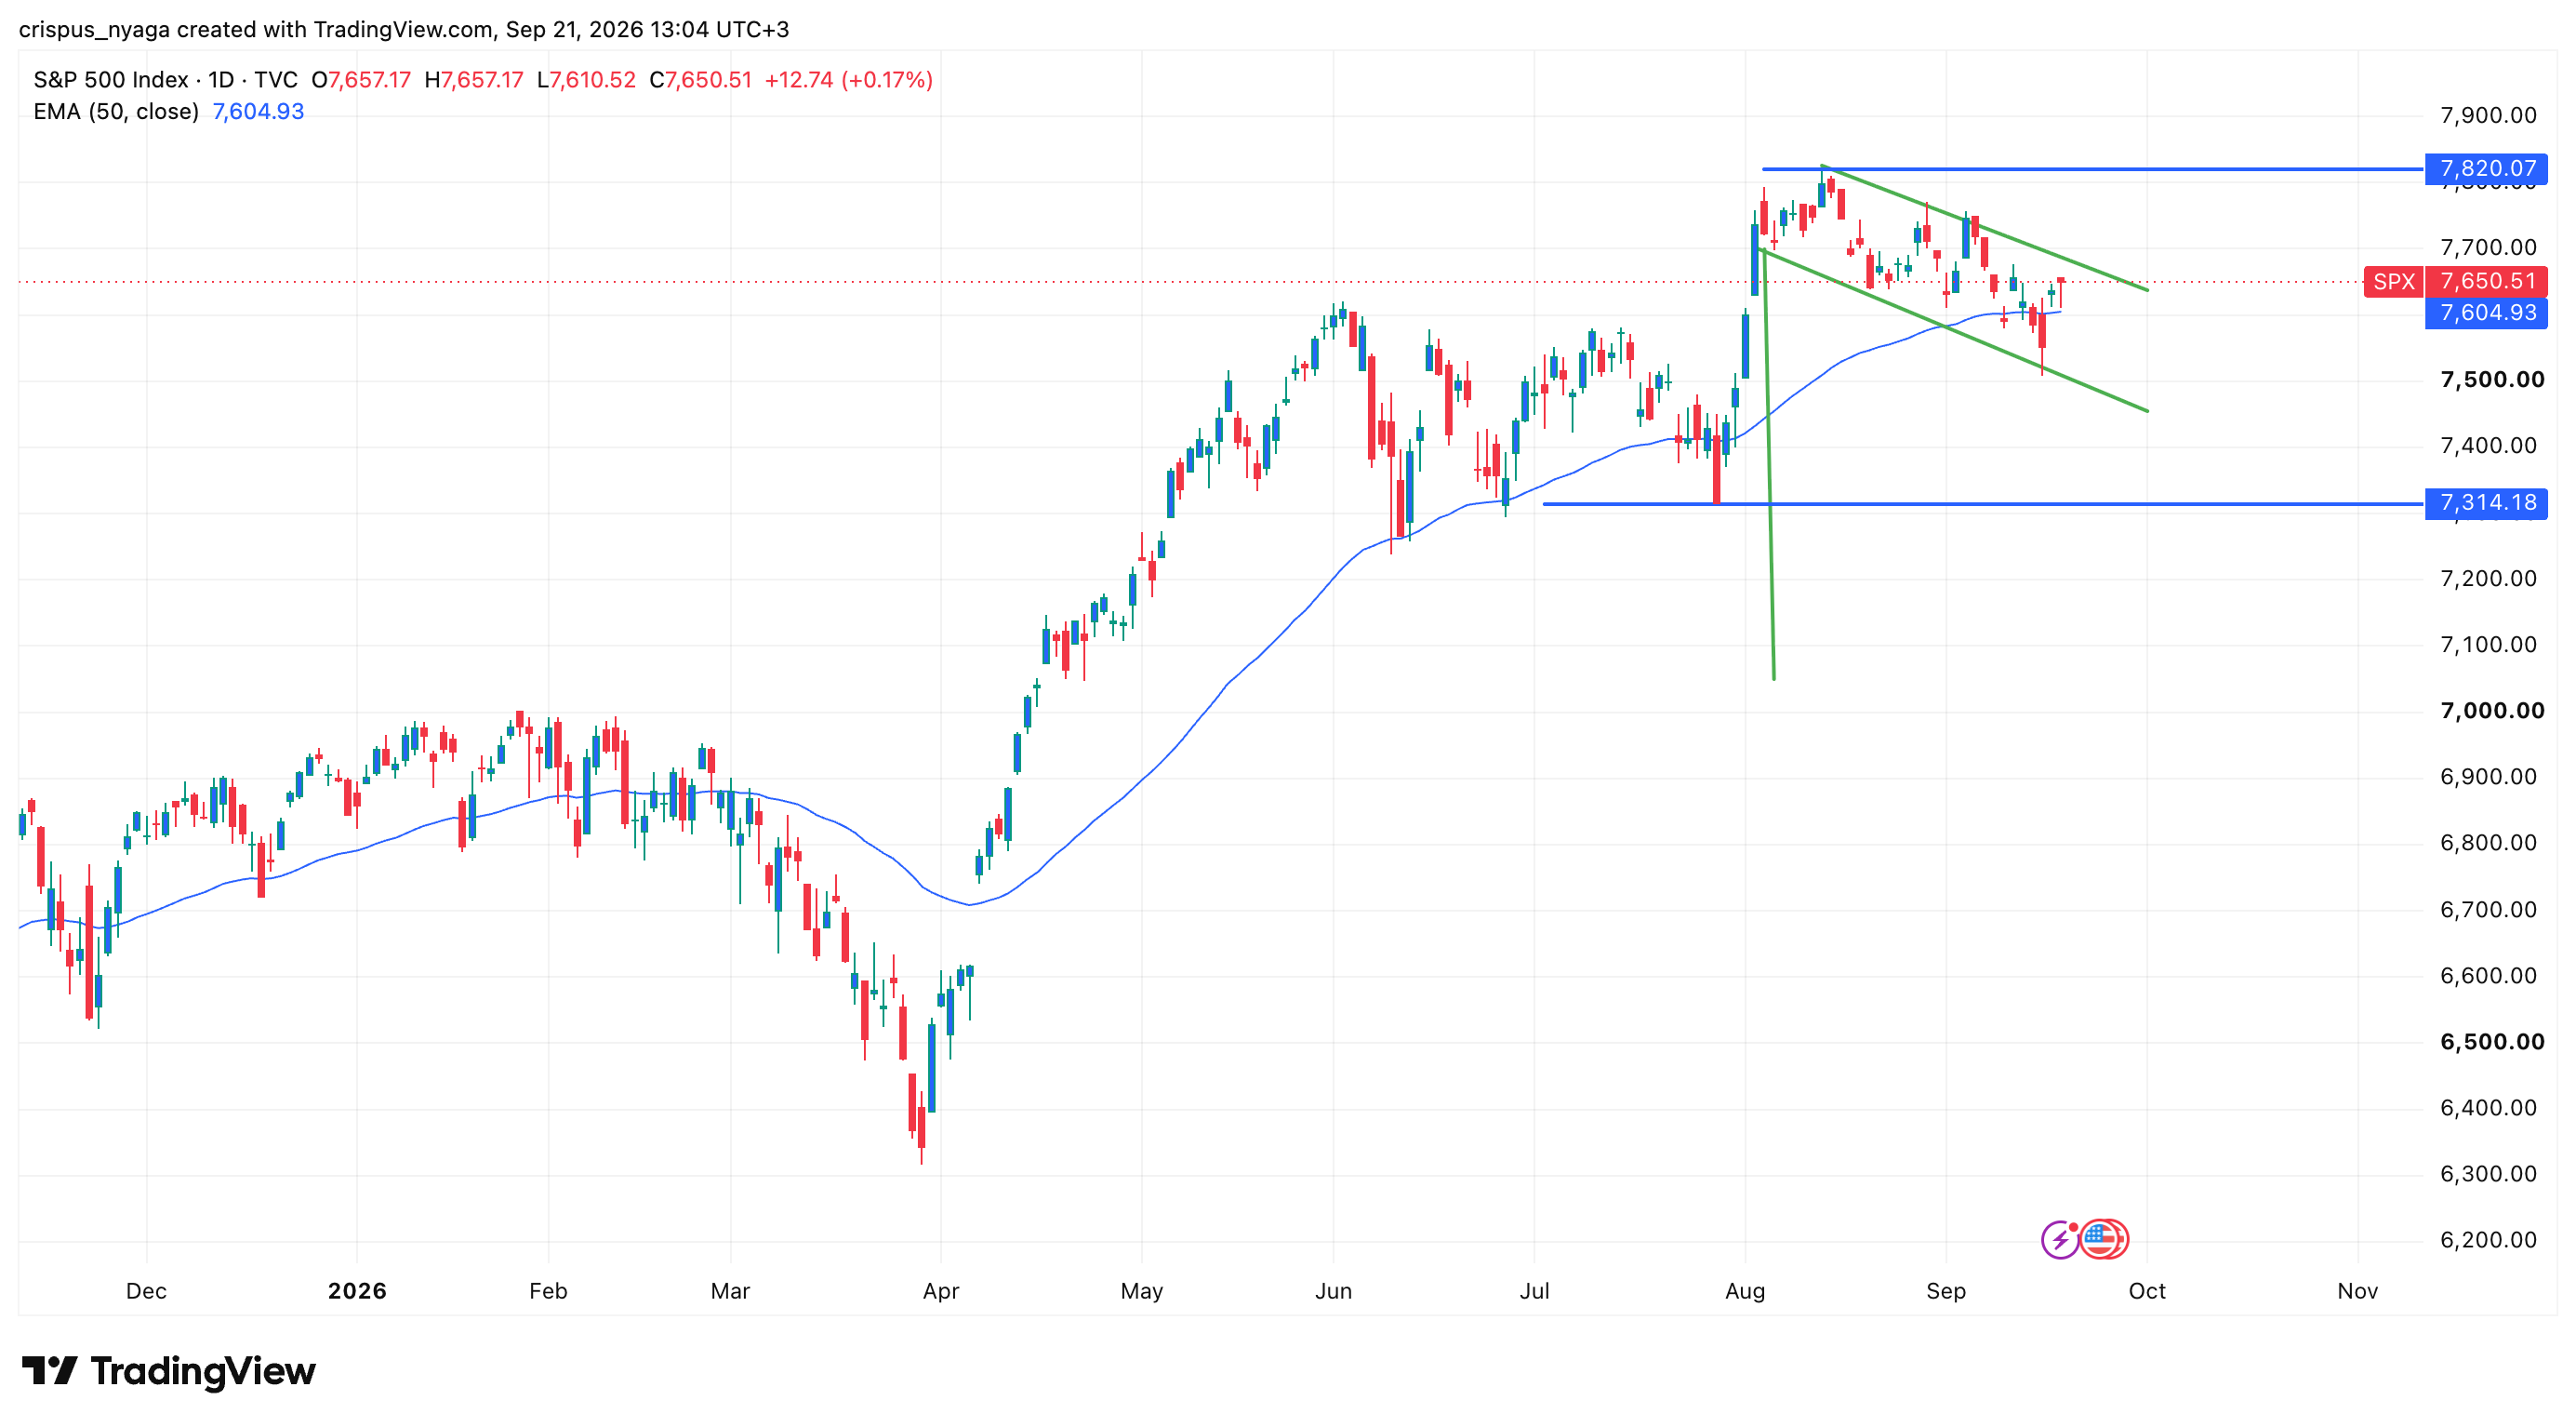
SPX Index chart | Source: TradingView
Technicals suggest that the S&P 500 Index is on the cusp of a bullish breakout. That’s because it has slowly formed a bullish flag pattern, which is made up of a vertical line and a descending channel. It has now moved slightly below this channel’s upper side.
The index also sits above the 50-day and 100-day Exponential Moving Averages (EMA), which is a bullish sign. Therefore, the most likely scenario is where it continues rising, potentially to the all-time high of 7,820.
Leave a Reply
You must be logged in to post a comment.