How the $74,500 Calculation Works
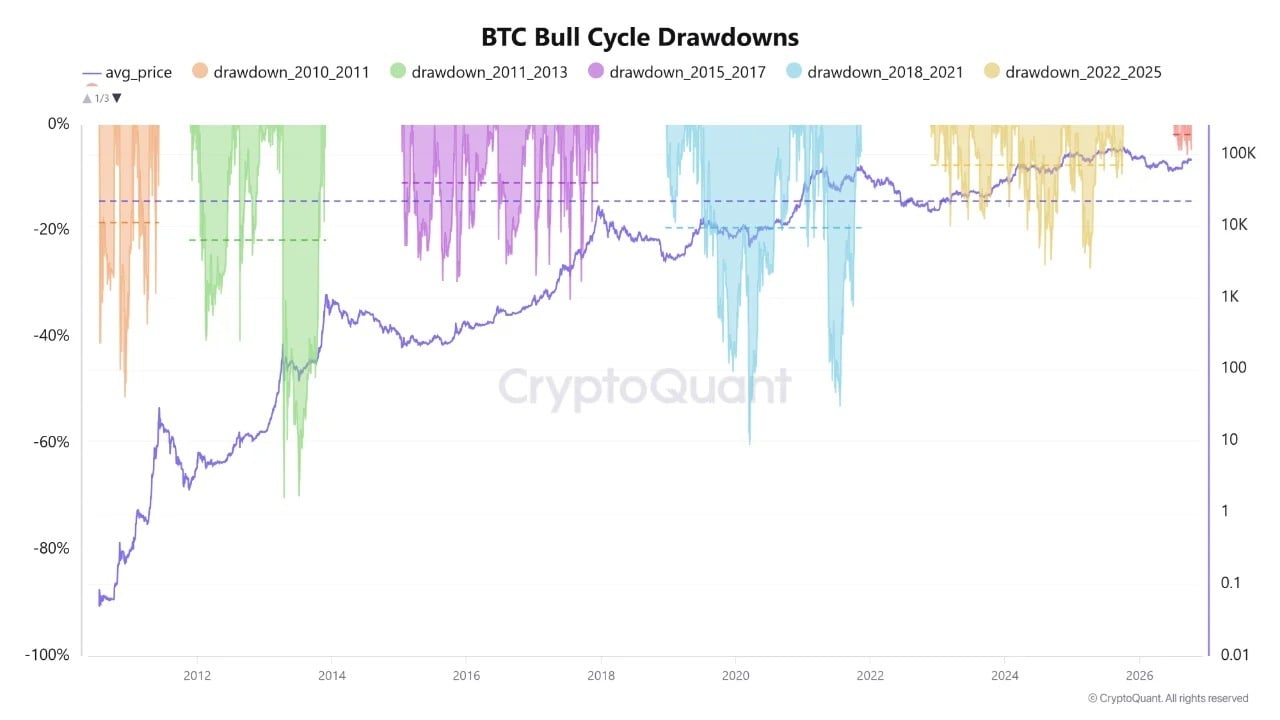
The latest pullback has brought a $74,500 downside reference into focus, according to an analysis published by Cryptoquant on Oct. 9. Contributor MAC_D used the cryptocurrency analytics platform’s historical bull market corrections to compare declines during bull markets, periods of broadly rising prices.
The analysis measured a decline from $87,027 on Oct. 5 to $80,404 on Oct. 9, a $6,623 reduction, or approximately 7.61%. A drawdown measures how far a price falls from an earlier peak. That retreat nearly matched the previous expansion’s average setback.
The analyst wrote:

Know when your
coins moveAlerts, real-time prices, and market news — all in one app

4.8 based on 40K reviews in the App Store and Google Play


“Applying that historical average to the recent high gives a price level of approximately $74,500, which could serve as a reference point in the event of further downside.”
The calculation applies a reported 14.39% historical benchmark, an earlier average used for comparison, to the Oct. 5 high.
Earlier Advances Show How Corrections Differ
Average setbacks were 18.41% in 2010-2011, 21.71% in 2011-2013, 10.93% in 2015-2017, 19.39% in 2018-2021, and 7.58% in 2022-2025. The analysis puts the overall average across the five cycles at 14.39%.
The latest cycle’s milder setbacks accompany other observations of moderating fluctuations over time. Fidelity Digital Assets, Fidelity’s digital asset business, documented moderating volatility in May 2024. The term describes the size of movements in either direction. MAC_D’s analysis also noted that individual events produced significantly deeper corrections.
The broader recovery had received support from Cryptoquant’s Bull Score, which rose from 30 to 80 in August. That gauge combines 10 indicators of demand, holder profitability, network activity, and liquidity, the availability of capital to support trading.
Buying Levels Accompany Signs of Recovery
September’s recovery also generated a signal based on acquisition costs, estimates of what investors paid for their coins. Cryptoquant contributor Darkfost identified a fifth historical bull market signal on Sept. 24. Newer holders’ cost crossed above that of longer-term holders whose coins had moved within seven years. He acknowledged a margin for error.
Cryptoquant founder and CEO Ki Young Ju suggested on Sept. 22 that growing institutional ownership, meaning holdings by organizations such as investment funds, could produce smaller cycle gains and shallower losses.
The asset’s investment risks include substantial fluctuations even during periods of rising adoption. The analyst proposed purchases over time around $80,000 and larger commitments between $74,000 and $75,000. The lower buying range corresponds to approximately 13.82% to 14.97% below the Oct. 5 high.
Leave a Reply
You must be logged in to post a comment.