Bitcoin Price Stalls at $83,266 as Bulls Confront $84,254 Resistance
Bitcoin’s price stands at $83,266 on Tuesday morning, Oct. 13, 2026, caught in an increasingly uncomfortable standoff between encouraging longer-term technical indicators and stubborn short-term resistance. Although the cryptocurrency has recovered from recent lows near $80,000, buyers have struggled to establish a convincing foothold above $83,800.
This situation has left the market vulnerable to another retreat despite a moving average configuration that remains predominantly bullish. With 24-hour trading volume reaching $32.77 billion and prices fluctuating between $81,018 and $84,074, the next decisive move could determine whether the rebound gains traction or another defensive battle unfolds.
Bitcoin’s Hourly Chart Shows Buyers Losing Their Grip
The one-hour bitcoin chart reveals an increasingly fragile recovery following a rebound from $80,948, with subsequent attempts to reclaim the $83,800 to $84,000 region encountering persistent resistance. Recent candles suggest momentum has moderated, while lower highs indicate buyers are struggling to maintain control of the immediate trend.

Know when your
coins moveAlerts, real-time prices, and market news — all in one app

4.8 based on 40K reviews in the App Store and Google Play


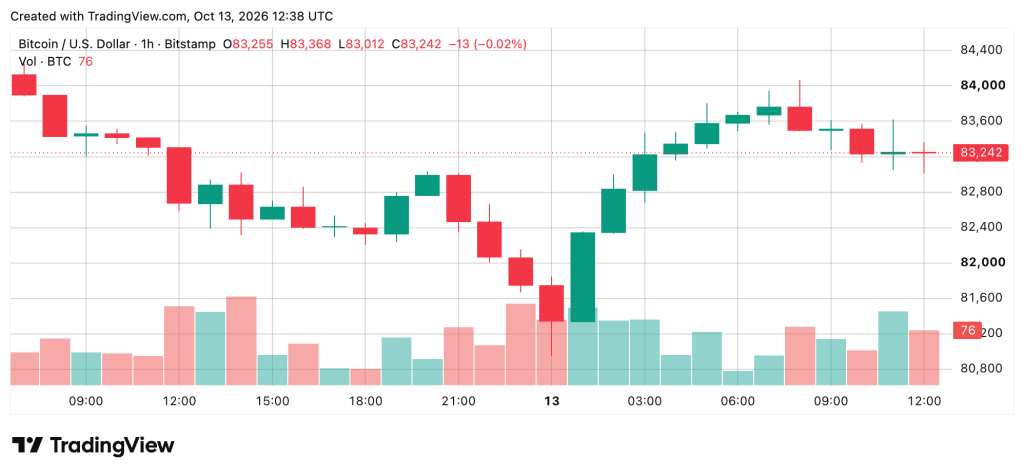
Initial support rests between $82,800 and $83,000, with another defensive level emerging near $82,400. A sustained advance beyond $83,500 would improve the short-term outlook and reopen a potential challenge of $84,000. Conversely, a decisive breakdown beneath $82,800 would weaken the recovery structure and increase the probability of another confrontation with $82,000.
Four-Hour Chart Reveals a Recovery Running Into Trouble
Bitcoin’s four-hour chart presents a similarly complicated picture, with the cryptocurrency recovering from $80,308 before encountering substantial resistance between $83,800 and $84,254. Repeated attempts to establish acceptance above $83,500 have produced limited follow-through, suggesting that buyers remain hesitant to commit additional capital at elevated prices.
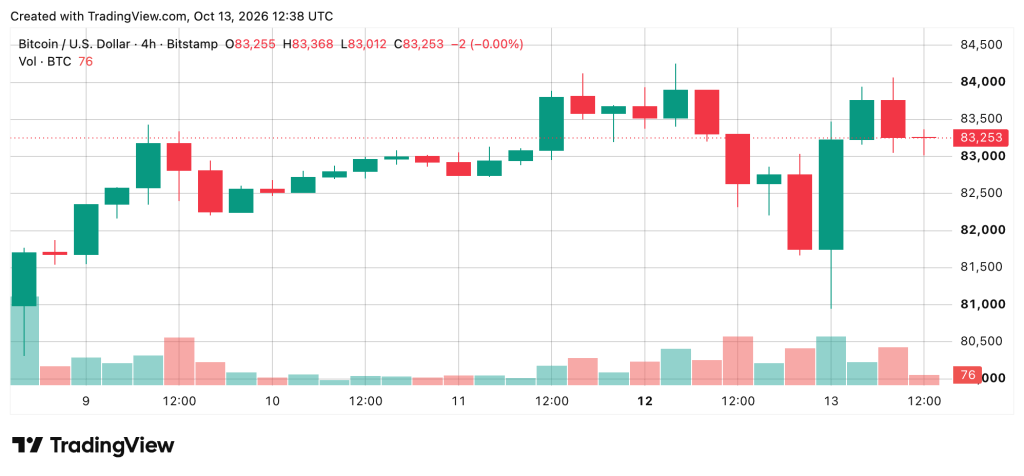
Nevertheless, the recovery structure remains technically viable while bitcoin holds above $82,500, a level that separates ordinary consolidation from a potentially more consequential retreat. Should that support deteriorate, $81,700 becomes the next important threshold, followed by the $80,300 region. A convincing four-hour close above $84,254 would instead strengthen the case for a renewed advance toward $85,000.
Daily Chart Keeps the Bigger Recovery Alive
The daily chart offers a broader perspective, showing bitcoin consolidating after an earlier advance from $74,913 to $87,374. Although recent price action has produced lower highs, buyers continue defending the $81,000 to $82,000 support region, preventing the correction from developing into a more decisive breakdown.
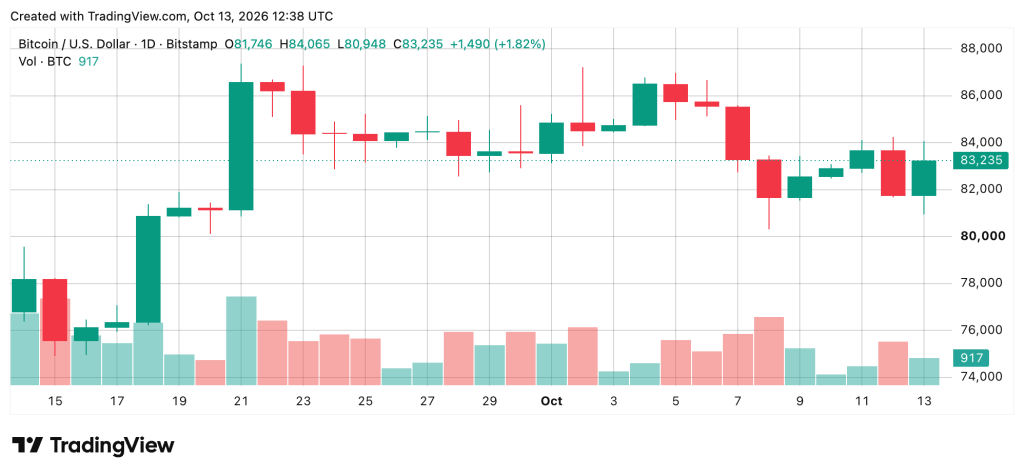
Tuesday’s positive candle provides some encouragement, although bitcoin remains beneath the formidable $84,000 to $85,000 resistance corridor. A daily close above $85,000 would strengthen the bullish interpretation and suggest that the recovery is regaining momentum. However, losing $81,000 on a sustained basis would challenge the broader structure and place the $80,308 support region under renewed scrutiny.
Oscillators Signal Indecision While Moving Averages Favor Bulls
Bitcoin’s oscillators, via the 24-hour chart, offer little evidence of a decisive directional advantage. The relative strength index (RSI) stands at 52.30, reflecting broadly balanced momentum, while the Stochastic oscillator registers 37.39, and the commodity channel index (CCI) oscillator reads minus 94.04.
The average directional index (ADX) stands at 29.47 with a bearish signal, while moving average convergence divergence (MACD) registers 638.14, also carrying a bearish designation. Meanwhile, the Awesome oscillator (AO) remains positive at 668.36, and momentum registers minus 1,516.41 despite its bullish classification. Altogether, seven oscillators are neutral, two bullish, and two bearish, reinforcing the impression of a market searching for direction.
Moving Averages Remain Mostly Bullish
Moving averages (MAs) tell a more constructive story, although immediate resistance remains troublesome. Bitcoin trades above its 20-period exponential moving average (EMA) at $83,125.18 and its 50-period simple moving average (SMA) at $81,107.45, while the 100-period and 200-period averages also favor bulls.
However, the 10-period simple moving average (SMA) at $83,693.18 and the 20-period simple moving average (SMA) at $83,952.43 remain overhead obstacles. Of the 15 moving average indicators, 10 are bullish, four bearish, and one neutral.
Bull Verdict:
Bitcoin’s recovery retains a constructive foundation, supported by 10 bullish moving averages and continued price stability above $82,500. A decisive breakout above $84,254, accompanied by stronger trading volume, would reinforce bullish momentum and open the door to $85,000 and potentially $85,500. Sustained daily closes above $85,000 would further strengthen the case for a broader recovery.
Bear Verdict:
Bitcoin’s inability to reclaim $83,800 to $84,254 leaves the recovery vulnerable to renewed selling pressure. A decisive breakdown below $82,500 would weaken the immediate structure, potentially exposing $81,700 and the psychologically important $81,000 threshold. Should sellers force prices beneath $80,308, the broader recovery would face a more serious technical setback, shifting momentum decisively in favor of the bears.
Leave a Reply
You must be logged in to post a comment.