Bitcoin Price Stalls at $81,500 as Short-Term Bears Challenge Longer-Term Bulls
Bitcoin’s price is caught in a rather peculiar technical standoff, trading around $81,500 on Saturday, Oct. 17, 2026, as bearish short-term moving averages clash with a considerably healthier longer-term structure.
With a market capitalization of approximately $1.639 trillion, $13.967 billion in daily trading volume and a 24-hour range stretching from $81,108.80 to $81,733.01, the market has settled into a narrow holding pattern, leaving traders to determine whether the latest consolidation represents the beginnings of a recovery or merely a temporary reprieve before another test of support.
Hourly Chart Shows Buyers Defending Their Ground
The one-hour chart presents a tentative recovery from the recent $80,714 low, with successive higher lows suggesting buyers are attempting to establish a foothold around $81,000. However, declining trading volume complicates that encouraging development, indicating the recovery has yet to attract convincing participation.

Know when your
coins moveAlerts, real-time prices, and market news — all in one app

Point your phone camera to install

4.8 based on 40K reviews in the App Store and Google Play


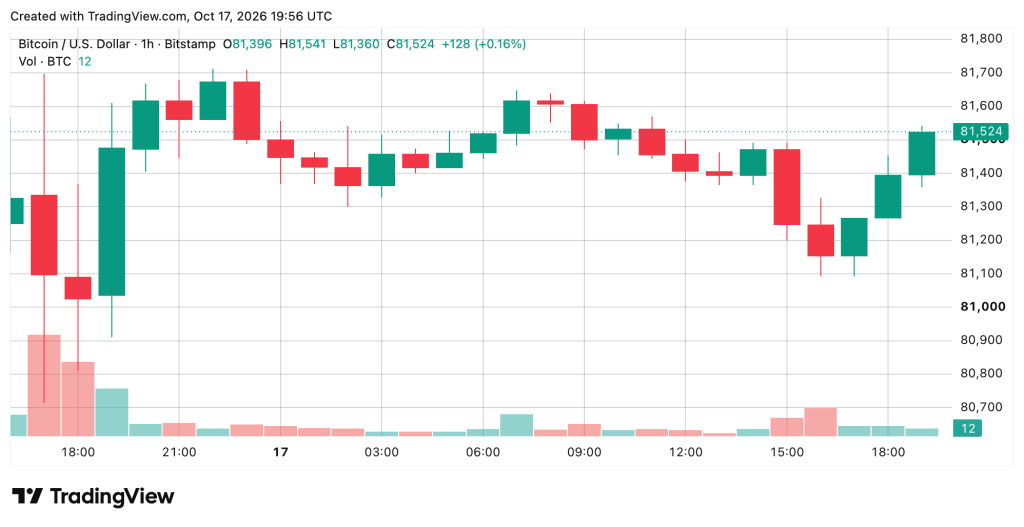
Immediate resistance rests between $81,700 and $82,000, where a sustained advance would bring $82,500 into consideration. Conversely, a retreat through $81,000 would expose the earlier hourly low and challenge the modest progress buyers have achieved.
Four-Hour Structure Keeps Sellers in Contention
The four-hour chart offers a less forgiving perspective, showing bitcoin consolidating after its rejection near $84,254. Price action remains concentrated around $81,000 to $81,700, with neither side demonstrating sufficient conviction to establish a decisive directional move. Order-book observations place additional bids toward $80,000, while overhead offers extend into higher price territory.
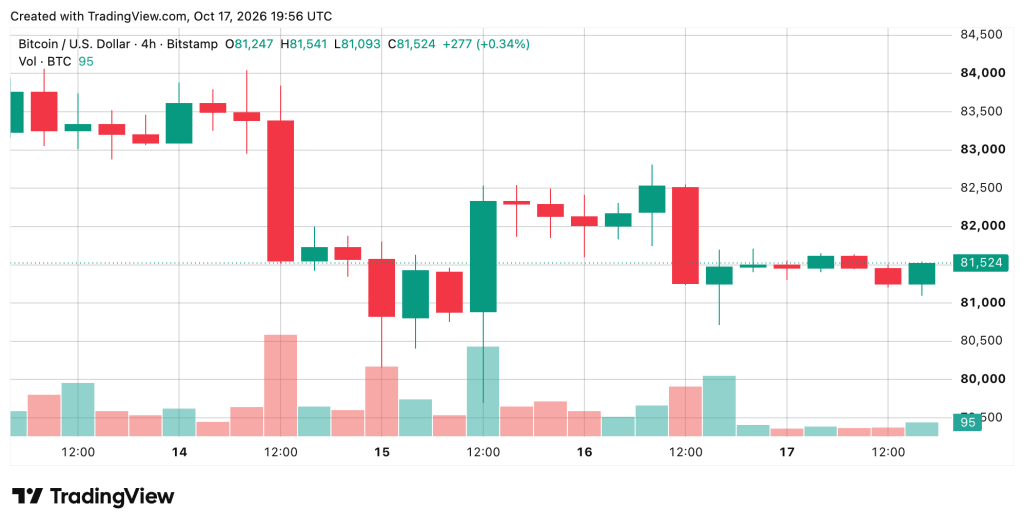
A recovery above $82,500 would begin repairing the immediate technical picture, although the $83,000 region presents another obstacle. Failure to preserve $81,000 would instead direct attention toward $79,694, an important structural support level.
Daily Chart Reveals a Divided Technical Picture
On the daily chart, bitcoin continues to register lower highs following its earlier advance to $87,374, a pattern consistent with weakening upward momentum. Nevertheless, the broader structure has not surrendered its longer-term technical foundations.
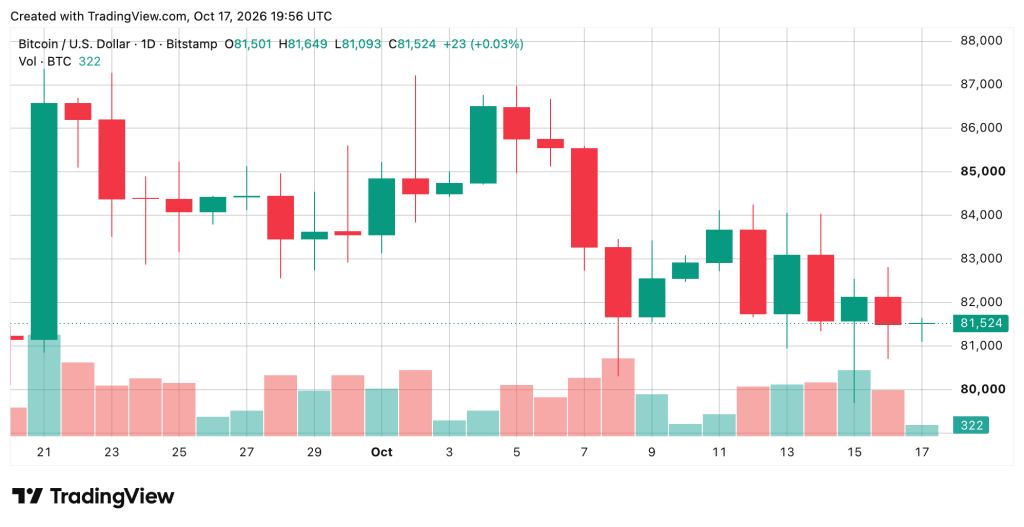
The $80,000 region remains particularly consequential, serving as both a psychological boundary and a nearby technical reference point. Losing that territory would bring $79,694 and potentially $78,000 into focus. Buyers, meanwhile, need to reclaim $83,000 before the daily picture begins looking materially healthier, with $84,254 representing another meaningful resistance barrier.
Oscillators Remain Cautious as Moving Averages Split
The oscillator readings provide little evidence of a decisive shift in momentum. The relative strength index (RSI) stands at 46, indicating neither an overbought nor an oversold condition, while the Stochastic registers 27. The commodity channel index (CCI) sits at negative 116, and the average directional index (ADX) reads 24.
Meanwhile, the moving average convergence divergence (MACD) level of 80 carries a bearish signal, contrasting with positive classifications assigned to momentum and bull bear power. Collectively, eight neutral readings leave directional conviction conspicuously absent.
Moving averages (MAs) tell a more divided story. Bitcoin trades beneath its 10-period exponential moving average (EMA) at $82,343 and 20-period simple moving average (SMA) at $83,405, reinforcing near-term resistance. Yet the 50-period exponential moving average (EMA) at $80,416 and 50-period simple moving average (SMA) at $81,322 remain beneath the market, while the 100- and 200-period averages also retain bullish classifications.
| Bull Verdict 🐂 | Bear Verdict 🐻 |
|---|---|
| Bitcoin bulls need to reclaim $82,500 to demonstrate that buyers are regaining control of the short-term trend. A sustained breakout above $83,000 would strengthen the recovery case and put $84,254 within reach. Holding the $81,000 support region while defending longer-term moving averages would further reinforce the bullish argument and suggest the latest consolidation is laying the groundwork for another upward advance. | Bitcoin bears retain an advantage while prices remain beneath the $82,500 resistance barrier. A decisive breakdown below $81,000, followed by a loss of $80,714, would expose $79,694 and potentially the $78,000 region. Persistent selling pressure beneath shorter-term moving averages would strengthen the bearish case, threaten the broader recovery structure and place longer-term technical support under increasingly intense scrutiny. |
Leave a Reply
You must be logged in to post a comment.