Bitcoin is trading at $109,549 to $109,939 over the last hour as of Sept. 2, 2025, with a market capitalization of $2.18 trillion. Over the past 24 hours, the cryptocurrency has seen a trading volume of $39.53 billion and ranged between $107,542 and $110,641, signaling active but indecisive market behavior near critical support and resistance levels.
Bitcoin
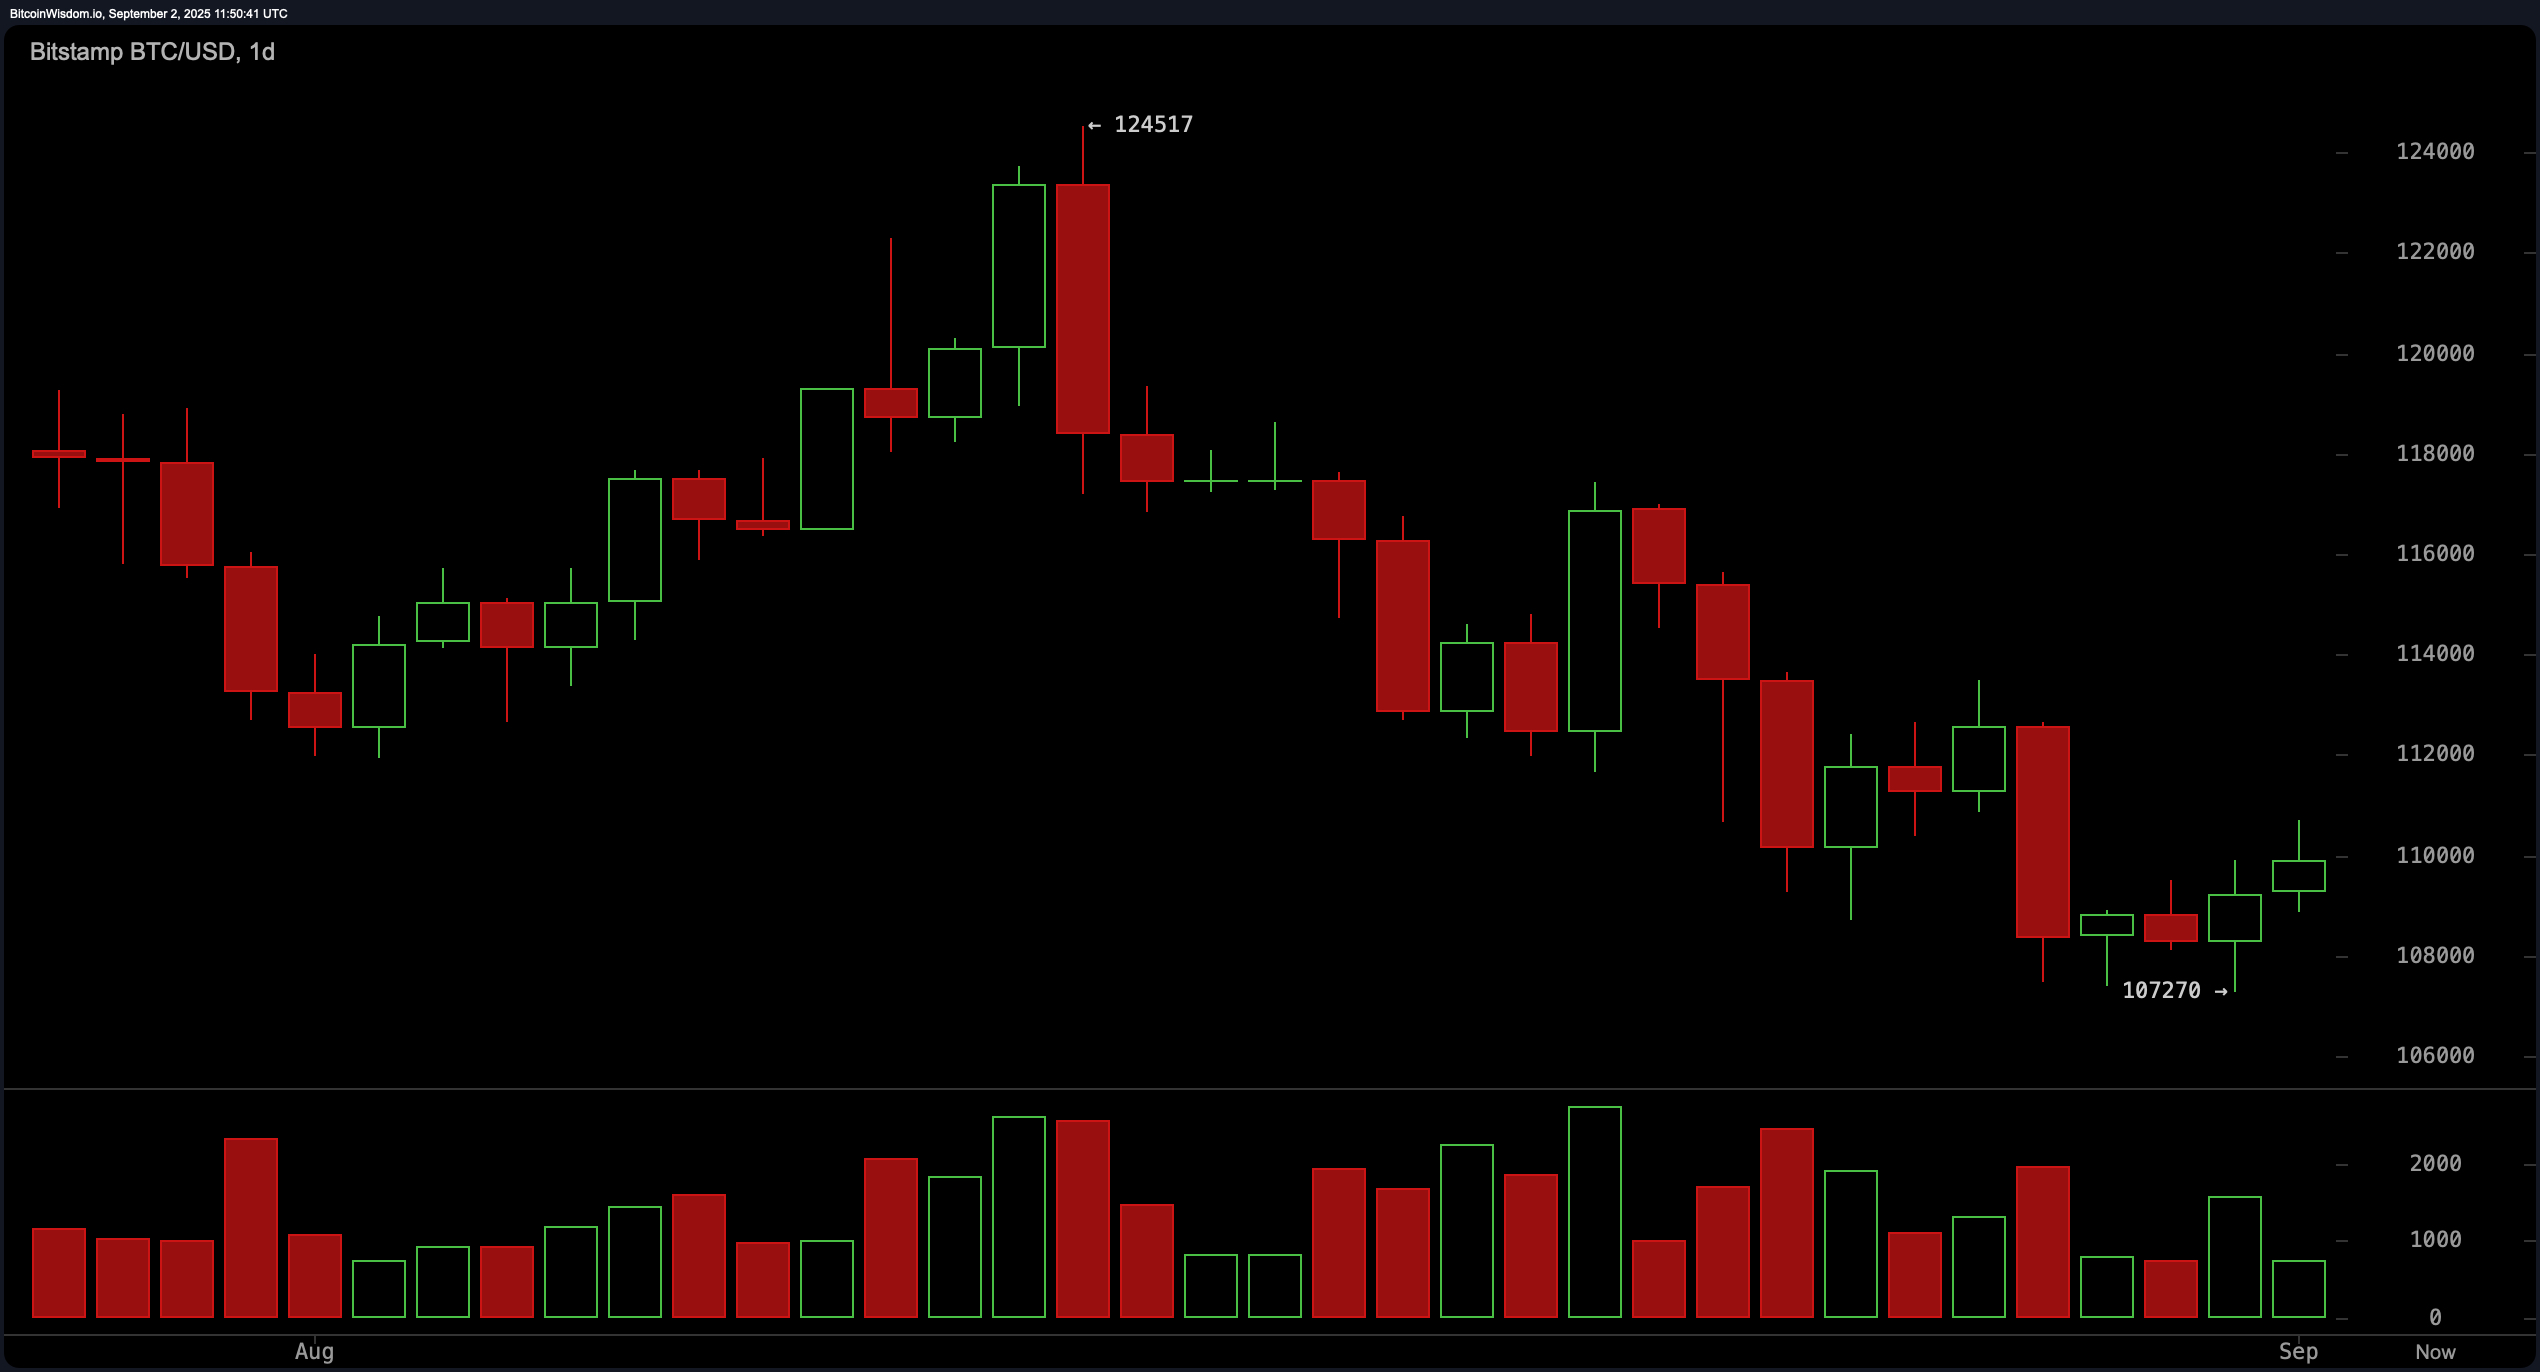
Price action on the daily bitcoin chart reveals a recent decline from a peak of approximately $124,517 to a low near $107,270. The chart is beginning to show signs of a potential reversal, with a green daily candle forming from the bottom, suggesting early bullish momentum. Despite this, volume spikes during the sell-off confirm prior strong selling pressure. The key support zone remains between $107,000 and $108,000, while resistance sits firmly between $112,000 and $114,000. A breakout above this range with confirming volume would shift momentum decisively in favor of the bulls.
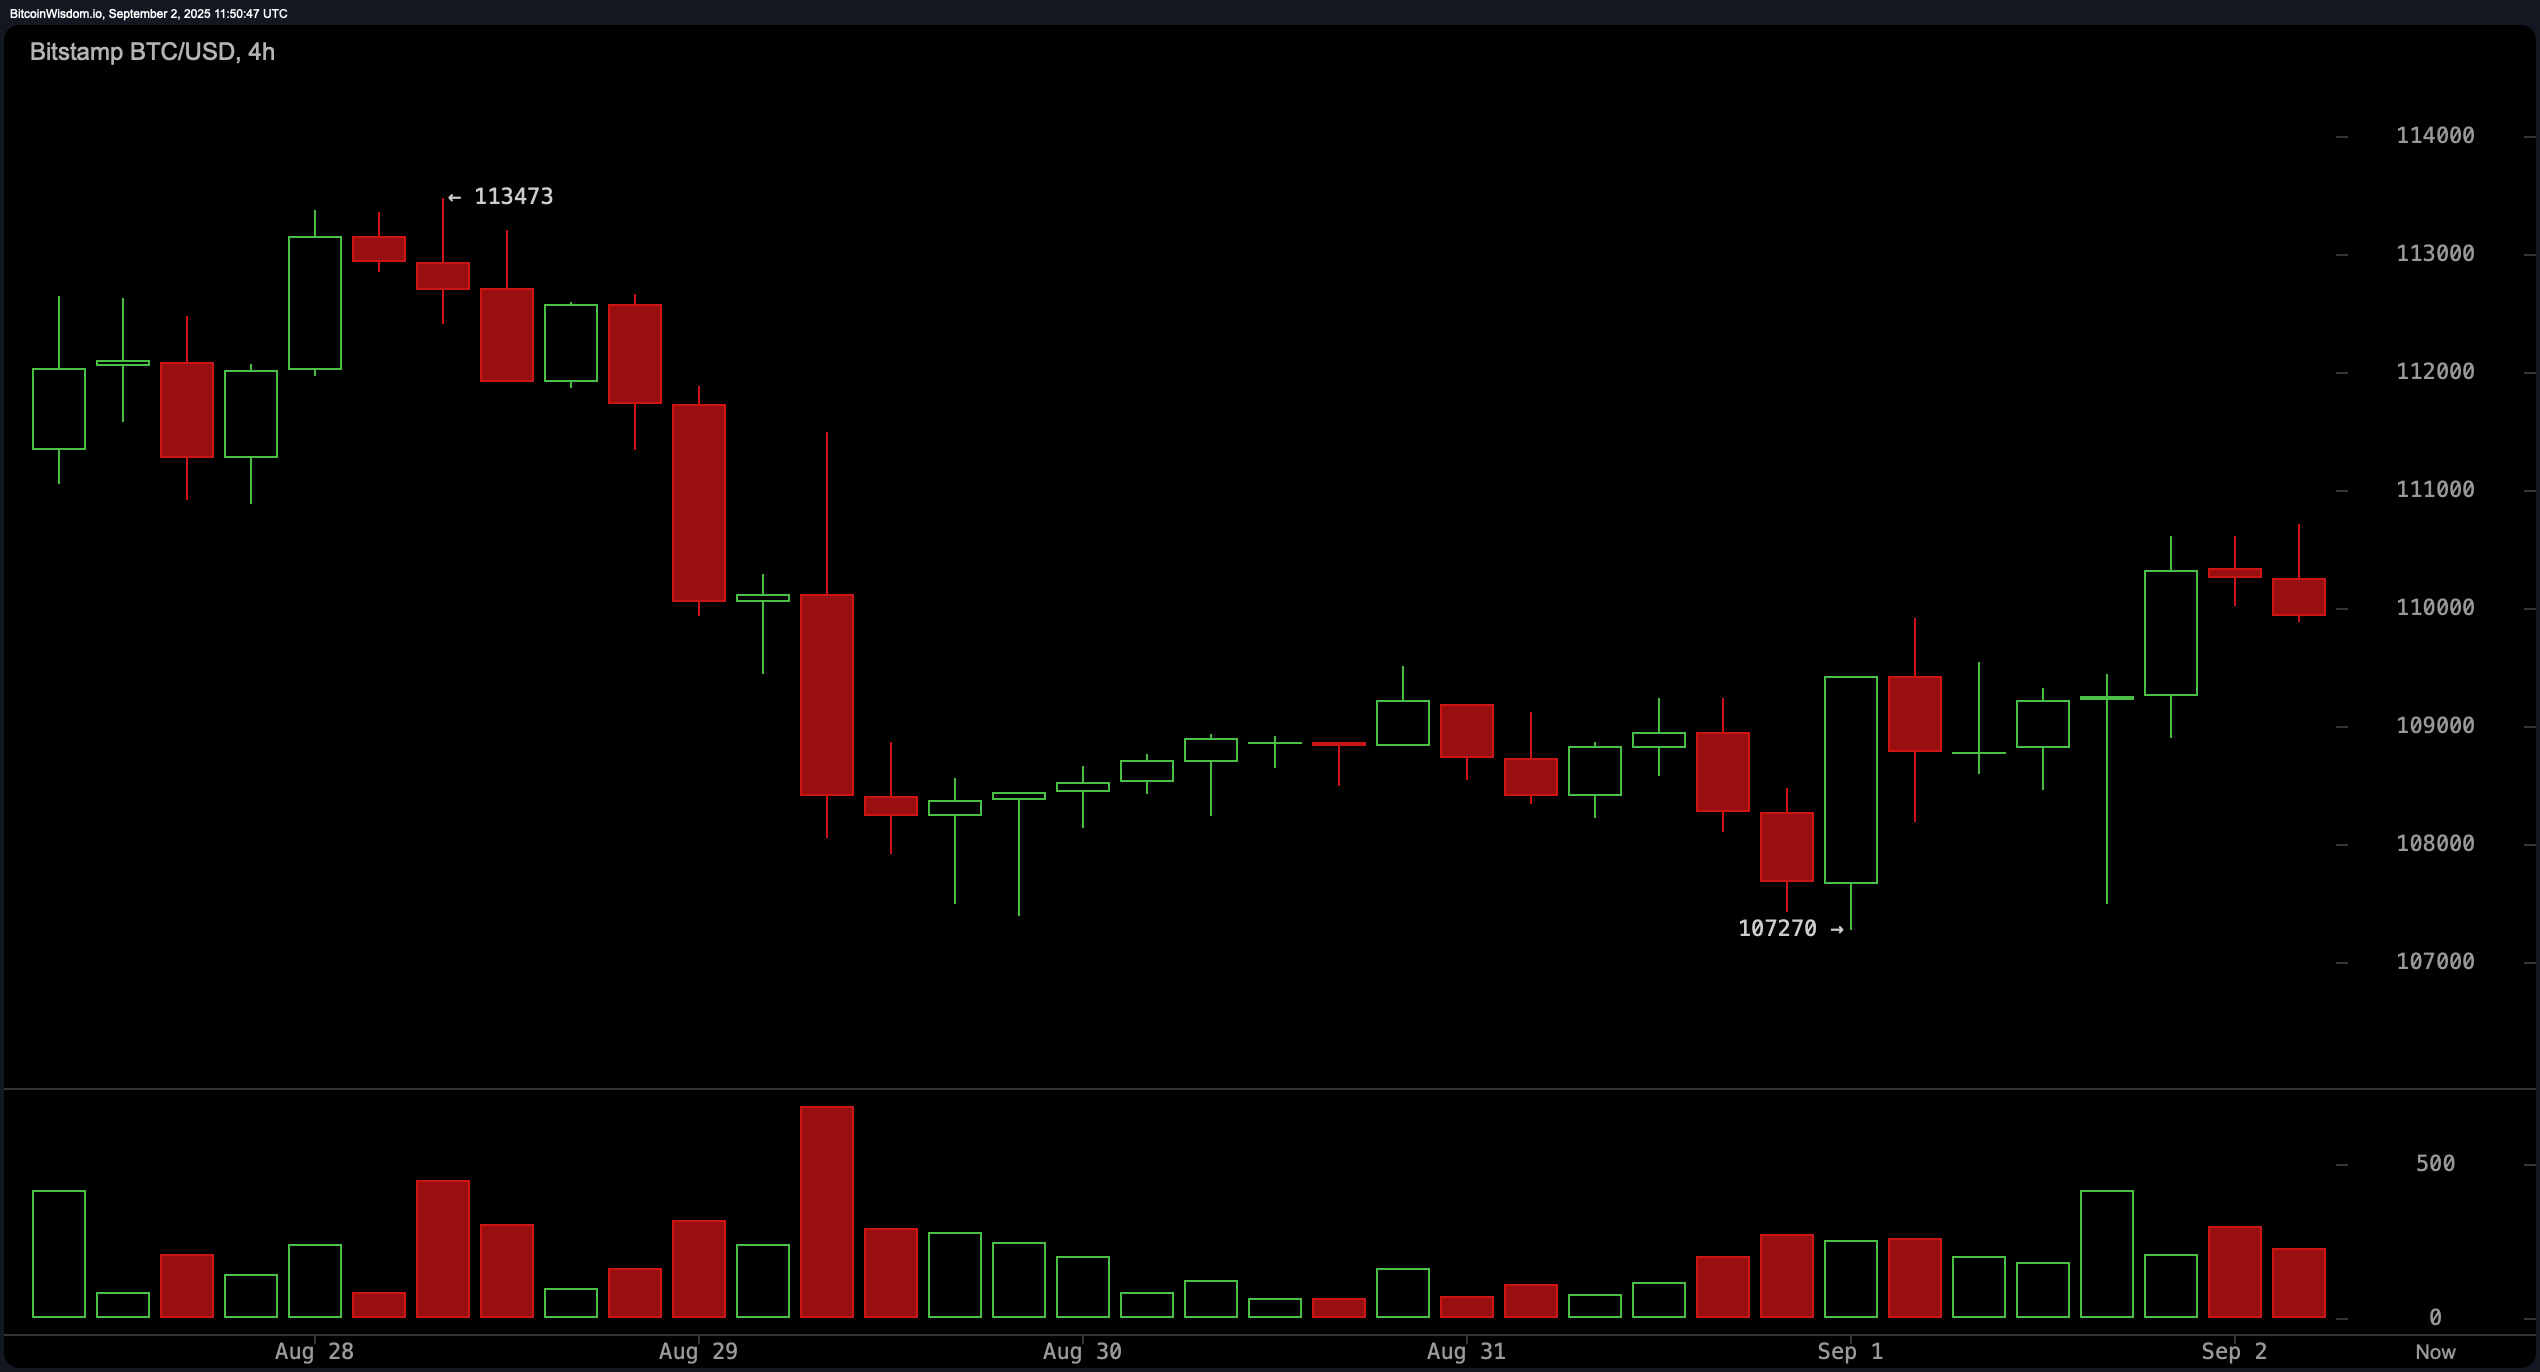
The 4-hour chart supports a more optimistic short-term narrative, with bitcoin forming a classic double-bottom pattern at $107,270. Price has since been climbing, forming higher lows and displaying encouraging buying interest on green candles. Immediate resistance is identified near $110,700, and if bitcoin re-tests support at $108,500 to $109,000 and prints a bullish candle, it may present a favorable long opportunity. A breakout above $111,000 on strong volume would further validate bullish sentiment, whereas a rejection at that level followed by a close under $109,000 would negate the thesis.
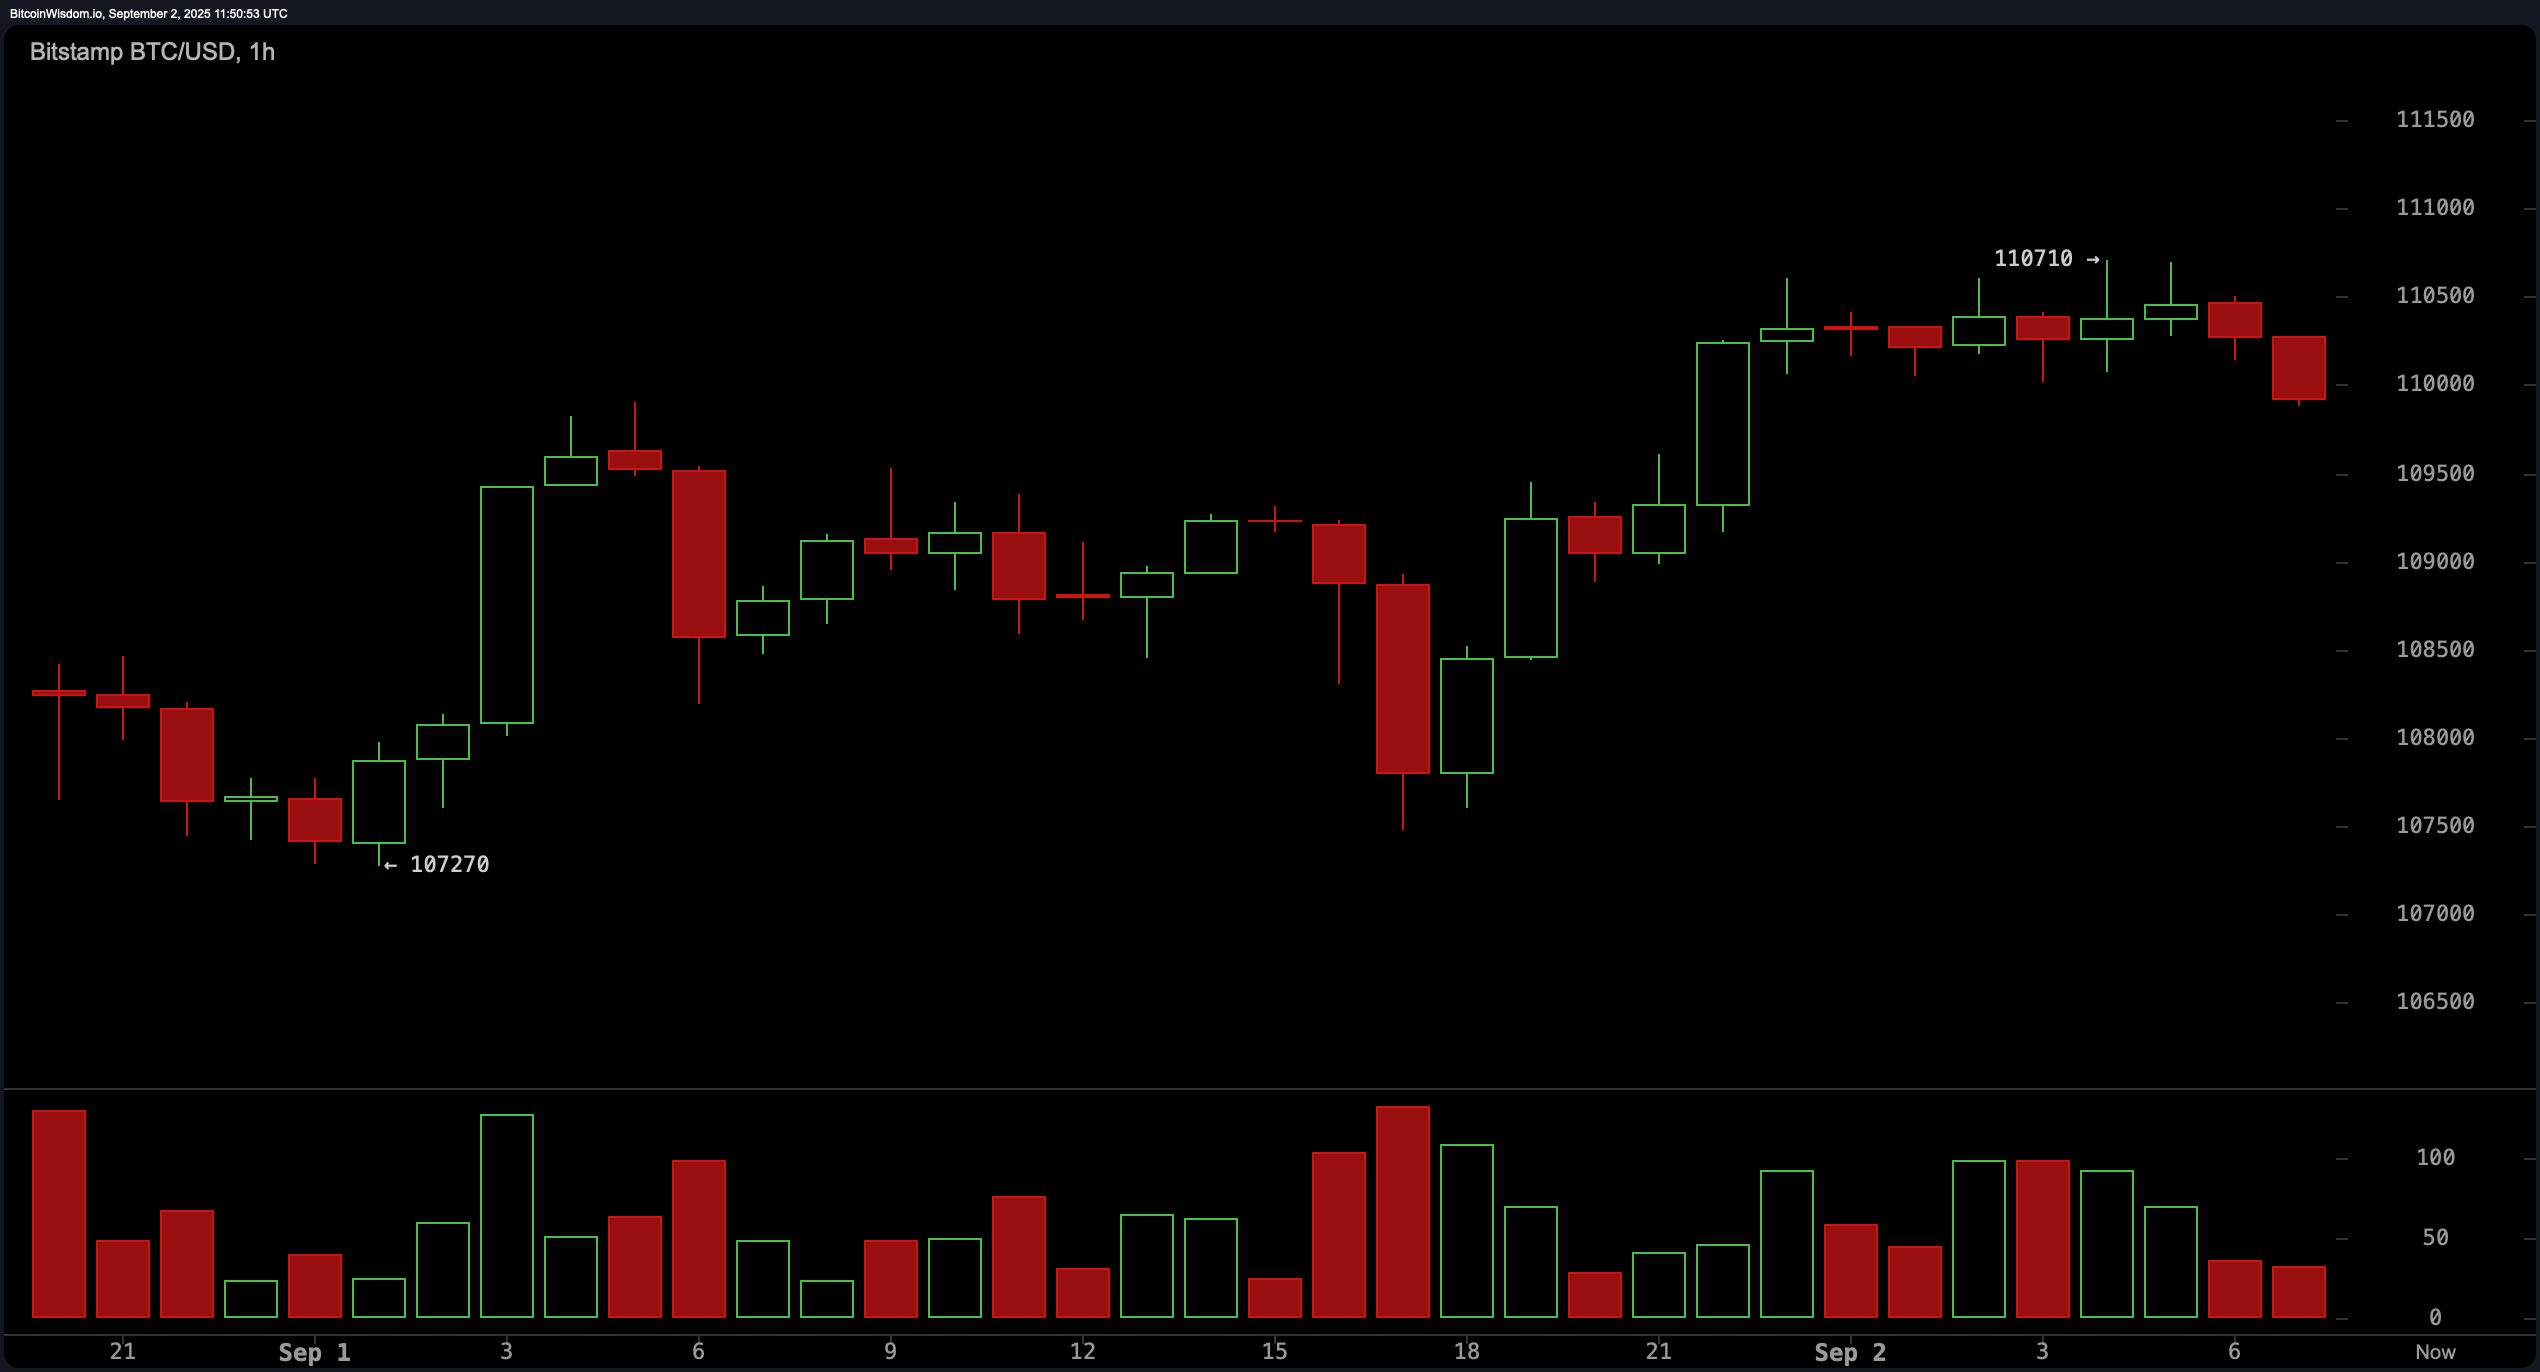
Short-term bitcoin price action on the 1-hour chart illustrates a structured rally from $107,270 to just under $111,000, followed by a phase of consolidation. Volume has decreased in this range, indicating that traders may be awaiting a breakout catalyst. A confirmed break above $110,700 to $111,000 could spark a short-term rally. Conversely, a drop below $108,000 with rising volume may trigger selling pressure and suggest a false breakout scenario.
Oscillator readings reflect a largely neutral market. The relative strength index (RSI) is at 42, the Stochastic oscillator is at 18, and the commodity channel index (CCI) stands at −79—all of which suggest no clear momentum direction. The average directional index (ADX) at 20 supports this indecision. The momentum indicator is slightly bullish at −5,426, while the moving average convergence divergence (MACD) level at −1,930 leans bearish, suggesting mixed momentum dynamics in the short term.
Moving averages (MA) across all major timeframes present a bearish posture, with most short- and mid-term indicators—such as the 10-day, 20-day, 30-day, 50-day, and 100-day exponential moving averages (EMAs) and simple moving averages (SMAs)—signaling negative sentiment. However, the 200-day EMA at $104,180 and 200-day SMA at $101,390 remain in a bullish territory, indicating that long-term trend strength is still intact, even amid near-term weakness. Until bitcoin reclaims and consolidates above the $112,000–$114,000 zone, traders are advised to remain cautious and employ risk management strategies, such as placing stops below $107,000.
Bull Verdict:
If bitcoin maintains its footing above $109,000 and decisively breaks the $111,000 barrier with volume confirmation, the stage is set for a short-term bullish continuation. A successful breakout above the $112,000–$114,000 resistance zone would confirm a medium-term trend reversal and potentially reignite momentum toward previous highs.
Bear Verdict:
Failure to hold above $109,000 per bitcoin, combined with increasing volume on a breakdown below $108,000, would signal a failed reversal attempt. Sustained rejection at resistance and bearish moving averages could push bitcoin back toward the $107,000 support, or lower, reinforcing the broader downtrend and discouraging bullish positioning in the near term.