Bitcoin traded at $114,011 on Sept. 11, 2025, bolstered by a market capitalization of $2.27 trillion and a 24-hour trading volume of $48.11 billion. The day’s intraday price range spanned from $112,255 to $114,451, indicating tight consolidation within a key resistance zone.
Bitcoin
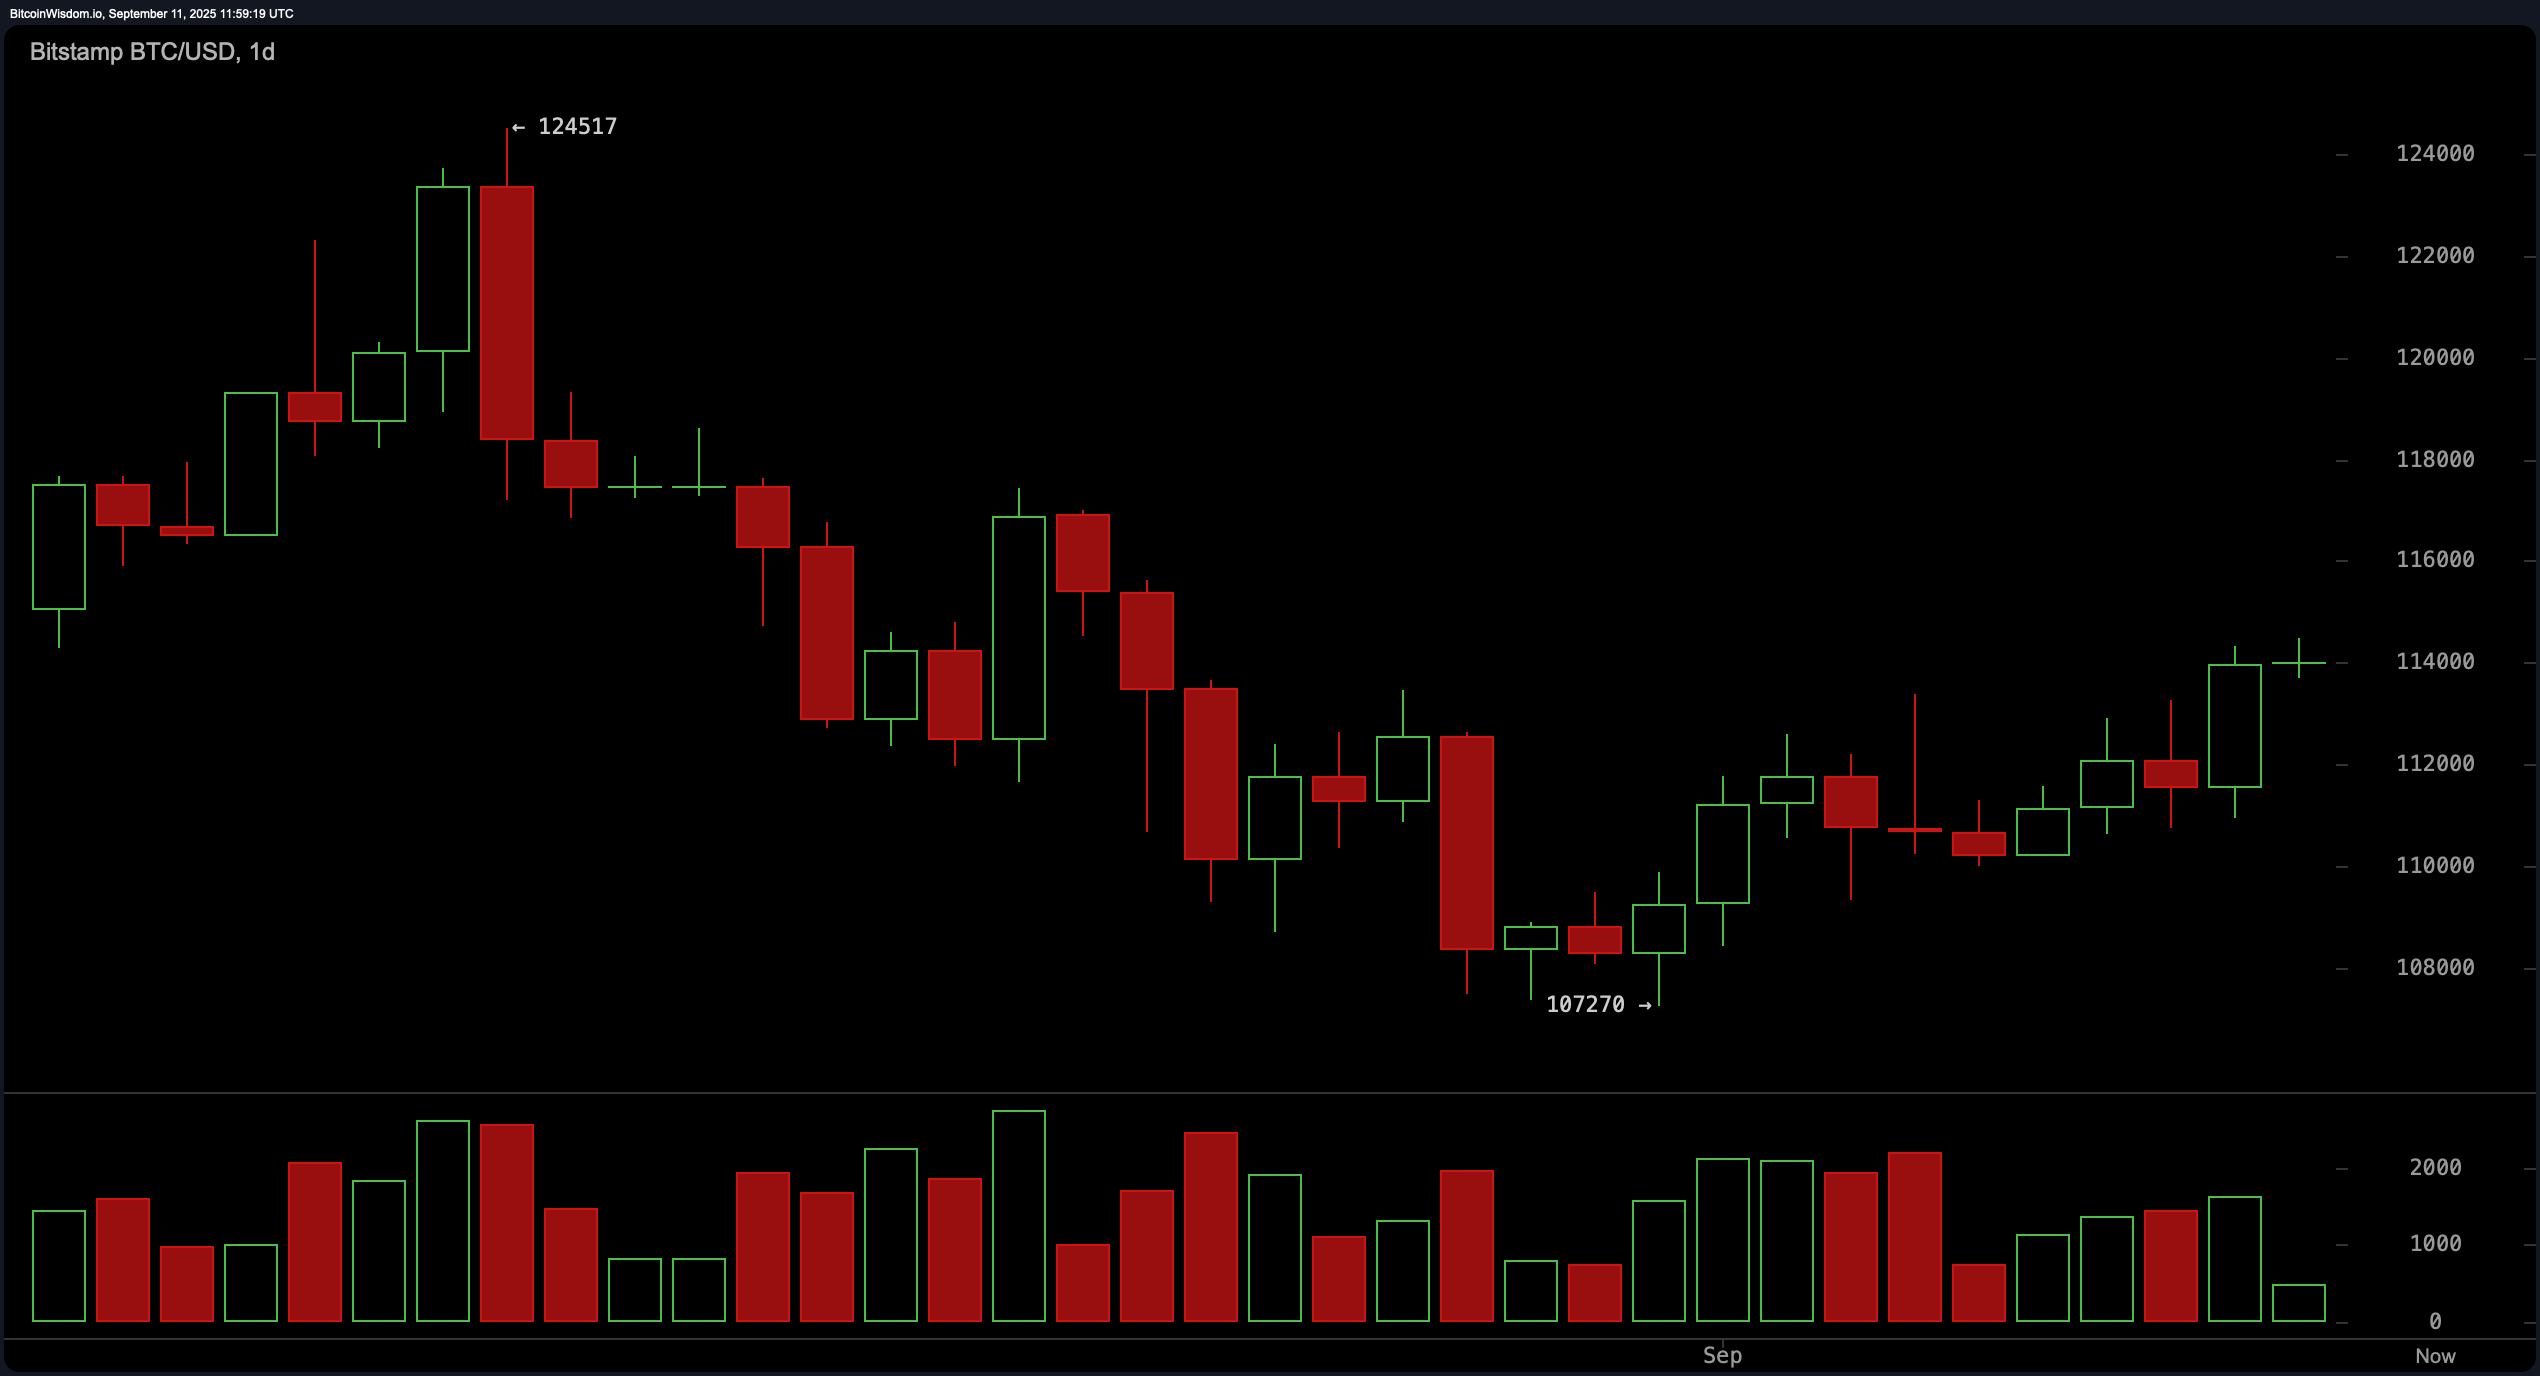
Bitcoin’s daily chart reveals a gradual recovery from a prior downtrend that saw prices dip to a low of approximately $107,270. The recent pattern of higher lows and higher highs marks a potential bullish reversal, supported modestly by volume expansion on green candles—a signal of early accumulation. The area just above $114,000 acts as a decisive pivot; a close above this level with significant volume would confirm a bullish breakout.
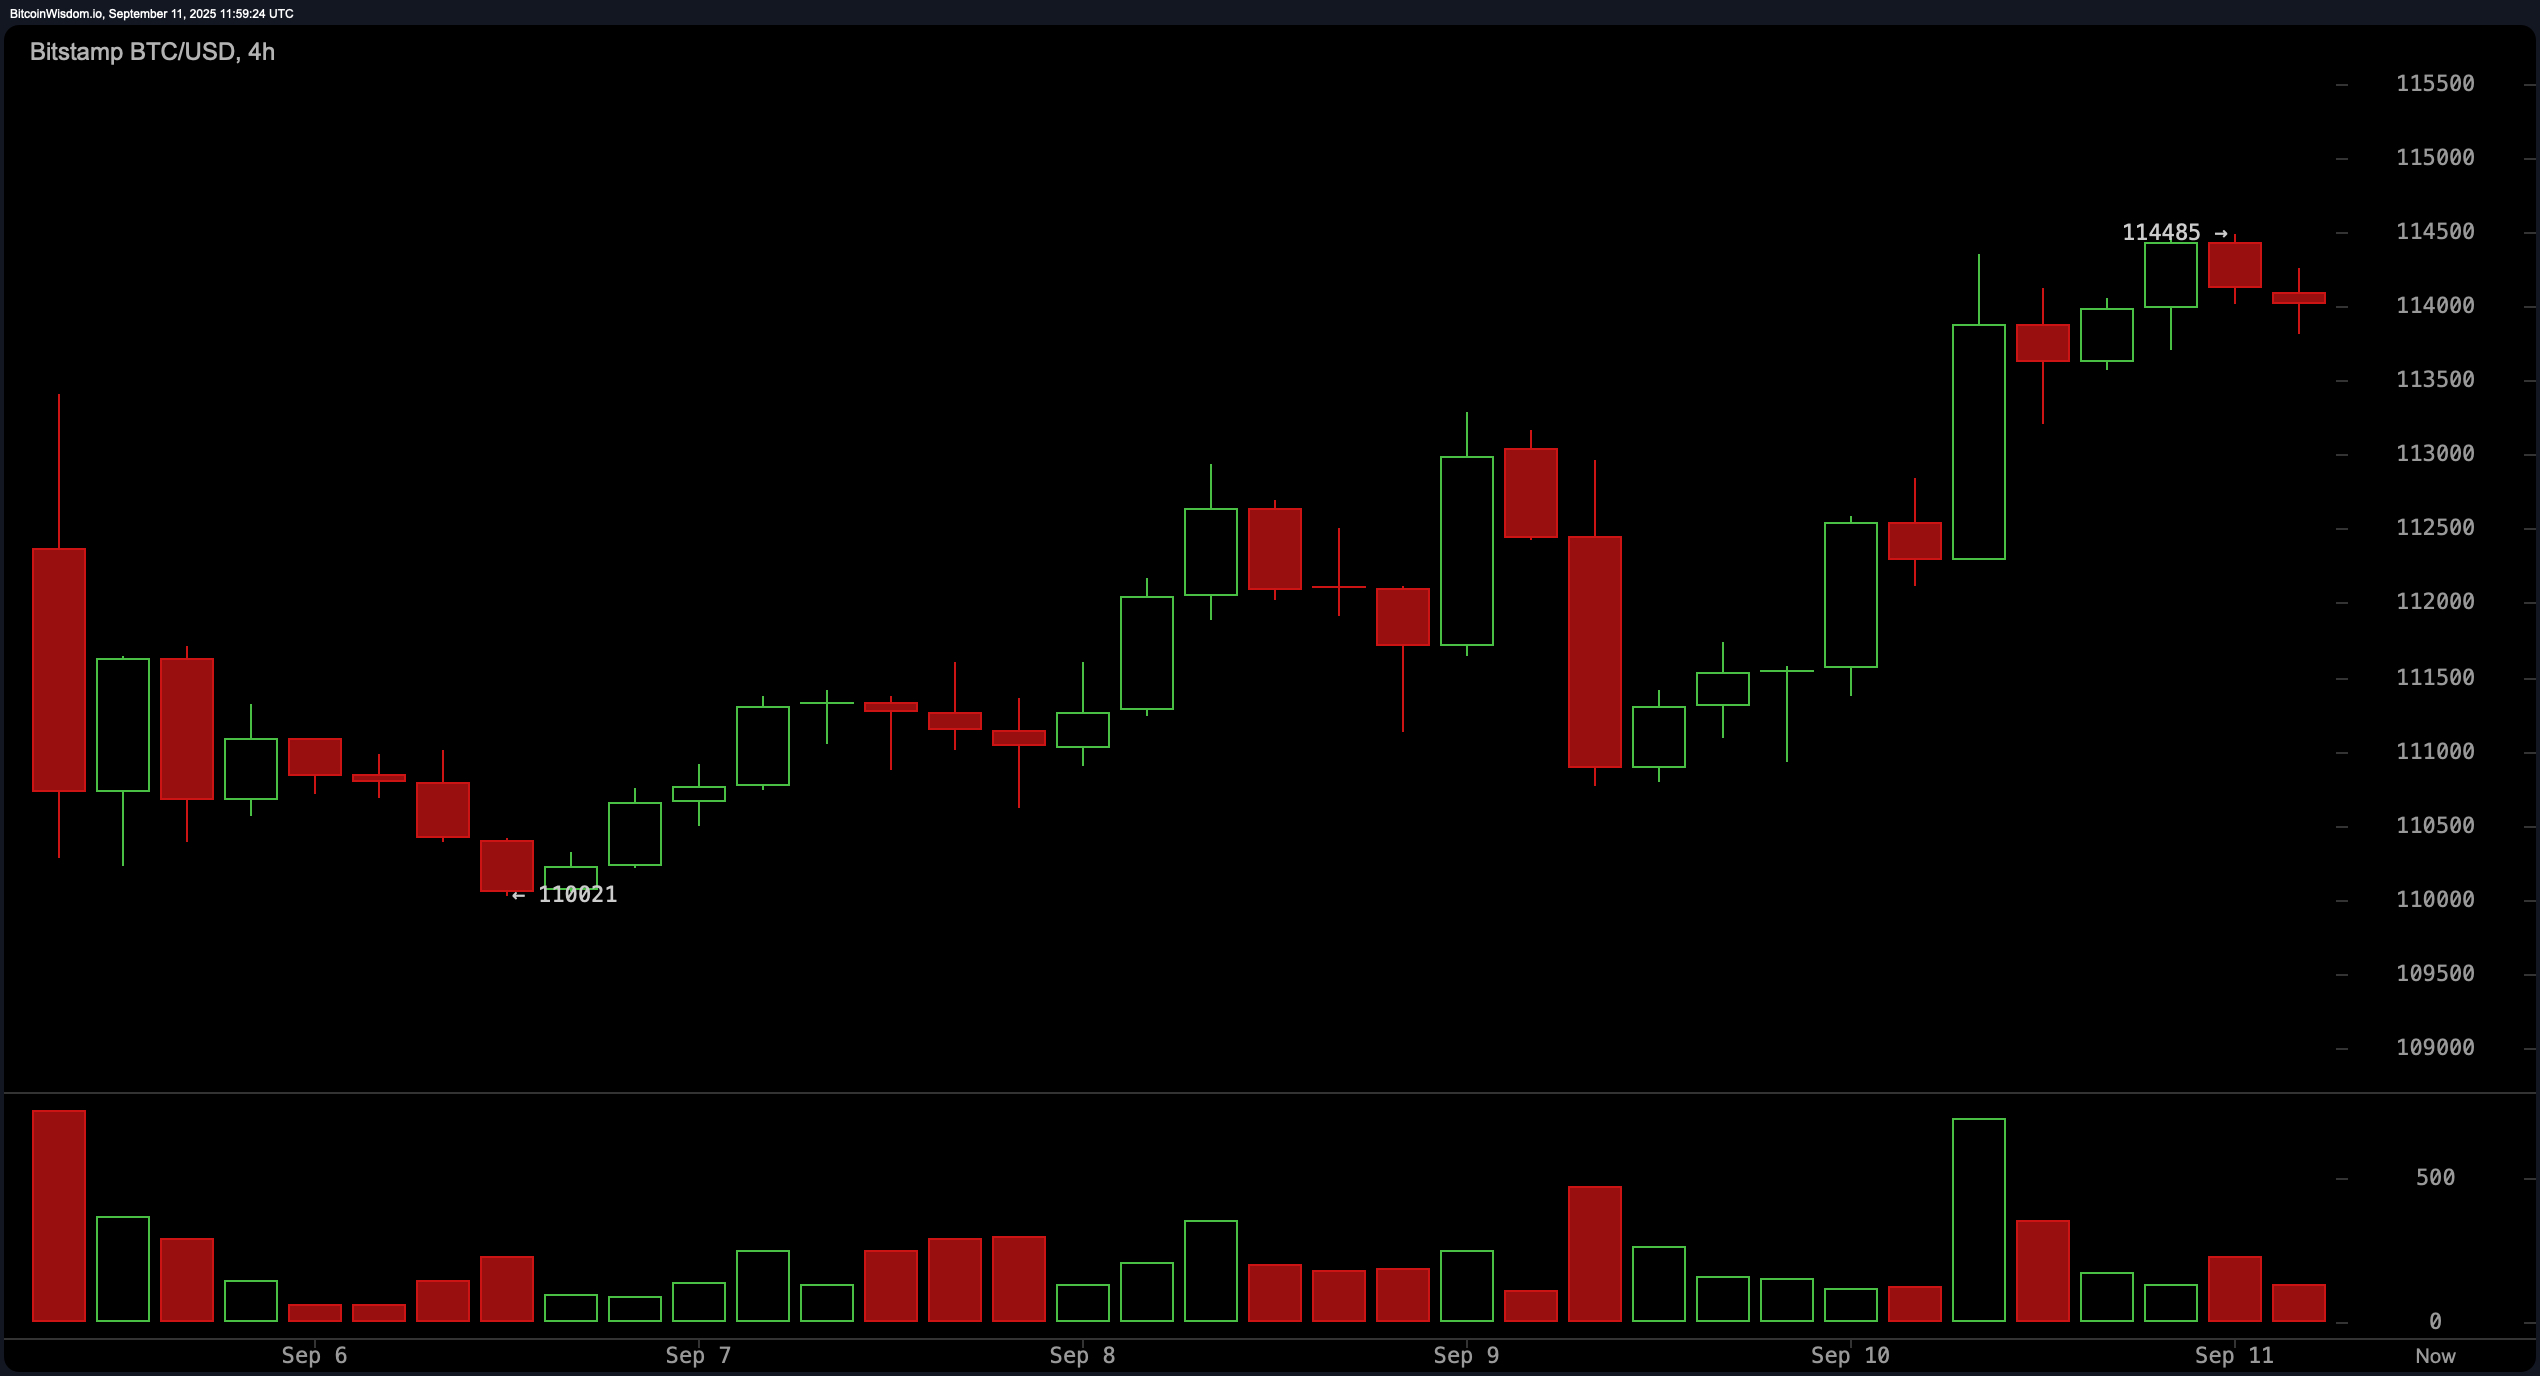
On the 4-hour chart, bitcoin has advanced from $110,021 to a high of $114,485, driven by consistent bullish momentum over the past several days. This upward thrust has now paused in what appears to be a consolidation phase near resistance. The range between $112,500 and $113,000 may offer a short-term entry point if it confirms as a support zone. Conversely, a clear breakout above $114,500, validated by increased trading volume, would open the door for another leg higher. A fall back below $110,000, however, would negate the current bullish trend and raise the prospect of a deeper pullback.
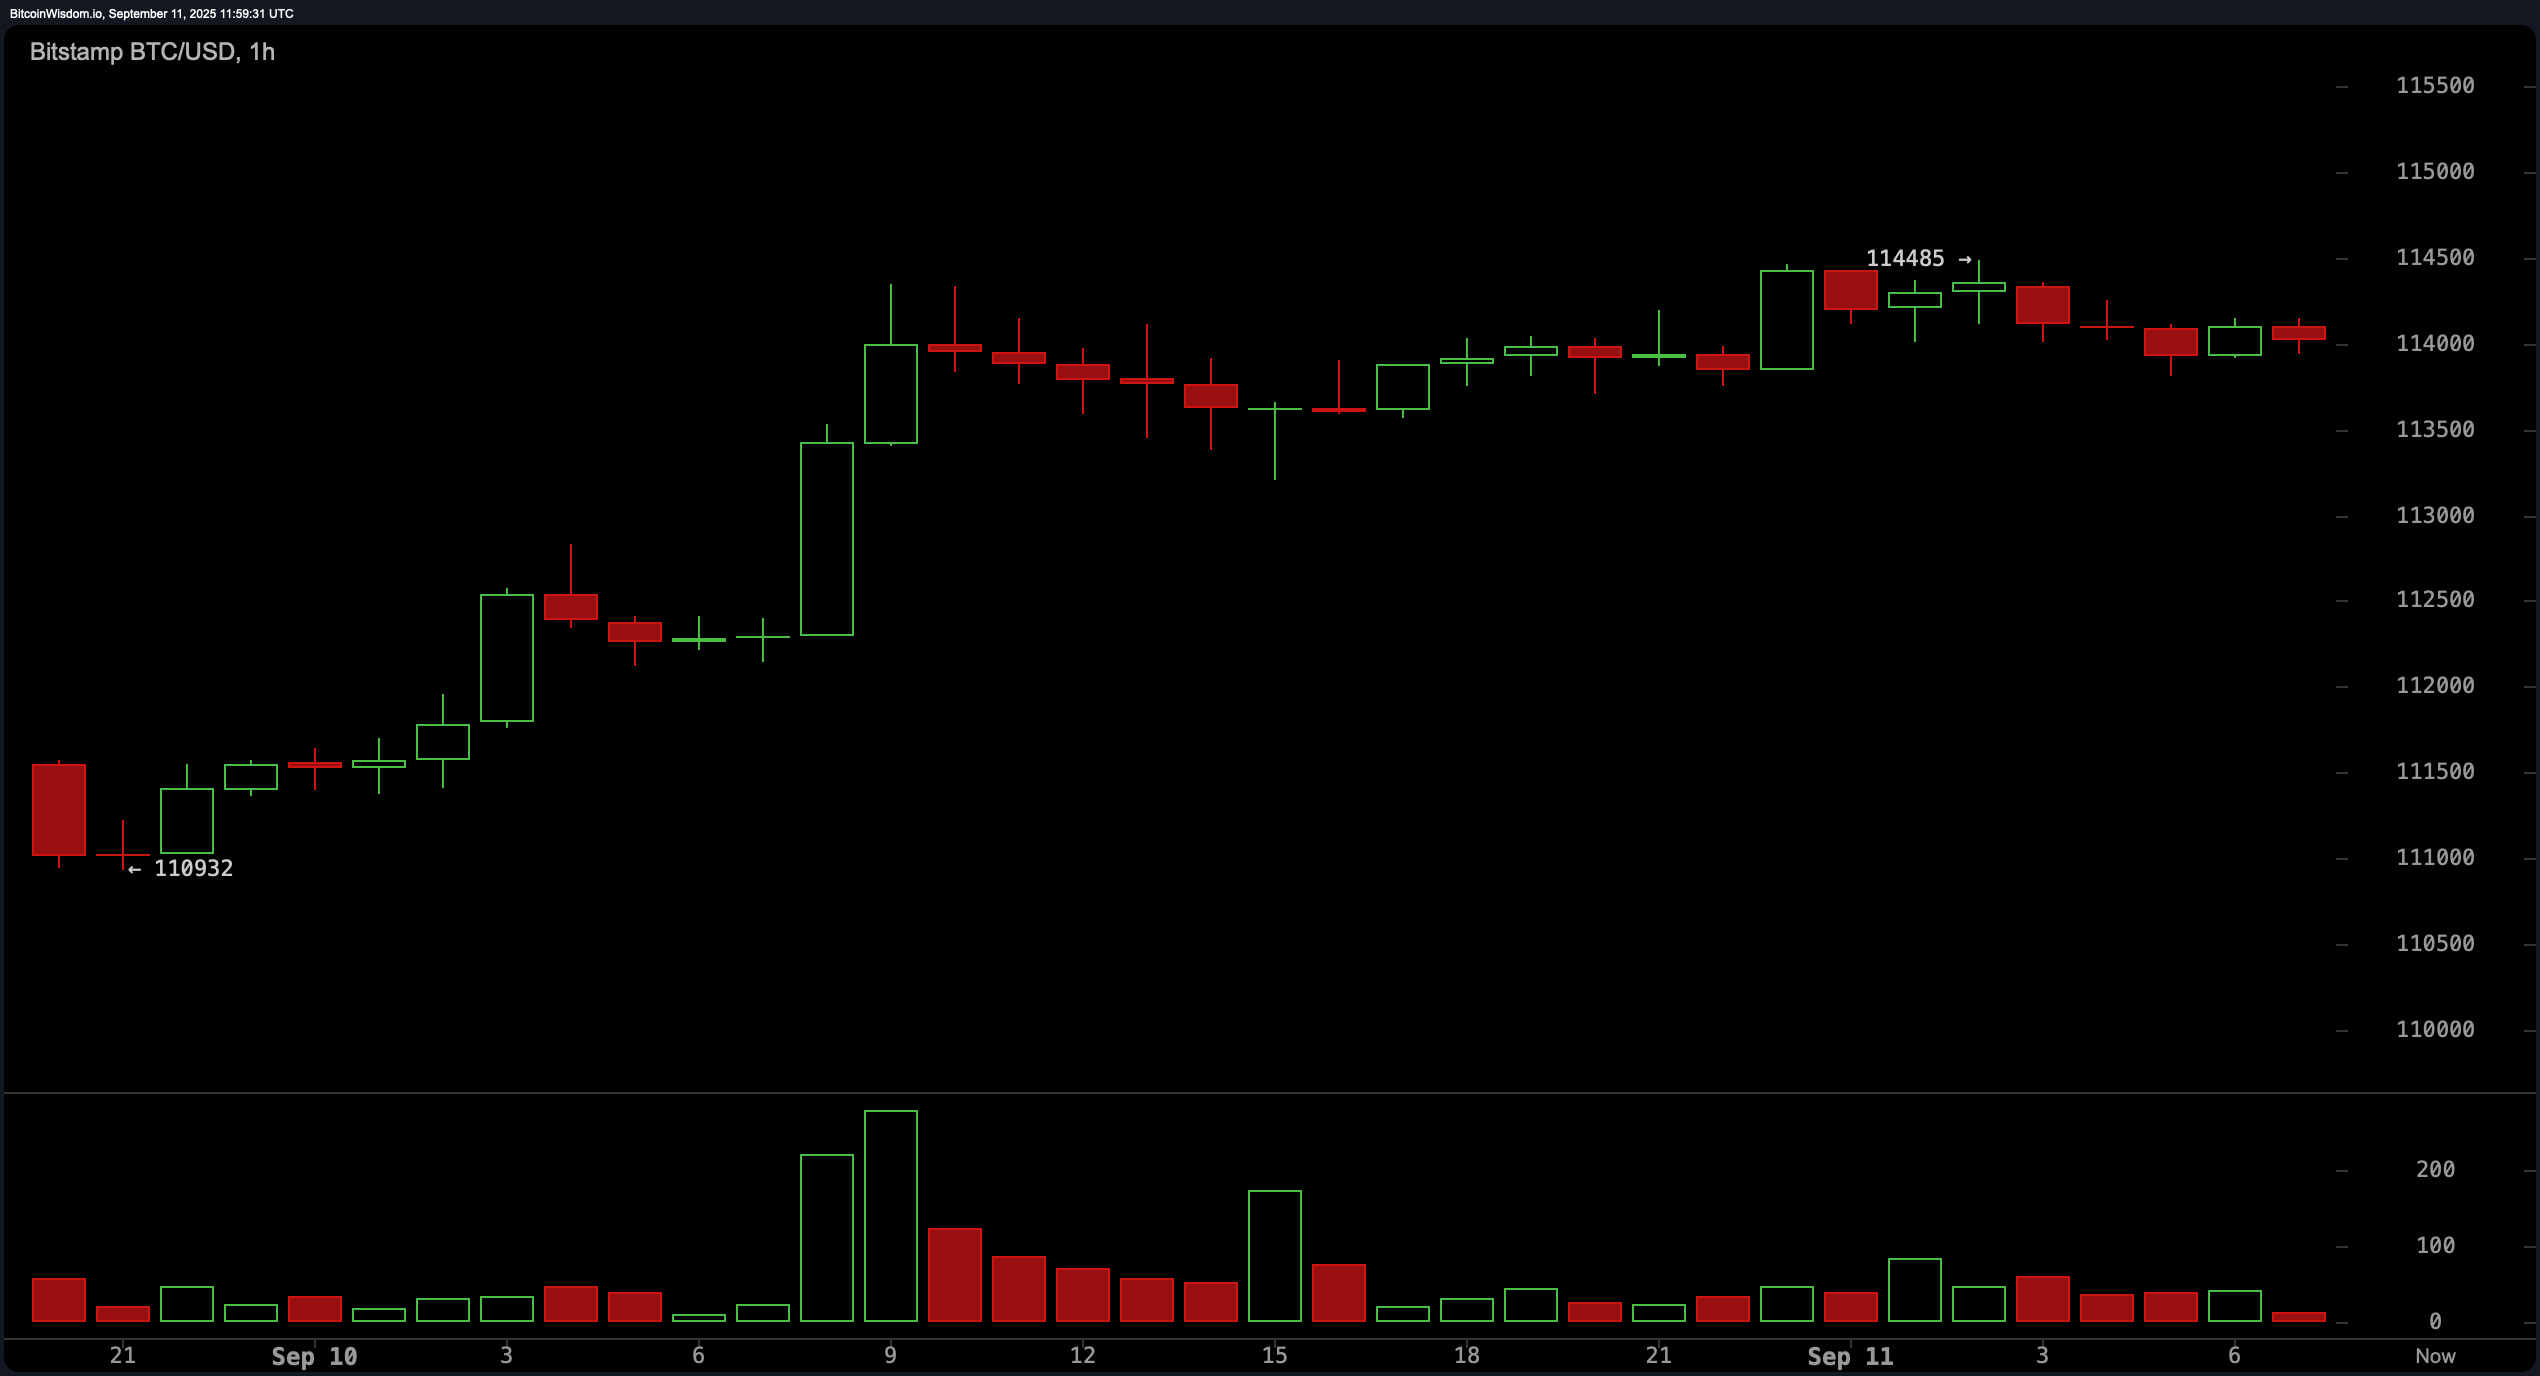
In the 1-hour timeframe, bitcoin exhibits a tight microstructure following a rapid impulse move from roughly $110,932 to $114,485. Current price action suggests a bull flag or pennant formation, often a continuation pattern in trending markets. The absence of strong volume implies indecision, but traders may find opportunities in a breakout above $114,500, targeting the $115,000–$115,500 zone. Conversely, a drop below $113,000 could signal short-term weakness and a possible bearish shift in momentum.
Technical indicators present a mixed but slightly bullish bias. Among oscillators, the relative strength index (RSI) at 54, stochastic at 86, commodity channel index (CCI) at 137, and average directional index (ADX) at 15 all signal neutrality. The awesome oscillator reflects a modest bearish tilt, printing −1,514, while the momentum indicator at 4,772 shows a sell bias. The moving average convergence divergence (MACD) level, at −508, suggests a buy signal. In terms of trend-following indicators, nearly all key moving averages are in alignment with upward momentum. Both exponential moving averages (EMAs) and simple moving averages (SMAs) across 10 to 200 periods largely print “buy,” with the exception of the 50-period SMA, which remains bearish.
Overall, bitcoin‘s price structure remains constructive, with critical resistance clustered around $114,500. This level has emerged as the immediate battleground for bulls and bears, and its breach would likely catalyze a stronger uptrend. With market participants seeing momentum rebuild, bitcoin appears poised for either a confirmed breakout or a brief correction—depending largely on volume confirmation and macro sentiment in the next few sessions.
Bull Verdict:
If bitcoin successfully closes above $114,500 with sustained volume, it confirms bullish continuation, potentially targeting the $120,000 to $124,000 range in the near term. Momentum remains supportive, and the alignment of moving averages strengthens the case for further upside.
Bear Verdict:
Failure to break above $114,500—or a sharp rejection at this level—could mark the start of a corrective move, with downside risk toward $110,000 or lower. Momentum oscillators show fatigue, and a breakdown below $113,000 would further invalidate bullish structure in the short term.