Key takeaways
- BTC is down by less than 1% in the last 24 hours and trading around $117k.
- The coin could target the $120k psychological level next, following a recent bullish momentum
Fed rate cut pushes BTC above $117k as bullish trend resumes
The cryptocurrency market performed excellently this week, with Bitcoin bouncing back from its Monday low of $114k to trade above $117k. The positive performance was due to macroeconomic factors, especially the Fed rate cut on Wednesday.
The rate cut allowed Bitcoin to hit the $117k level, with bulls now targeting another high around $120k in the near term. Analysts believe that the rate cut will push liquidity into the crypto market.
In an email with Coinjournal, Sergei Gorev, Head of Risk at YouHodler, stated that the Fed’s rate cut is quite an important factor for the market.
“This is a positive development for the financial and crypto markets. Cheaper money pushes the quotes higher and higher. As long as liquidity prevails in the markets, the cryptocurrency market will feel quite confident. We will soon see new historical quotes for BTC, which will also support other coins. In addition, the approval of all new altcoin ETFs will also boost inflows into some cryptocurrencies soon.”
Bitcoin bulls target $120,000
The BTC/USD 4-hour chart is bullish and efficient after Bitcoin’s price surged past its 50-day Exponential Moving Average (EMA) on September 10. It found support around the $116k level earlier this week before rallying past the $117k on Wednesday.
BTC has been consolidating around $117k over the past 24 hours, but could be set to rally higher in the near term. The RSI of 57 shows that the bulls are still in control, with the Moving Average Convergence (MACD) indicator on the same chart displaying a bullish crossover since September 6th.
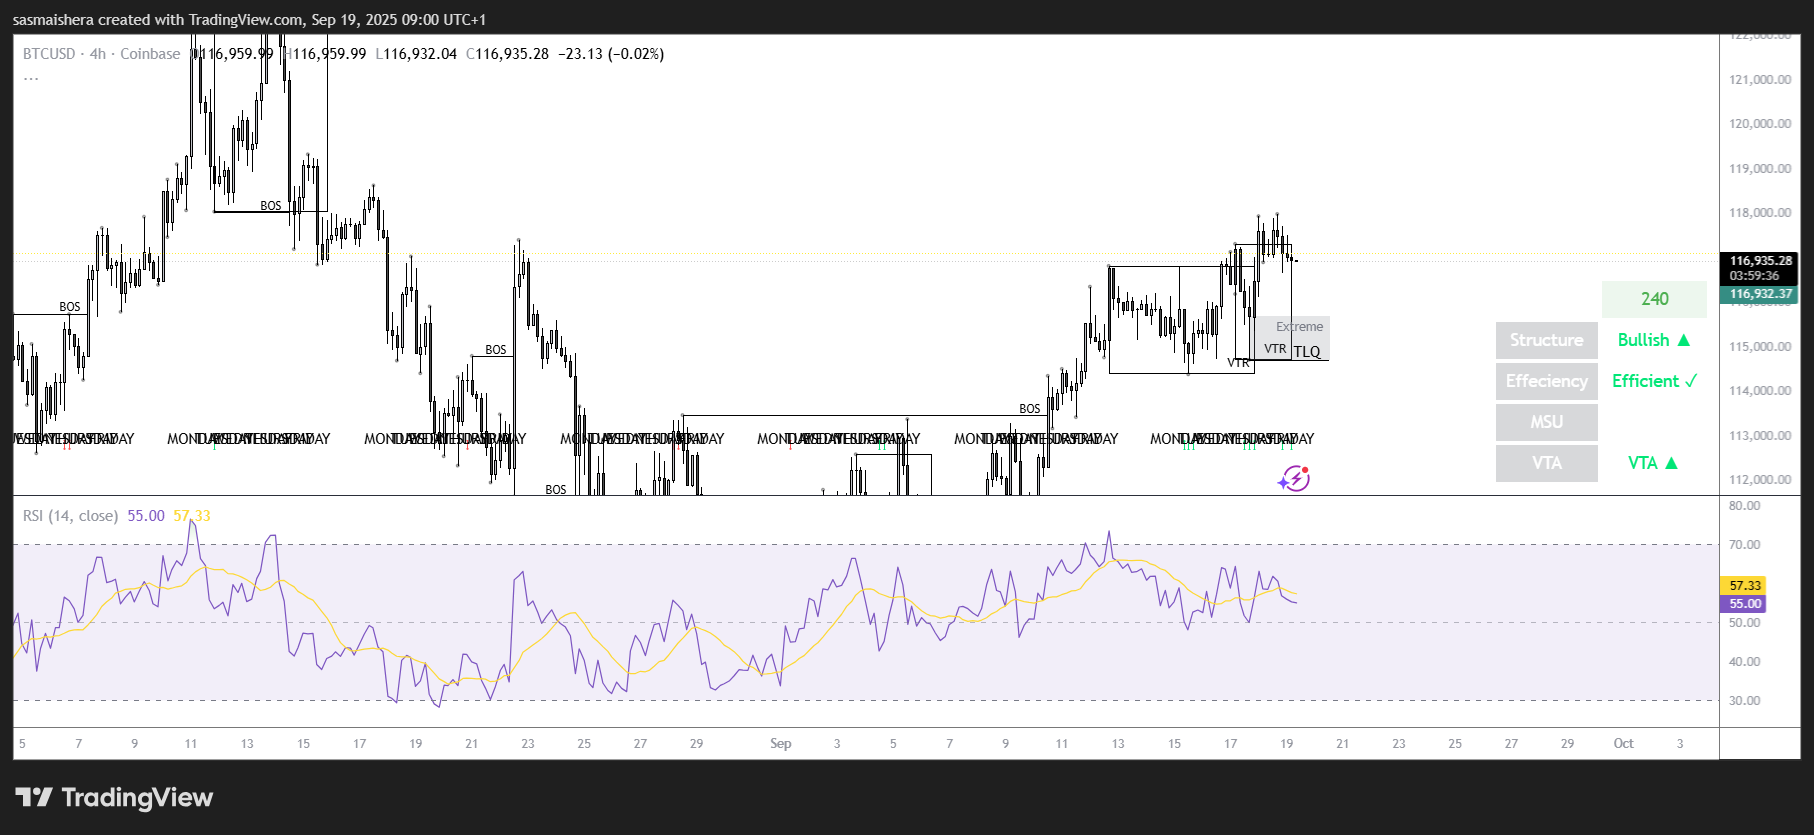
If the bullish trend continues, BTC could extend its current rally towards the psychological level of $120,000. An extended bullish run would allow it to hit the $125k mark and set a new all-time high in the process.
However, if the market corrects and closes below the $116k support level, BTC could face selling pressure and extend its decline towards the next major support and TLQ zone at $113,924.