
Bitcoin remained buoyant as of July 14, 2025, with its price stabilizing at $121,680. The cryptocurrency’s market capitalization hit $2.42 trillion, supported by a strong 24-hour trade volume of $56.62 billion and an intraday range spanning $117,935 to $123,236.
Bitcoin
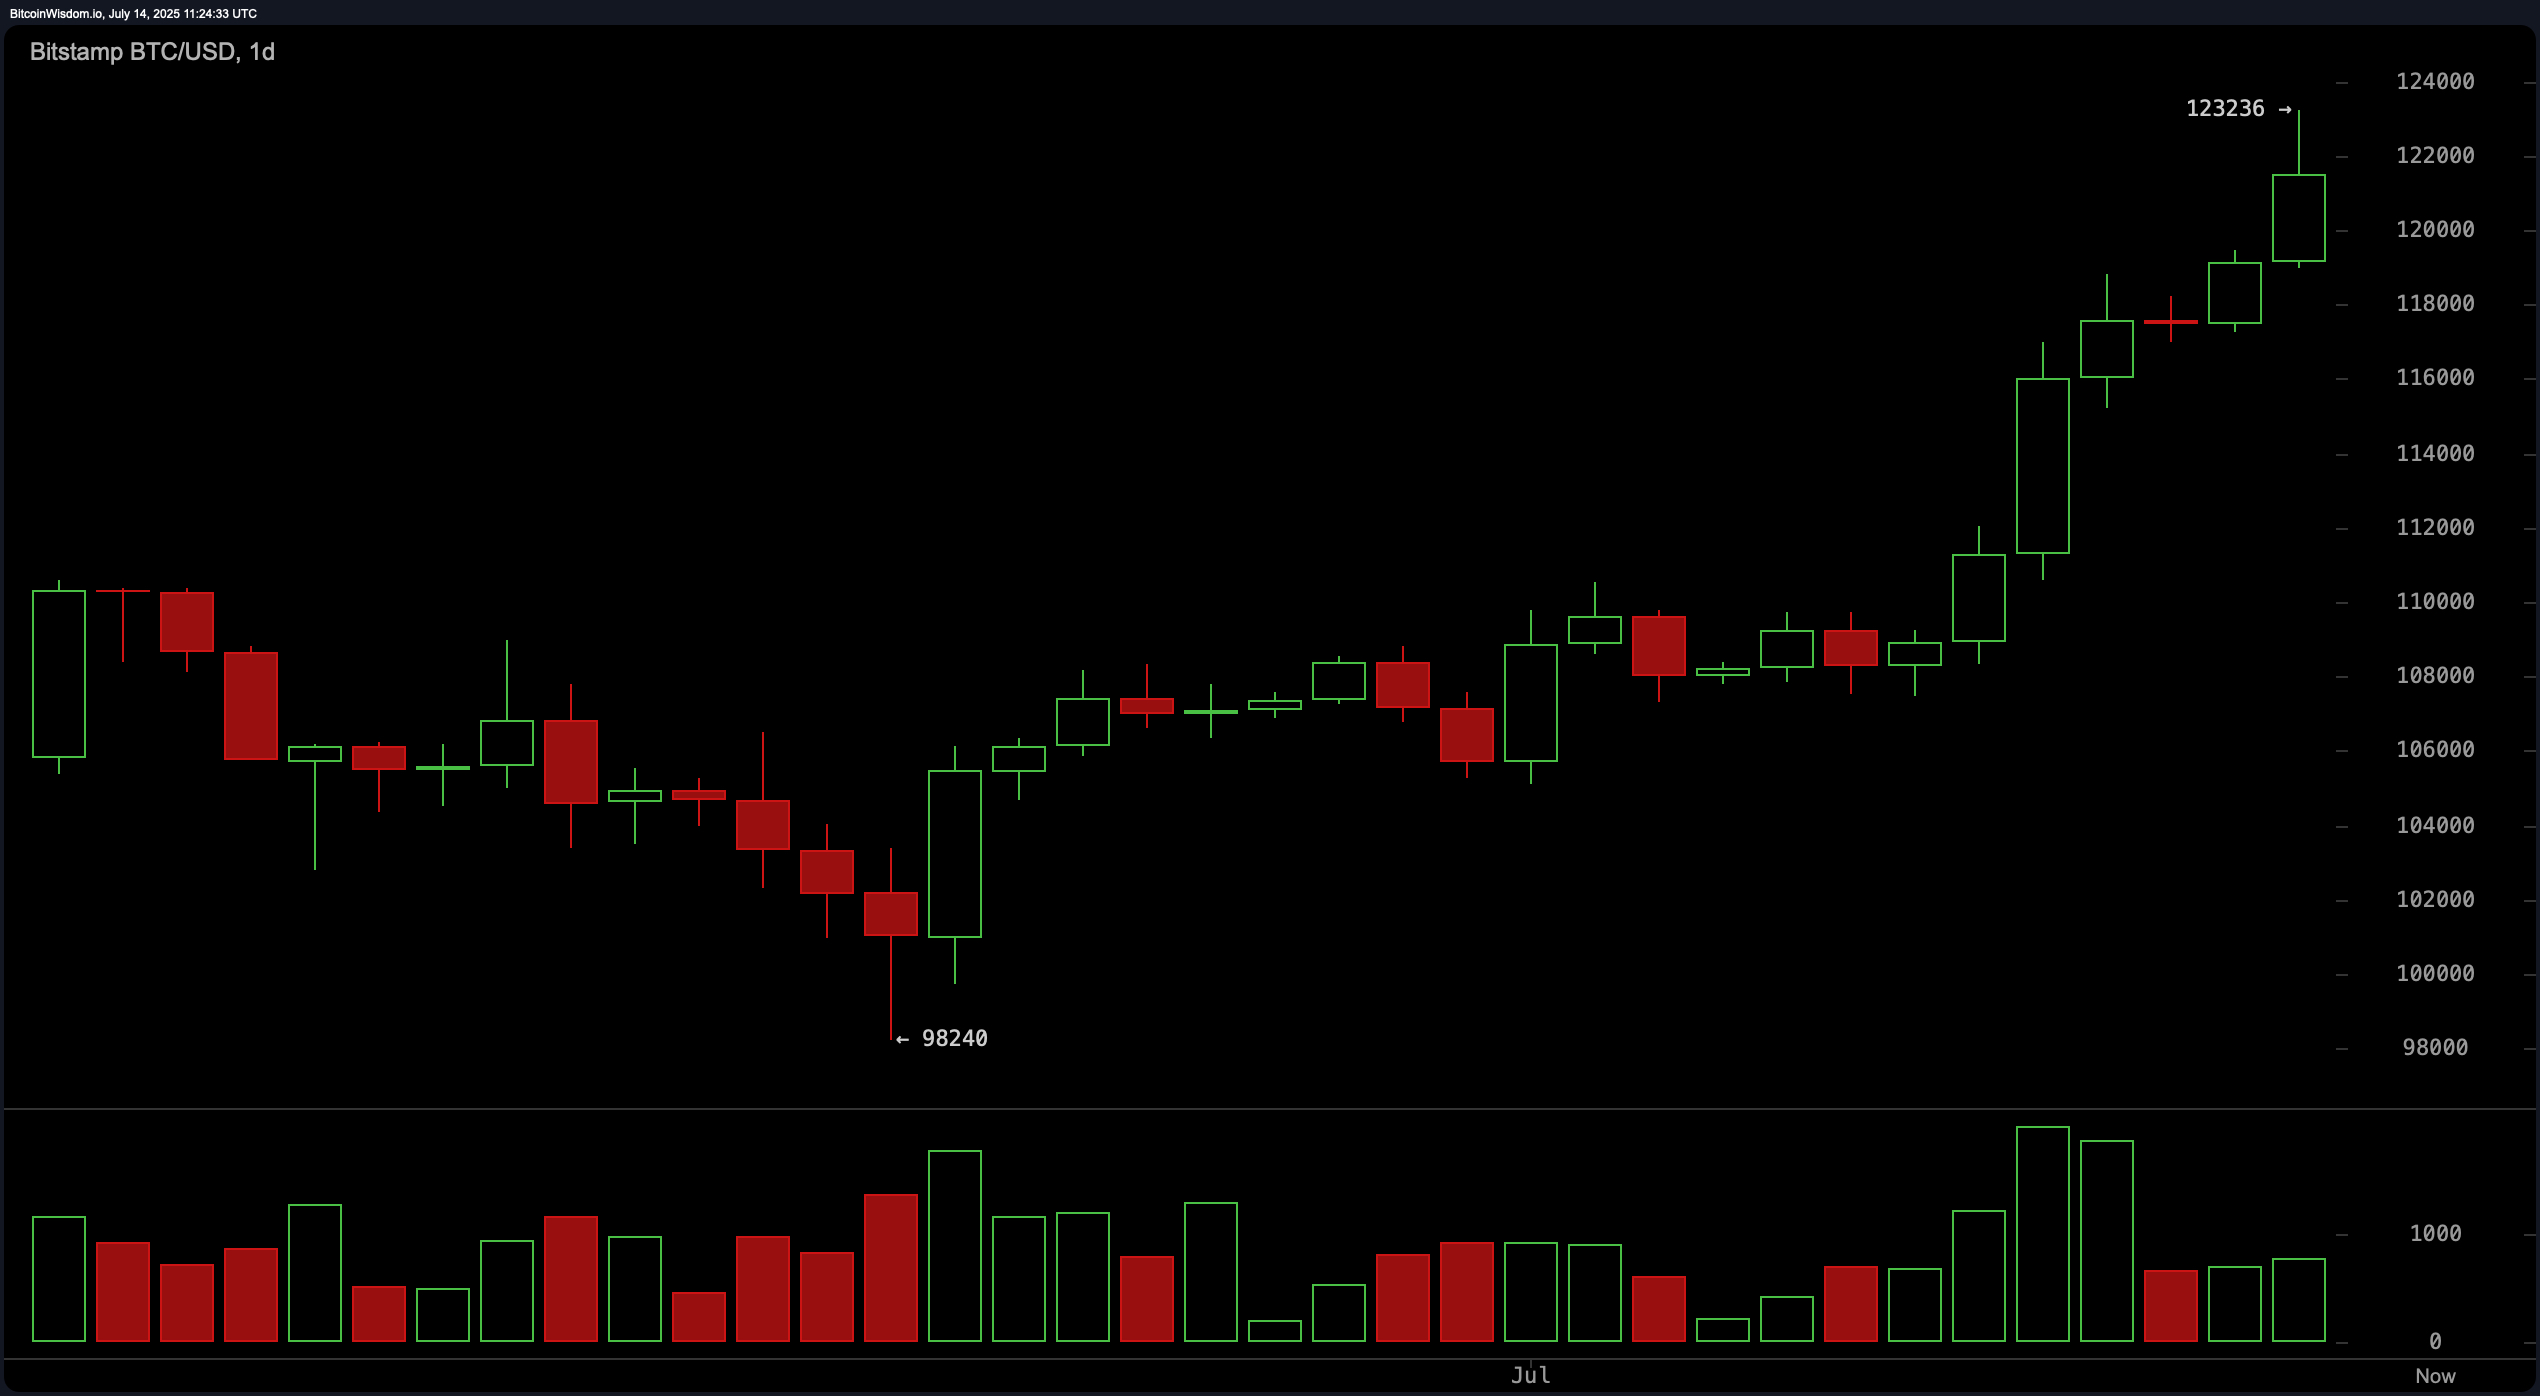
Price action over the past 24 hours indicates that bitcoin is firmly entrenched in a bullish cycle, with higher timeframes signaling continuation patterns, while shorter timeframes warn of exhaustion. On the daily chart, bitcoin has appreciated roughly 25 percent, climbing from $98,240 to a local high of $123,236. This breakout came on the heels of a long consolidation period and was confirmed by a noticeable volume spike. Resistance remains tightly held around the $123,000 mark, while former resistance turned support is now found in the $110,000 zone. Technical analysts will watch for a retest of this support to potentially reenter long positions.
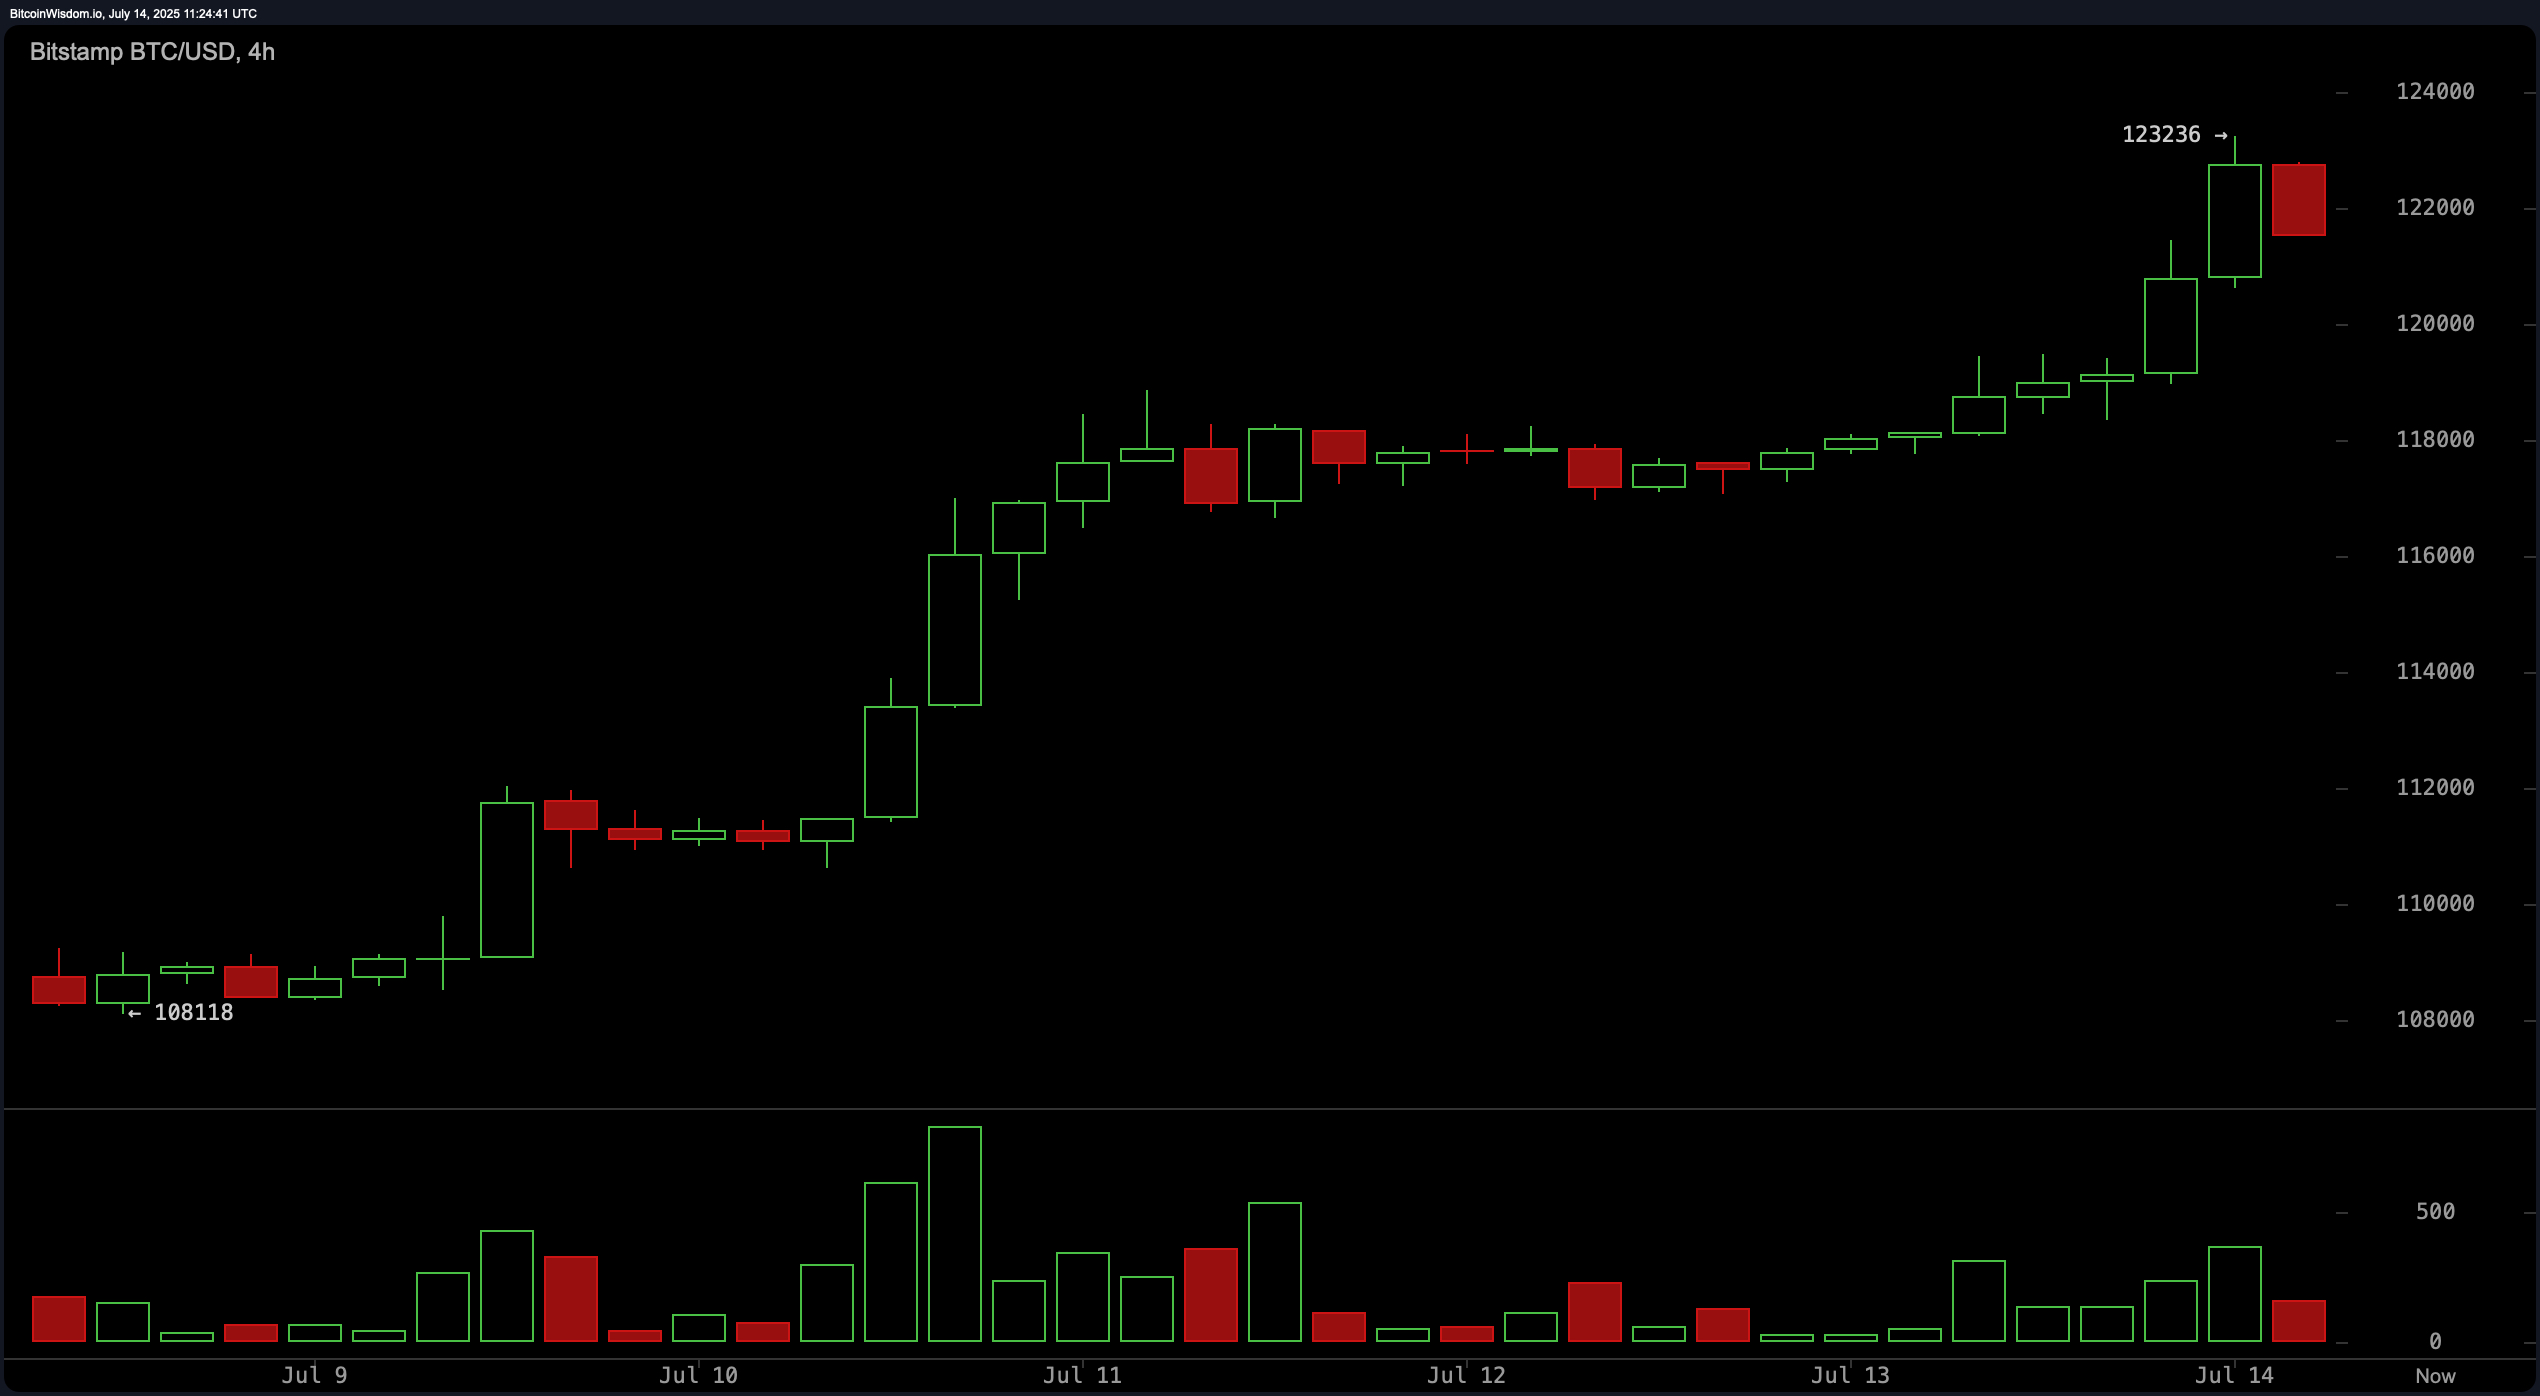
The 4-hour BTC/USD chart reveals a structured rally characterized by a staircase formation. However, the current candle pattern shows bearish tendencies following the recent high, with declining volume suggesting diminished buying enthusiasm. This bearish signal, while not indicative of a trend reversal, signals potential for a short-term retracement. Traders might consider entering on dips between $120,000 and $121,000, aiming for a retest of the $123,000 level or higher should momentum return.
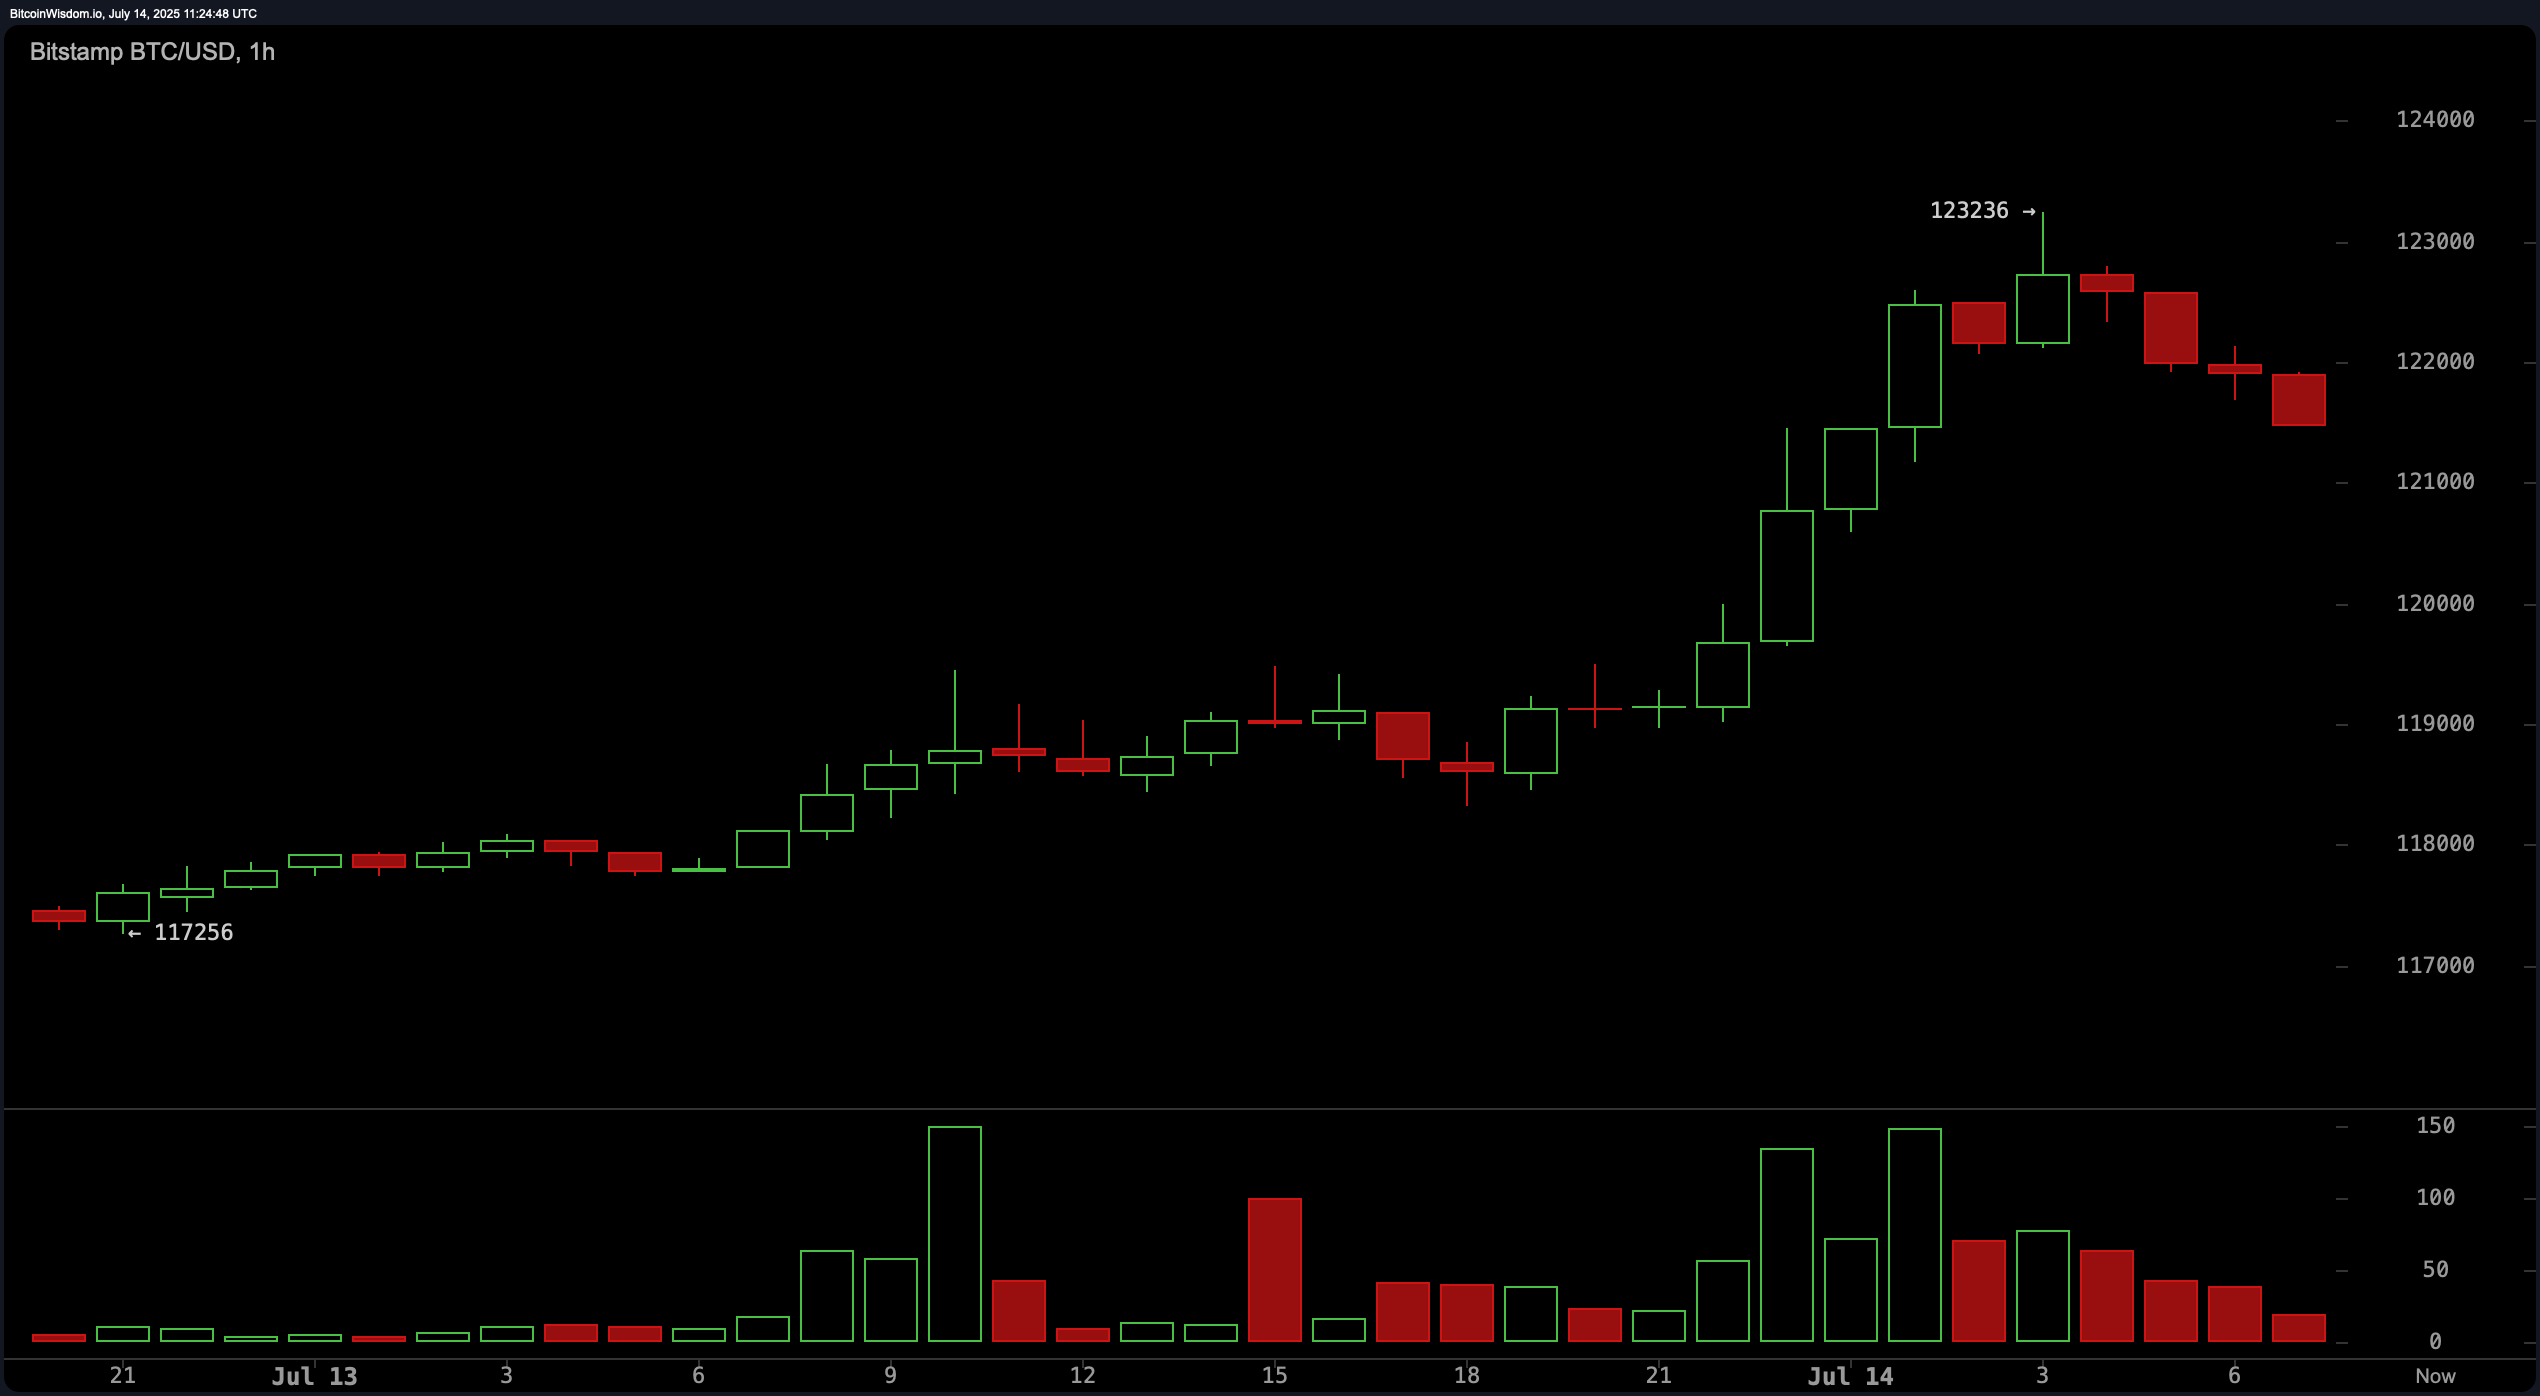
In the 1-hour timeframe, bitcoin‘s trajectory has entered a parabolic pattern that now appears to be cooling off. A sequence of lower highs has emerged following the peak at $123,236, accompanied by reduced trading volume. This aligns with the onset of profit-taking and possible RSI divergence. Scalpers are eyeing entry points between $121,000 and $121,500, with resistance expected once more near $123,000 unless accompanied by strong volume.
Oscillators present a mixed picture. The relative strength index (RSI) stands at 77.8, reflecting overbought conditions but categorized as neutral. The stochastic %K is also elevated at 92.7, maintaining a neutral bias. Meanwhile, the commodity channel index (CCI) at 195.6 suggests a sell condition, while the momentum indicator registers 13,559.0 and the moving average convergence divergence (MACD) level reads 3,380.0—both in buy territory. The awesome oscillator and average directional index (ADX) sit at neutral, indicating that momentum is present but potentially weakening.
Moving averages (MAs) confirm the overall bullish sentiment across all durations. Every short-, medium-, and long-term moving average, both exponential (EMA) and simple (SMA), are signaling buy. The exponential moving average (10) is at $115,153.0, while the simple moving average (200) rests at $97,133.0, underscoring how far price has moved above its long-term baseline. This alignment typically signals strength in trend direction, although traders should be vigilant of overextension in price relative to average levels.
Bull Verdict:
Bitcoin’s multi-timeframe structure, aligned moving averages, and strong momentum indicators support a bullish outlook. While short-term pullbacks are likely due to temporary exhaustion, the overall trend remains upward, with potential for continuation toward $125,000–$130,000 if resistance at $123,000 is breached with volume confirmation.
Bear Verdict:
Despite bitcoin’s upward momentum, signs of exhaustion and bearish divergence on lower timeframes suggest the current rally may be overextended. Failure to decisively break above $123,000 could trigger a retracement toward the $110,000–$112,000 zone, especially if declining volume persists and sentiment weakens.