With bitcoin priced at $89,907, boasting a market cap of $1.79 trillion and a brisk 24-hour trading volume of $45.09 billion, it’s clear the crypto king isn’t napping. But despite an intraday range between $88,532 and $90,788, the charts paint a picture less of a breakout bonanza and more of a waiting game with attitude.
Bitcoin Chart Outlook
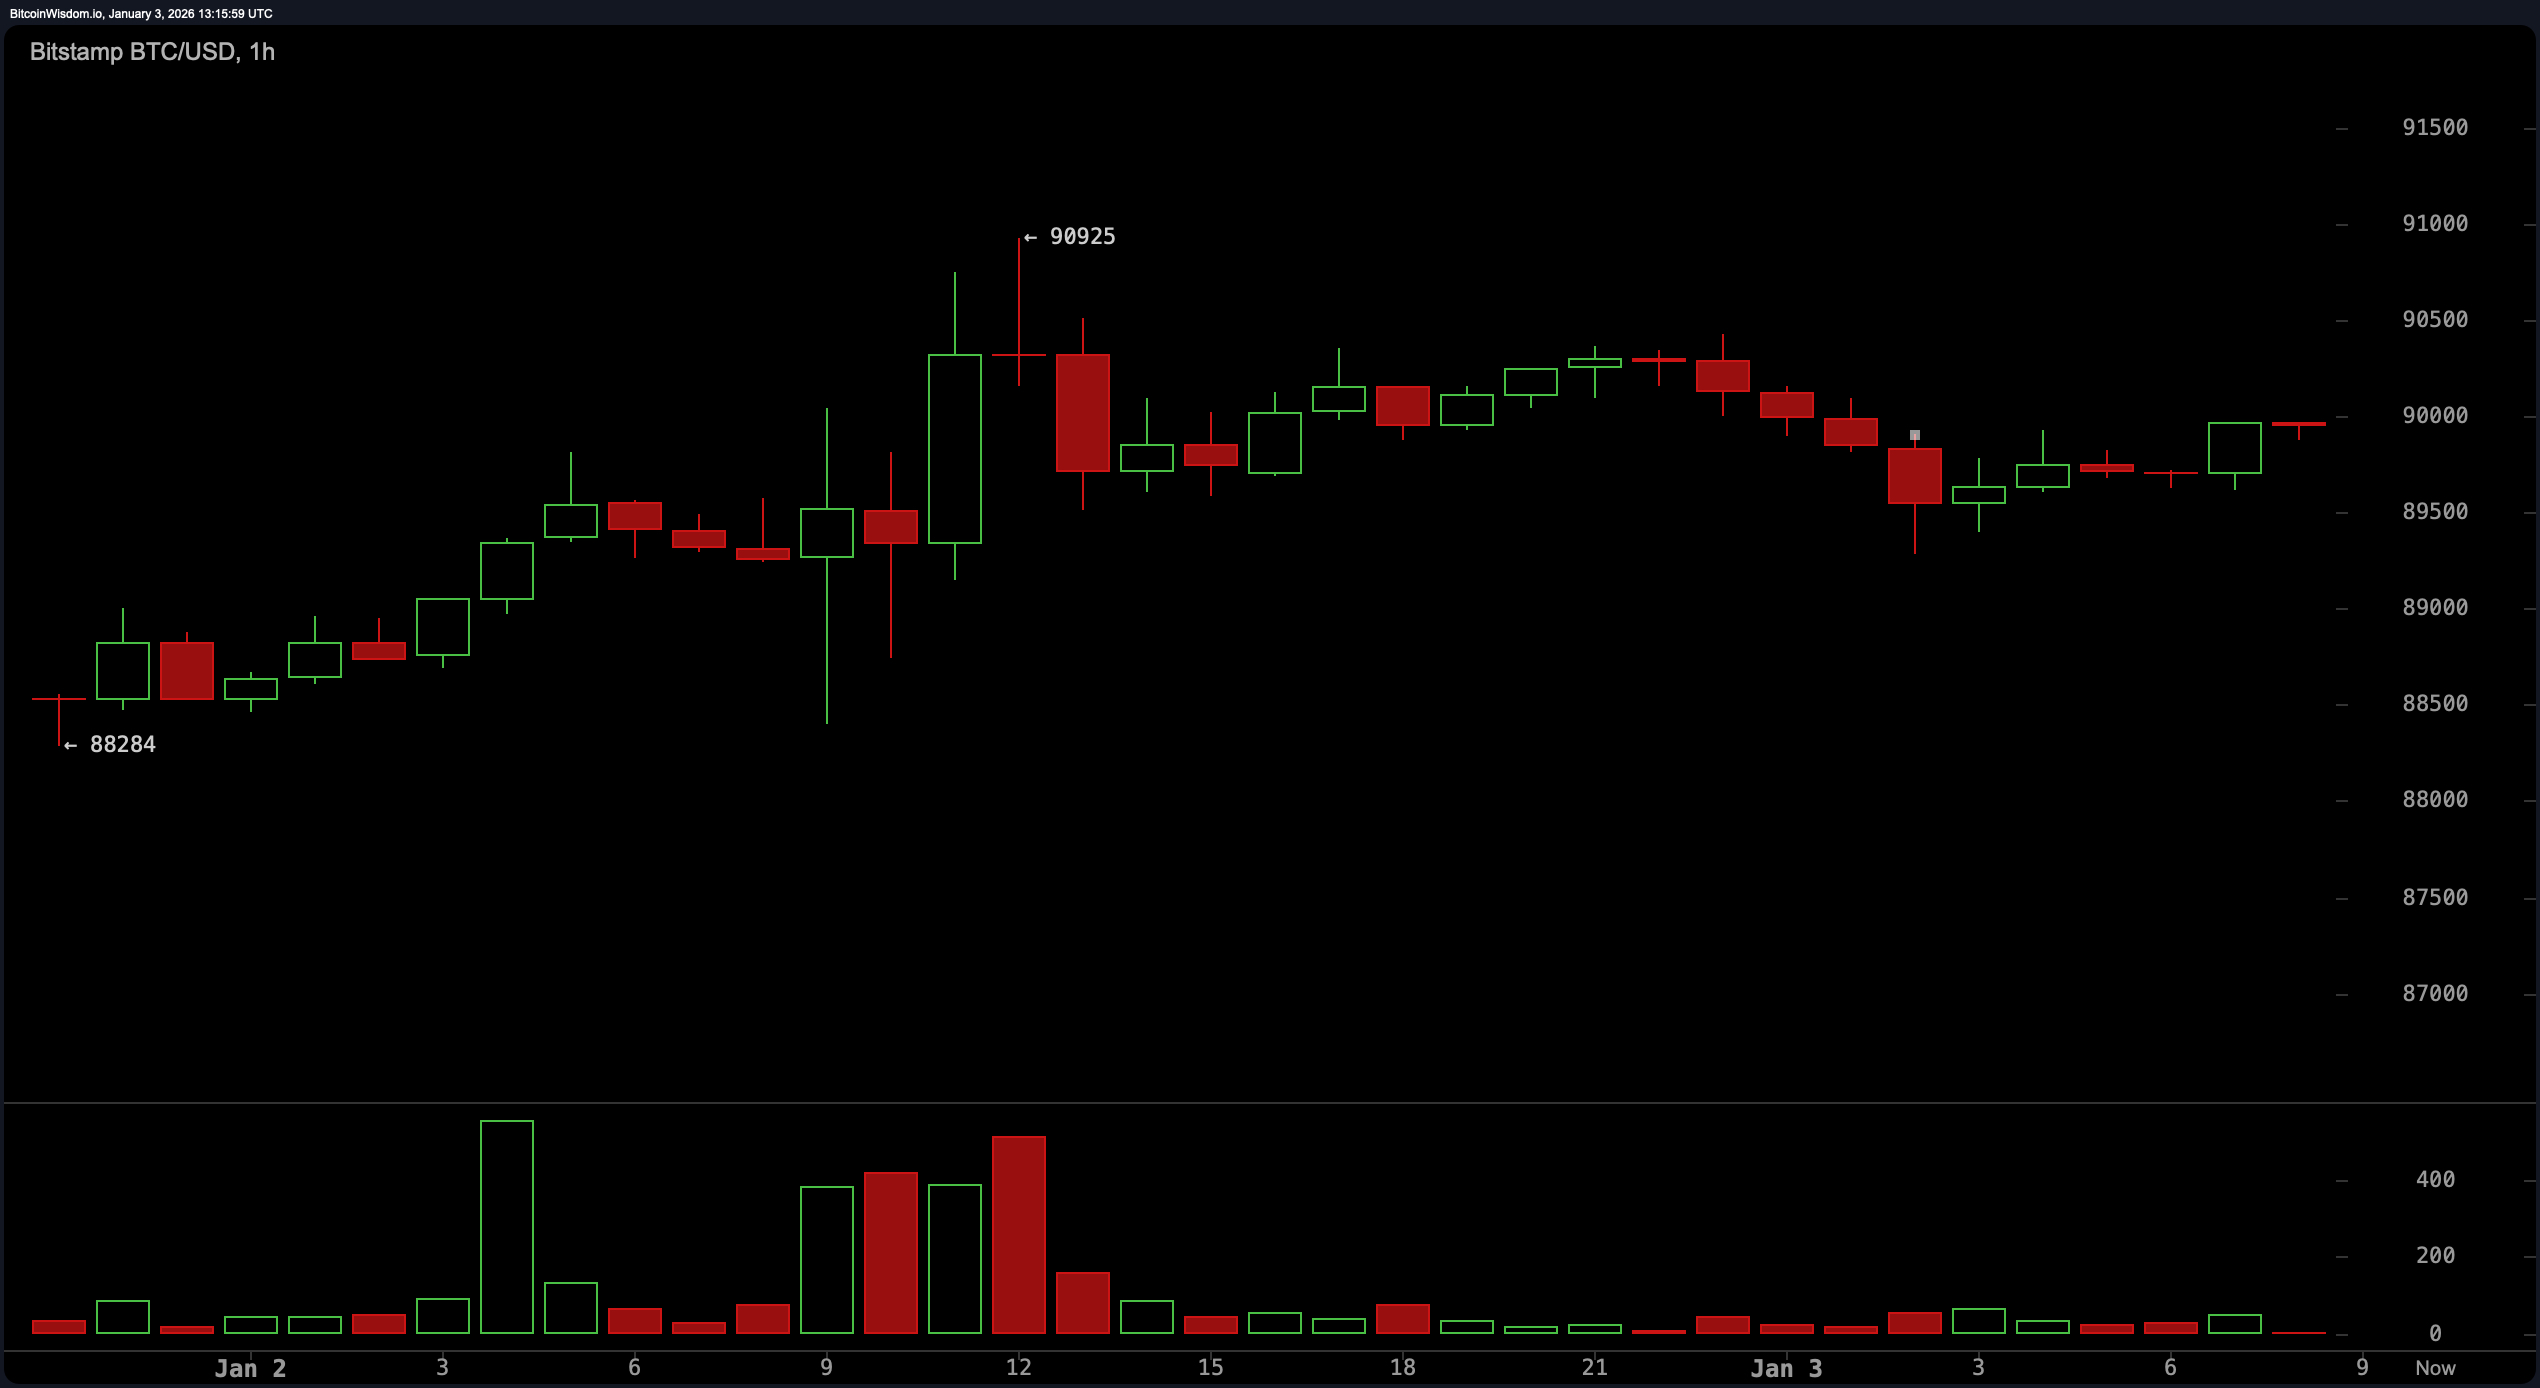
On the 1-hour chart, bitcoin’s price action resembles a jittery tango between the $88,500 support floor and the $91,000 resistance ceiling. Short bursts of volume appear when price touches the top of the range, only to be met with rejection—like a dance partner stepping on toes.
The intraday rhythm favors tactical entries near $88,800 to $89,200, as long as structure doesn’t crumble below $88,300. Exits are better timed near the $90,300 to $90,800 mark, unless buyers suddenly learn how to waltz past resistance with conviction.
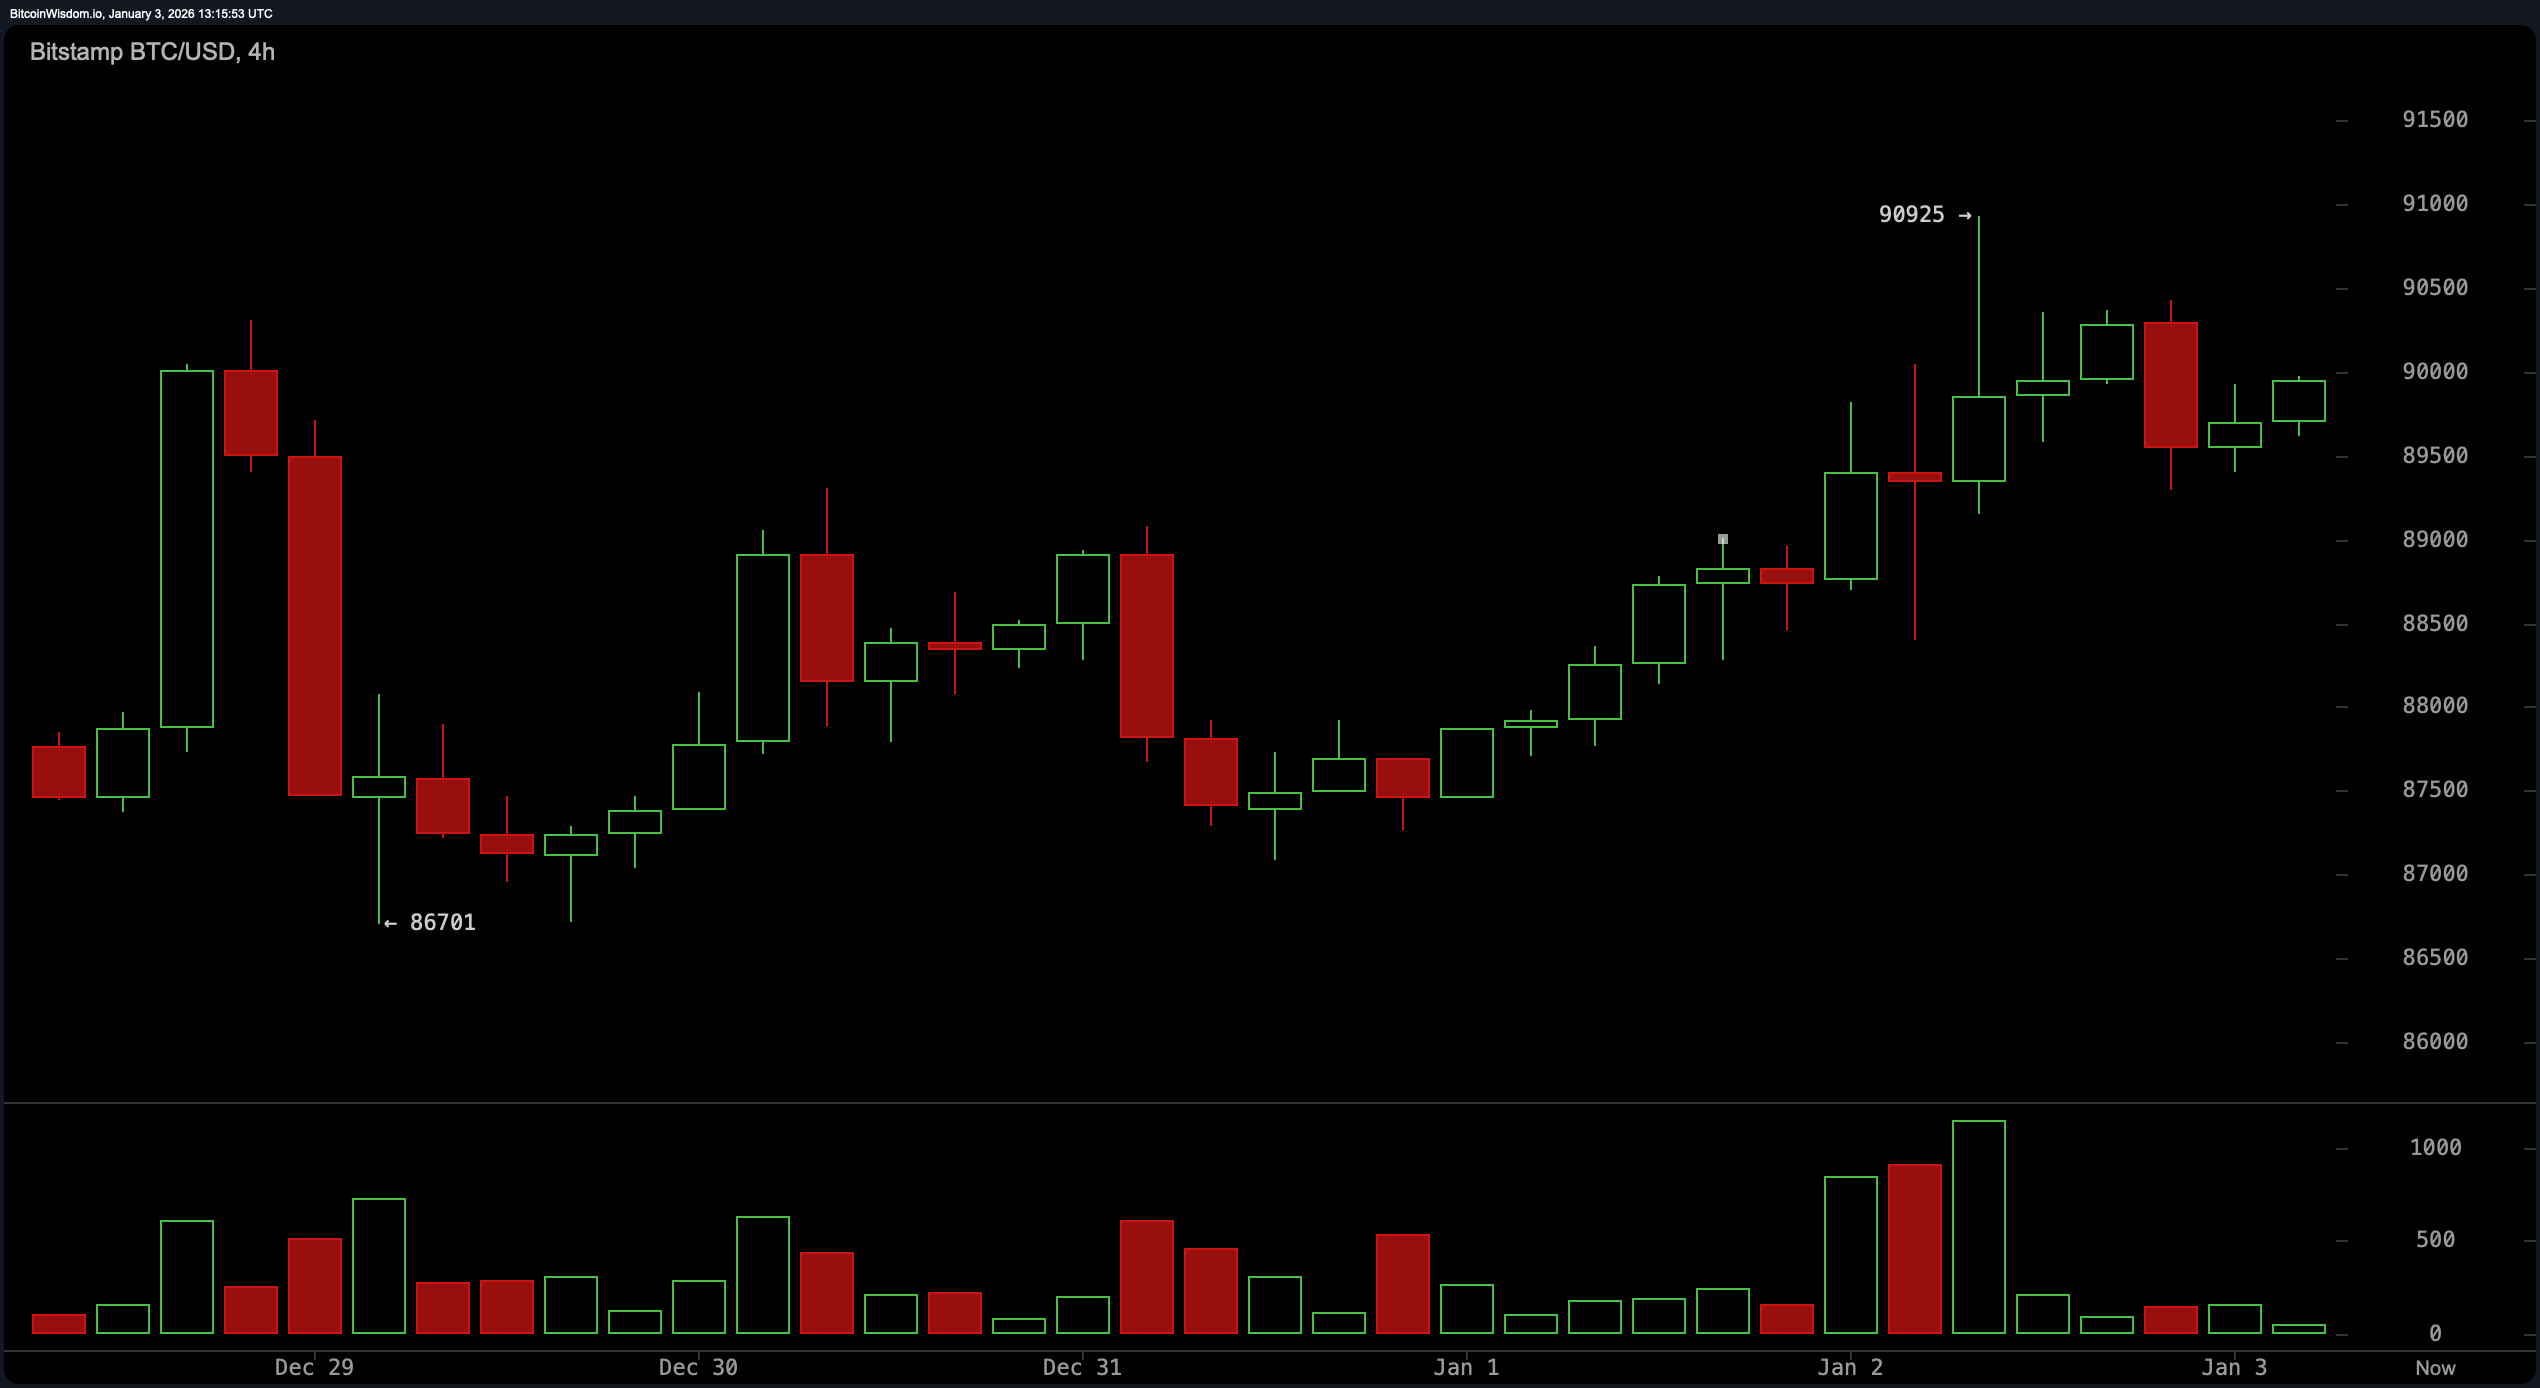
Zooming out to the 4-hour chart, the picture becomes one of cautious optimism. Since January 1, bitcoin has etched out higher highs and higher lows, which is lovely, if not entirely convincing. Dips are being defended, but with all the zeal of a sleepy guard dog. Attempts to breach the $90,900 to $91,000 level keep getting rebuffed, suggesting buyers might be saving their energy—or their funds—for another day. A drop below $87,500 would dent this fragile ascent, so traders should keep that line in their rearview mirror.
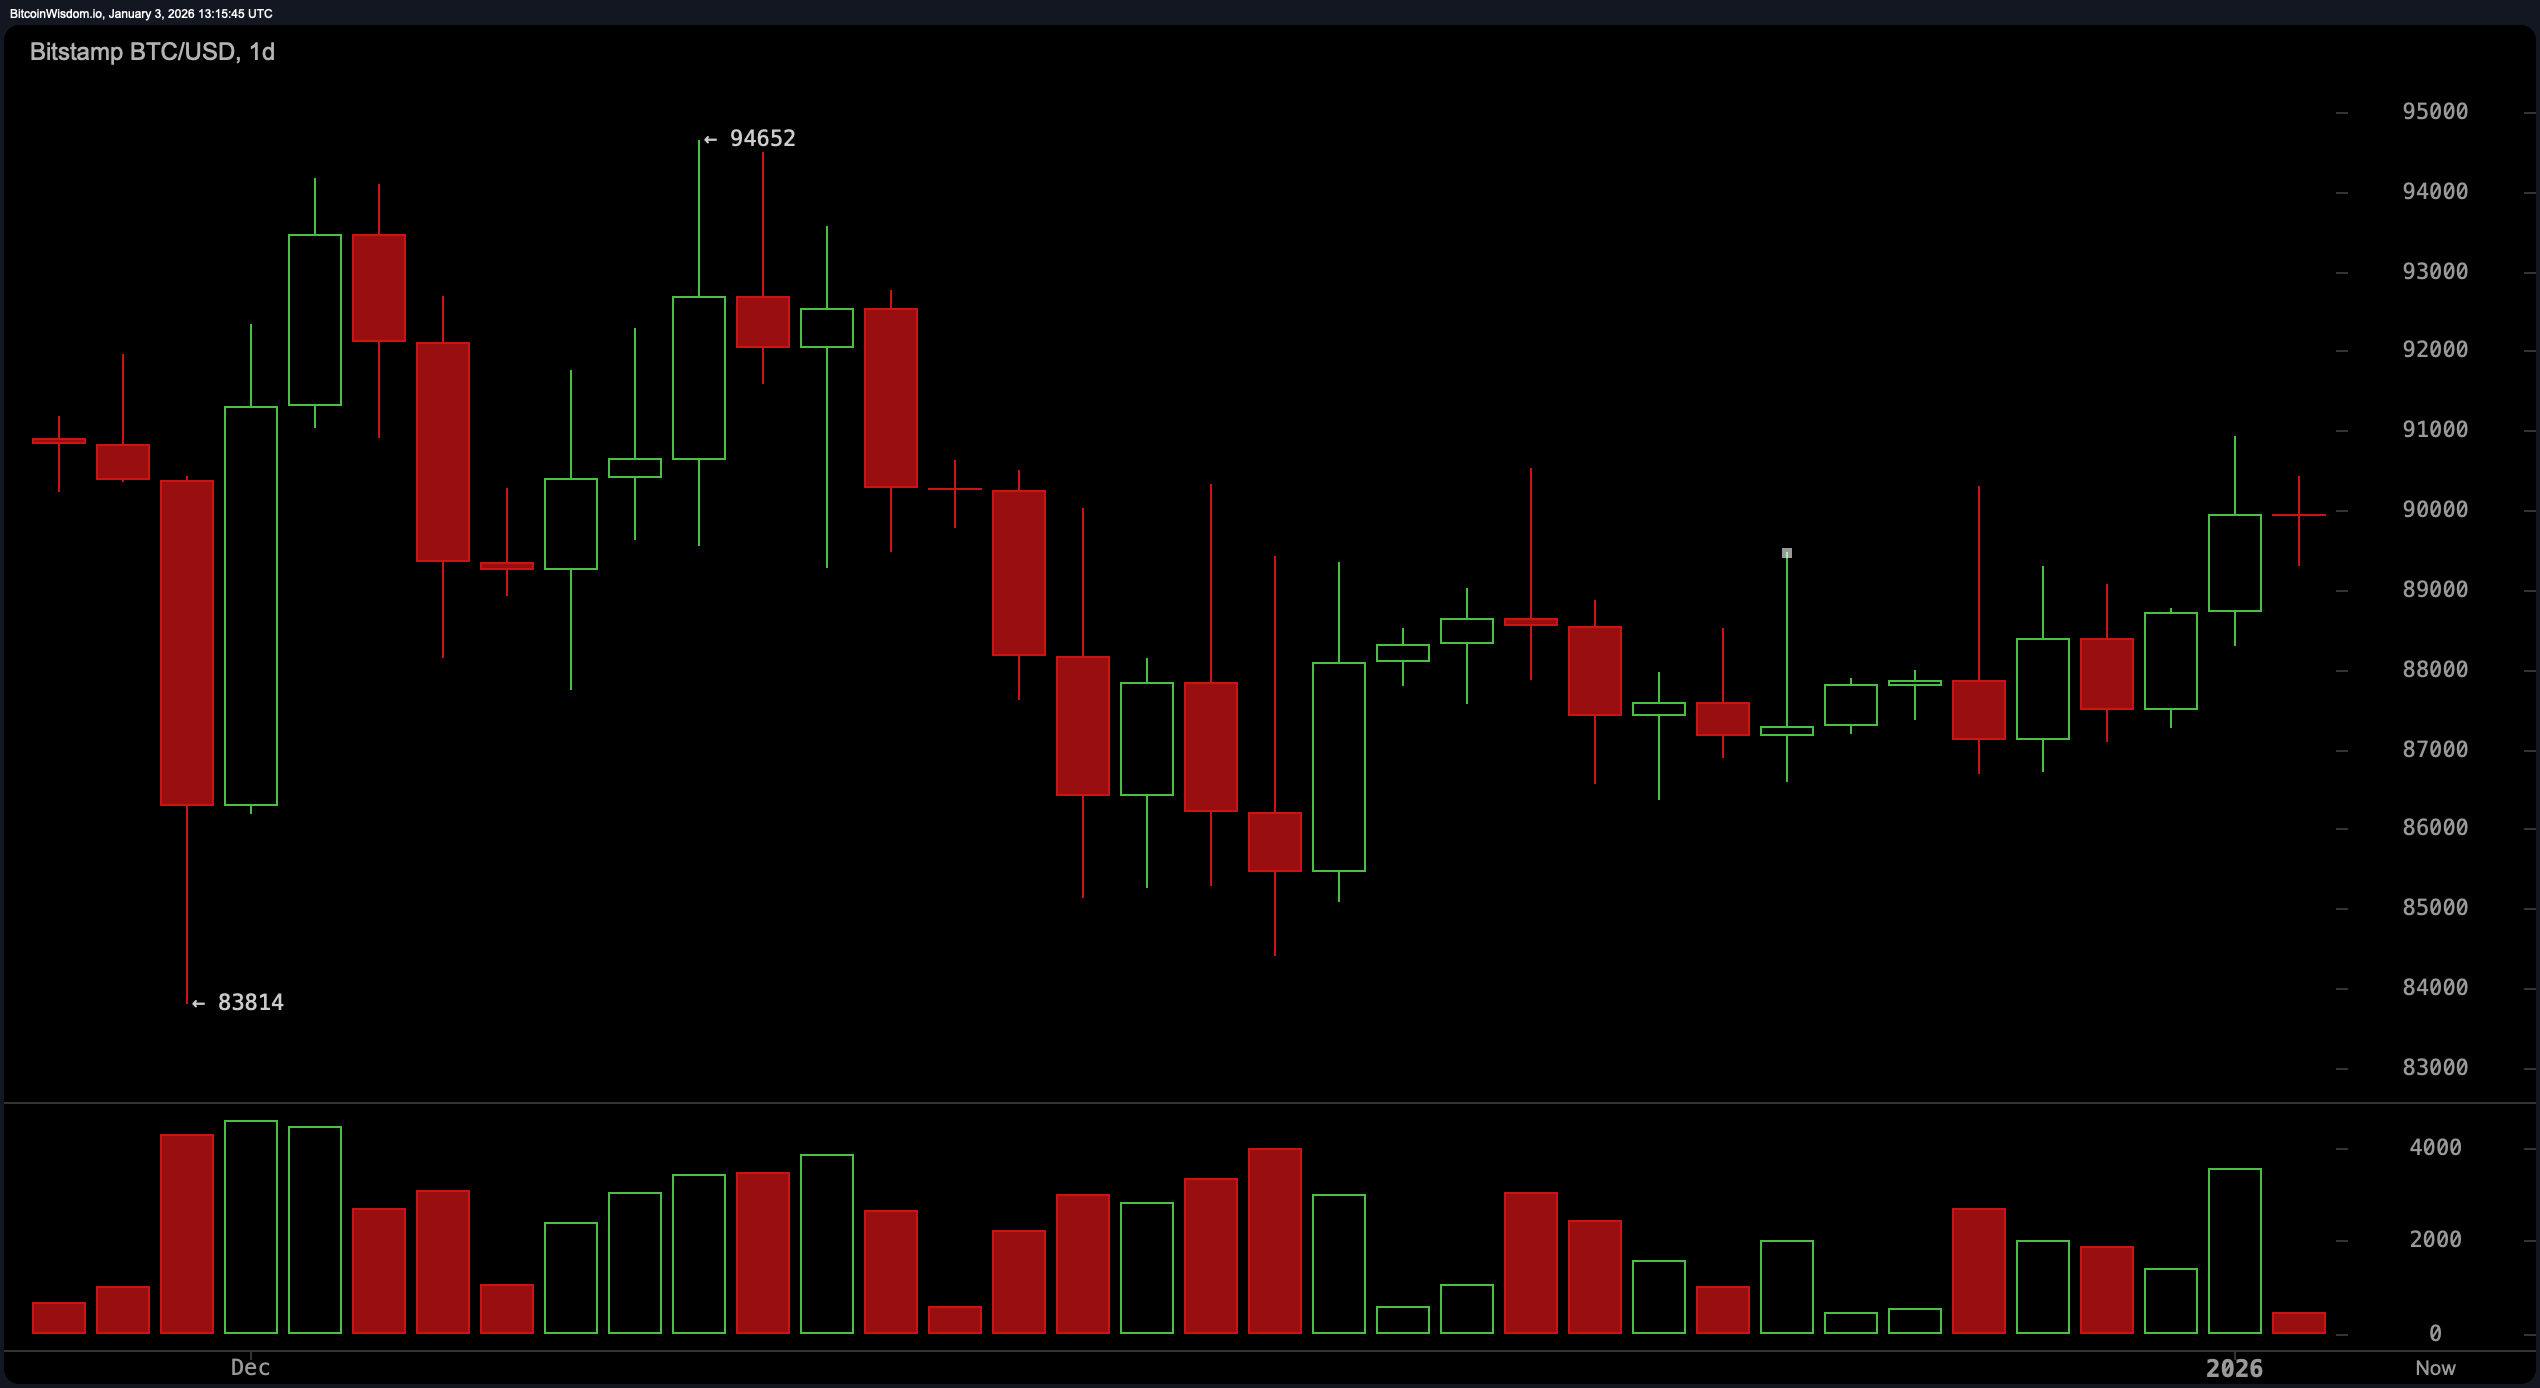
The daily chart reveals bitcoin is, frankly, in no hurry. Price is comfortably lounging in the upper half of a $84,000 to $95,000 range, perched above December’s bottom at $83,800 but nowhere near reclaiming the $94,500 to $95,000 summit. Without a convincing daily close outside the $86,000 to $92,000 zone, this range market looks set to continue. Volume isn’t exactly rushing to the party either, which supports the idea of consolidation over a breakout crescendo.
The oscillators are equally indecisive. The relative strength index ( RSI) reads a neutral 54, while the Stochastic oscillator sits at 74—neither too hot nor too cold. The commodity channel index (CCI) at 209 and the momentum indicator at 2,272 both lean bearish, but they’re not dragging the rest of the indicators with them. The moving average convergence divergence ( MACD) comes in with a value of -410, making a quiet case for some upside recovery, while the Awesome oscillator adds to the neutrality chorus with a subdued -370.
Moving averages (MAs) are caught in their own tug-of-war. Shorter-term exponential moving averages (EMAs) and simple moving averages (SMAs)—including the 10, 20, and 30-period variants—all support the current price action, giving it a modest nod. However, the 50-period EMA has turned its back, and the 100 and 200-period moving averages are straight-up pessimistic, flagging values far above the current price. It’s a split jury, but one thing’s clear: the burden of proof lies with bitcoin’s bulls.
In short, bitcoin isn’t giving away any secrets just yet. It’s a range-bound beast for now, and unless price decisively breaks above $92,000 or crumbles below $87,000 with muscle, the best trades will be the ones that keep their bags light and their exits nimble.
Bull Verdict:
If bitcoin can reclaim territory above $92,000 with a volume boost that doesn’t vanish like mist at sunrise, the path toward the $94,500–$95,000 zone reopens. Supportive short-term moving averages and higher lows across multiple timeframes suggest the bulls haven’t lost the script—just the spotlight.
Bear Verdict:
Should bitcoin falter below $87,000 with conviction, the range structure unravels, and eyes turn quickly toward the $84,000 level. With long-term moving averages firmly above the current price and several oscillators flashing caution, bears might not be charging yet—but they’re definitely circling.
FAQ ❓
- What is bitcoin’s current price? Bitcoin is trading at $89,907 as of January 3, 2026.
- Is bitcoin in a bullish or bearish trend? Bitcoin is consolidating in a neutral range between $88,532 and $90,788.
- What are key support and resistance levels for bitcoin?Support sits near $88,300–$89,000, with resistance at $90,800–$91,000.
- Are technical indicators bullish on bitcoin right now?Most oscillators and moving averages show mixed signals, favoring range-bound movement.